Articles > APP Price Target Alert: $100.00. Issued by Wedbush
Nick McKay from Wedbush issued a price target of $100.00 for APP on 2024-06-11 14:25:00. The adjusted price target was set to $100.00. At the time of the announcement, APP was trading at $77.35. The overall price target consensus is at $69.06 with high price of $118.00, low price of $14.00, and median price is at $70.00. APP currently trades -12.66% versus its 52 week high of $88.50, and 21.87% compared to its 52 week low price of $21.87. Current 50 day moving average is $78.96, and the 200 day moving average is $59.46.
For more information:
Historical Price Targets Hiistorical Analyst Recommendations Earning Price Impact Analysis Seasonality Analysis
APP Price Target Alert: $100.00. Issued by Wedbush
By KlickAnalytics Data Insights | June 11, 2024 06:00PM ET
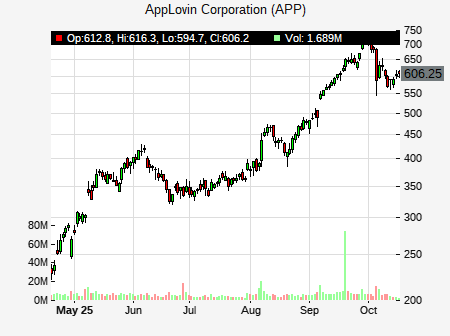
Historical Price Performance
Historical Price Targets
| Last Month | Last Quarter | Last Year | All Time | |
| Average Price Target | 88.00 | 77.60 | 69.81 | |
| vs. Current Price $77.30 | % | -12.16% | -0.39% | 10.72% |
Analyst Price Targets
Last 10 Price Targets| Published Date | Analyst Name | Analyst Company | Price Target | Price Target (Adjusted) | Price When Published | Current Price vs. Price Target |
| 2024-06-11 | Nick McKay | Wedbush | 100.00 | 100.00 | 77.35 | -22.71% |
| 2024-05-09 | Clark Lampen | BTIG | 100.00 | 100.00 | 74.00 | -22.71% |
| 2024-04-15 | Jonathan Kees | Daiwa | 80.00 | 80.00 | 75.57 | -3.38% |
| 2024-04-09 | Clark Lampen | BTIG | 87.00 | 87.00 | 78.05 | -11.16% |
| 2024-04-08 | Martin Yang | Oppenheimer | 85.00 | 85.00 | 74.80 | -9.06% |
| 2023-08-01 | David Pang | Stifel Nicolaus | 36.00 | 36.00 | 31.43 | 114.71% |
| 2023-02-09 | Nick McKay | Wedbush | 23.00 | 23.00 | 16.43 | 236.07% |
| 2022-11-30 | Andrew Uerkwitz | Jefferies | 14.00 | 14.00 | 13.44 | 452.11% |
| 2022-09-13 | Oppenheimer | 45.00 | 45.00 | 26.85 | 71.77% | |
| 2022-08-23 | Citigroup | 60.00 | 60.00 | 25.55 | 28.83% |
For more information:
Disclaimer: the above is a summary showing certain market information. KlickAnalytics is not responsible for any data errors, omissions or other information that may be displayed incorrectly as the data is derived from various resources and more. Communications displaying market prices, data and other information available in this post are meant for purely for informational purposes only and are not intended as an offer or solicitation for the purchase or sale of any security. Please do your own research when investing. All investments involve risk and the past performance of a security, or financial product does not guarantee future results or returns. Keep in mind that while diversification may help spread risk, it does not assure a profit, or protect against loss in a down market.