Articles > Underperform Recommendation Issued On CME By Barclays
Barclays analyst issues UNDERPERFORM recommendation for CME on April 3, 2024 05:00PM ET. The previous analyst recommendation was Underperform. CME was trading at $212.03 at issue of the analyst recommendation. The overall analyst consensus : BUY. Current analyst recommendations are : 7 - Buy, 4 - Hold, 1 - Sell recommendations .
For more information:
Analyst Recommendations Historical Price Targets Earning Price Impact Analysis Seasonality Analysis
Underperform Recommendation Issued On CME By Barclays
By KlickAnalytics Data Insights | April 3, 2024 06:30PM ET
Historical Analyst Recommendations
Latest 10 recommendations| Report Date | Analyst Company | Action | Previous Grade | New Grade | Price when posted | 2024-04-03 | Barclays | Hold | Underperform | Underperform | 212.03 | 2024-04-03 | Keefe, Bruyette & Woods | Hold | Market Perform | Market Perform | 212.03 | 2024-04-02 | Bank of America Securities | Hold | Neutral | Neutral | 212.02 | 2024-03-06 | Goldman Sachs | Hold | Buy | Buy | 219.69 | 2024-02-15 | Goldman Sachs | Hold | Equal-Weight | Equal-Weight | 212.37 | 2024-02-15 | Barclays | Hold | Underperform | Underperform | 212.37 | 2024-01-08 | Barclays | Downgrade | Sell | Equal-Weight | 199.38 | 2023-10-26 | Barclays | Hold | Sell | Sell | 215.43 | 2023-10-26 | Morgan Stanley | Hold | Equal-Weight | Equal-Weight | 215.43 | 2023-10-12 | Citigroup | Hold | Buy | Buy | 219.94 |
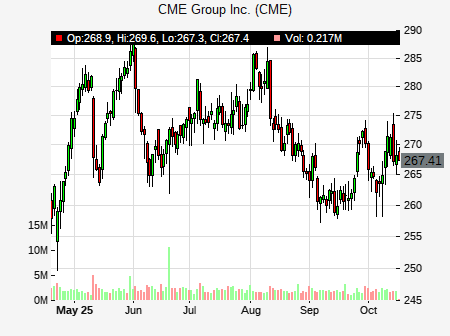
Historical Price Performance
For more information:
This article was generated by KlickAnalytics data insight content engine.
Disclaimer: the above is a summary showing certain market information. KlickAnalytics is not responsible for any data errors, omissions or other information that may be displayed incorrectly as the data is derived from various resources and more. Communications displaying market prices, data and other information available in this post are meant for purely for informational purposes only and are not intended as an offer or solicitation for the purchase or sale of any security. Please do your own research when investing. All investments involve risk and the past performance of a security, or financial product does not guarantee future results or returns. Keep in mind that while diversification may help spread risk, it does not assure a profit, or protect against loss in a down market.