What's New
Product updates, improvements and fixes across the KlickAnalytics platform.
Introducing Decision AI: Ask the Market a Question. Get an Answer Your Code Can Use.
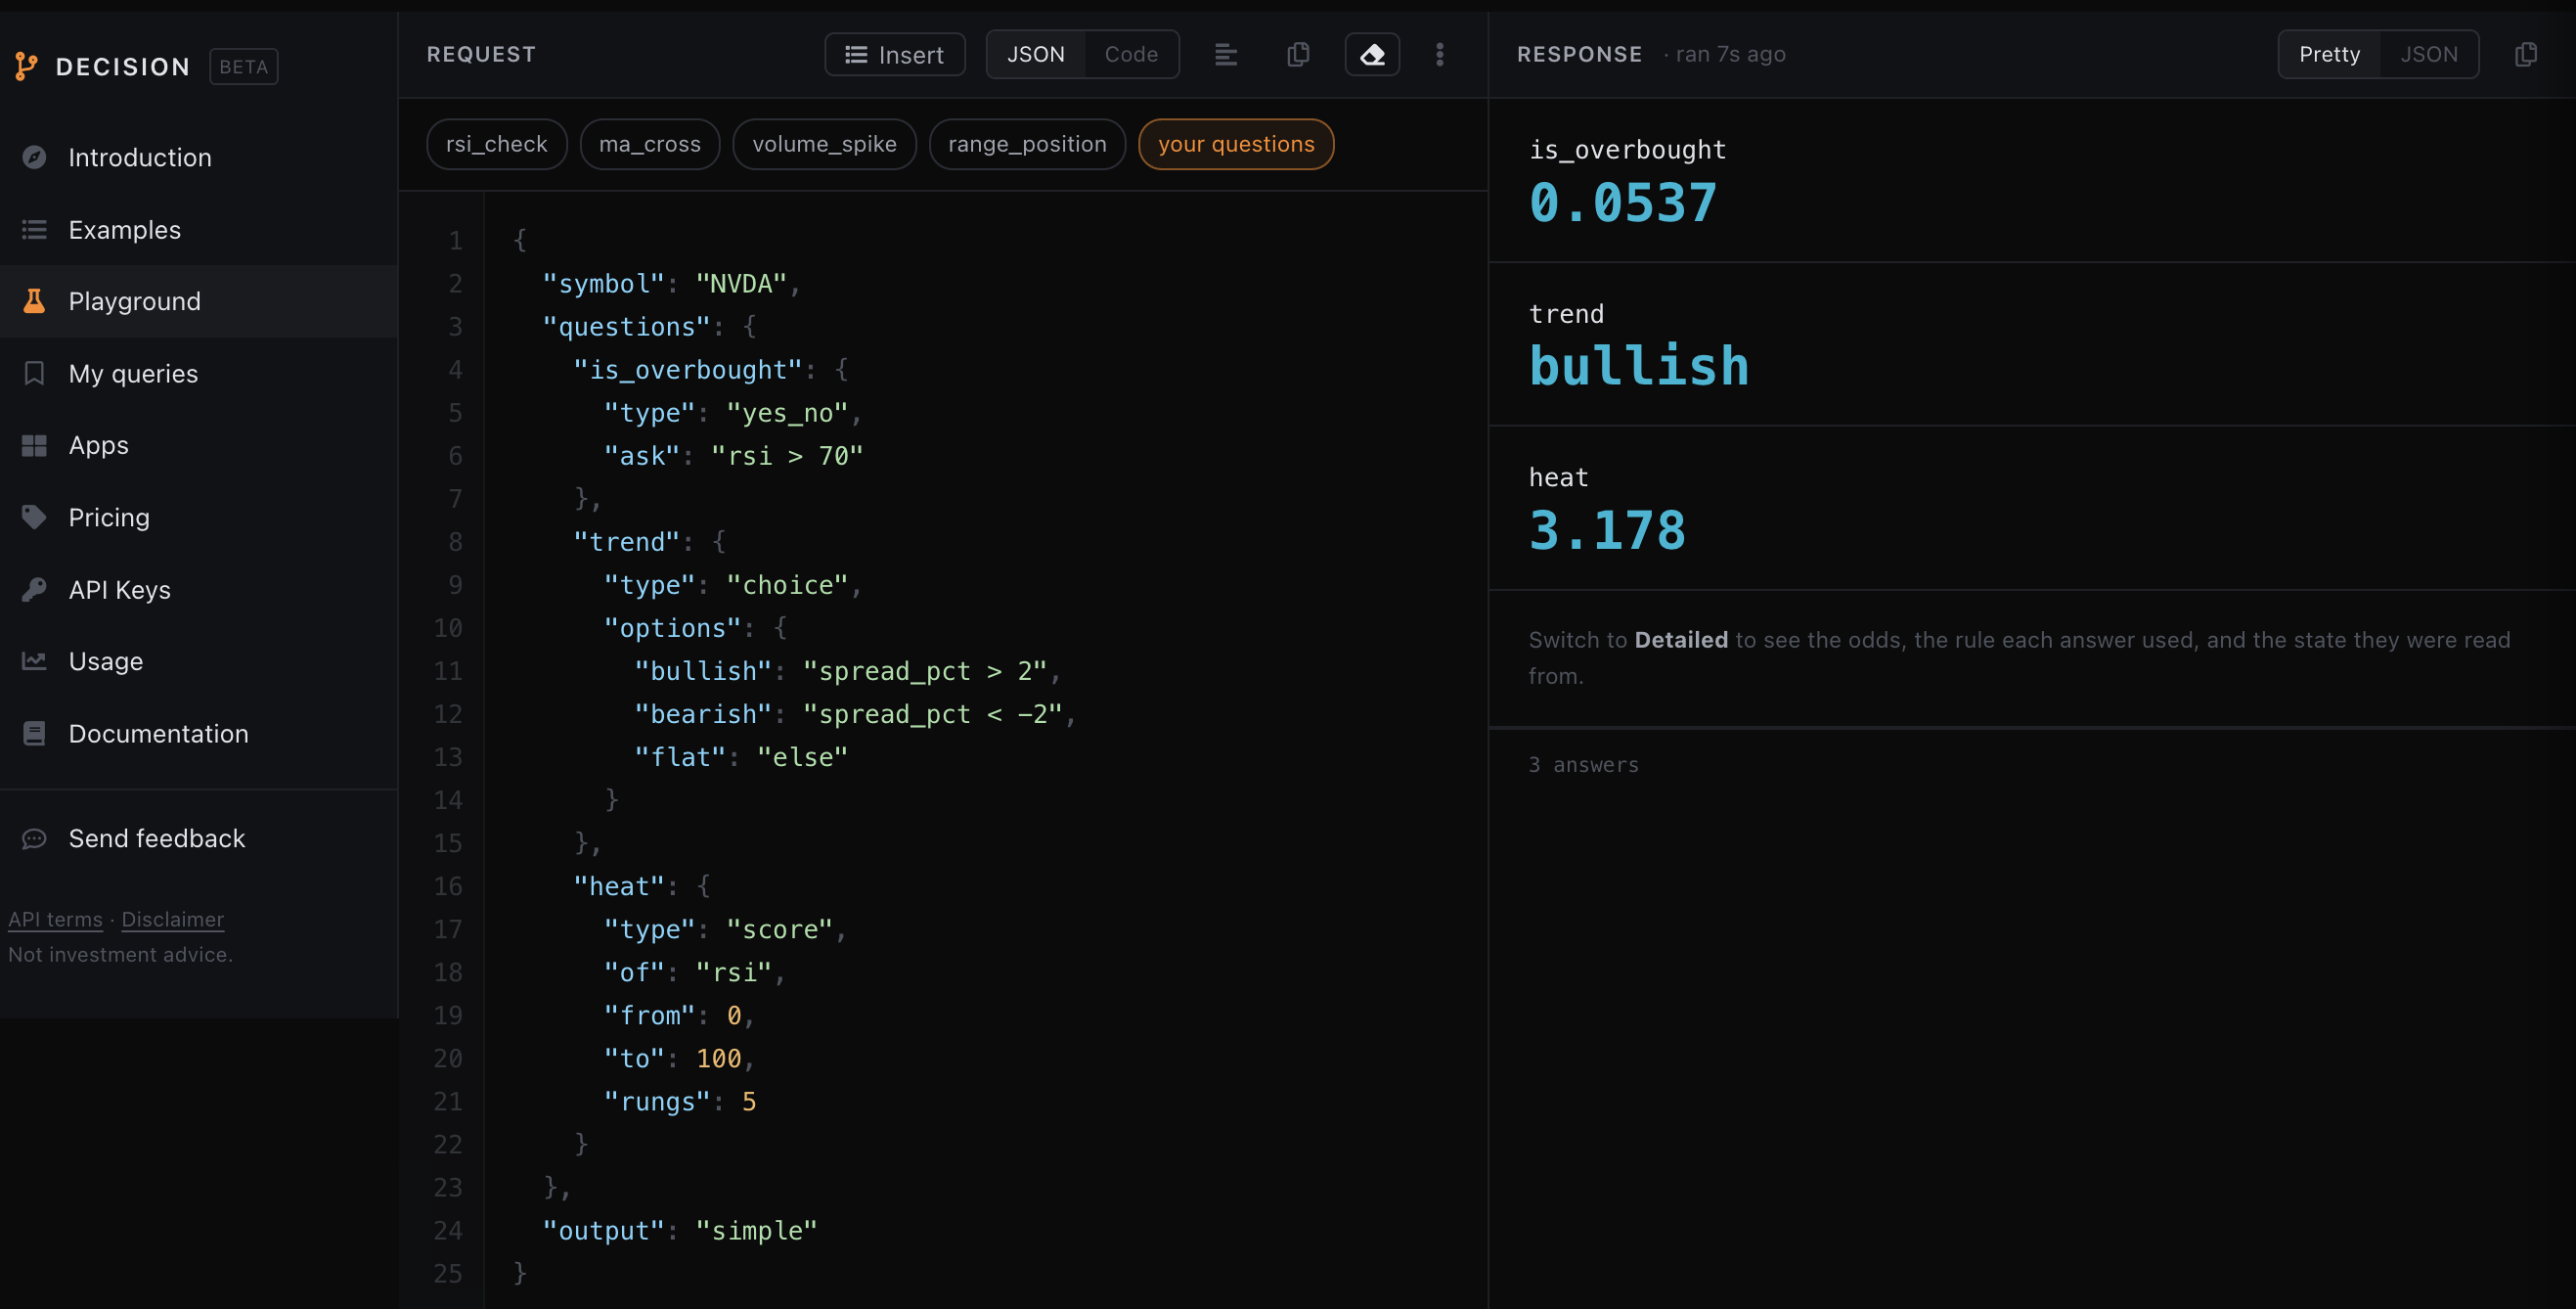
Introducing Decision AI: Ask the Market a Question. Get an Answer Your Code Can Use.
This is one of the most significant KlickAnalytics releases to date.
Most financial APIs return data. KlickAnalytics Decision AI returns an answer.
Send a small JSON request describing the market question you need answered. KlickAnalytics sources the data, performs the calculations, applies the decision logic, and returns a typed result your application can immediately evaluate, rank, display, or act on.
Instead of receiving raw prices and building the entire analytical pipeline yourself, you can ask:
-
Is this stock overbought?
-
Is the current trend bullish, bearish, or neutral?
-
Which symbols rank highest under this strategy?
-
How strong is the current momentum?
-
What is the probability that a condition is true?
-
What is the underlying calculated value?
Decision AI returns structured answer types designed for software:
-
yes_no— a probability between 0 and 1 -
choice— a selected outcome with probabilities for every alternative -
score— a value positioned on a defined scale -
rank— an ordered list of candidates with their relative strengths -
amount— the underlying calculated number
The Complete Decision Stack in One Request
Decision AI removes the need to independently build and maintain:
-
The data layer
-
Historical ingestion and storage
-
Corporate-action adjustments
-
Indicator calculations
-
Screening and comparison logic
-
Threshold and scoring systems
-
Ranking infrastructure
-
AI interpretation
-
Structured response schemas
The API is powered by KlickAnalytics’ global market infrastructure, with more than 80,000 symbols across equities, ETFs, foreign exchange, crypto, and global exchanges. Historical prices are adjusted for splits and dividends, while indicators and analytical states are computed from the underlying market data.
Rule-based questions are evaluated deterministically and can return in under 50 milliseconds. Questions requiring interpretation can be handled by an AI model using the same computed market state, with every response identifying how the answer was produced.
Build Your Own Decision Logic
Developers are not limited to predefined endpoints.
Create custom questions directly in JSON, combine multiple decisions in one request, define thresholds, compare alternative outcomes, score market conditions, and rank entire groups of securities.
One request can determine whether a stock is overbought, classify its trend, calculate a market-heat score, and return the underlying values used in those decisions.
Request the simple response for a clean verdict and confidence level, or request the full response to receive the supporting checks, calculations, and evidence behind it.
From Data Access to Decision Infrastructure
Decision AI can power:
-
Trading and investment applications
-
Portfolio monitoring systems
-
Research platforms
-
Automated screeners
-
Risk and compliance workflows
-
Alerts and market surveillance
-
AI agents and financial copilots
-
Broker and wealth-management experiences
-
Internal tools for banks, funds, and investment teams
No SDK to install. No CSV files. No vendor onboarding. No historical backfill. No separate calculation engine.
Just ask a market question—and receive a structured, explainable answer your software can use.
KlickAnalytics Decision AI is where market data becomes decision infrastructure.
To access: From the Menu > Decision > Playgound
A Smarter View of Analyst Price Targets
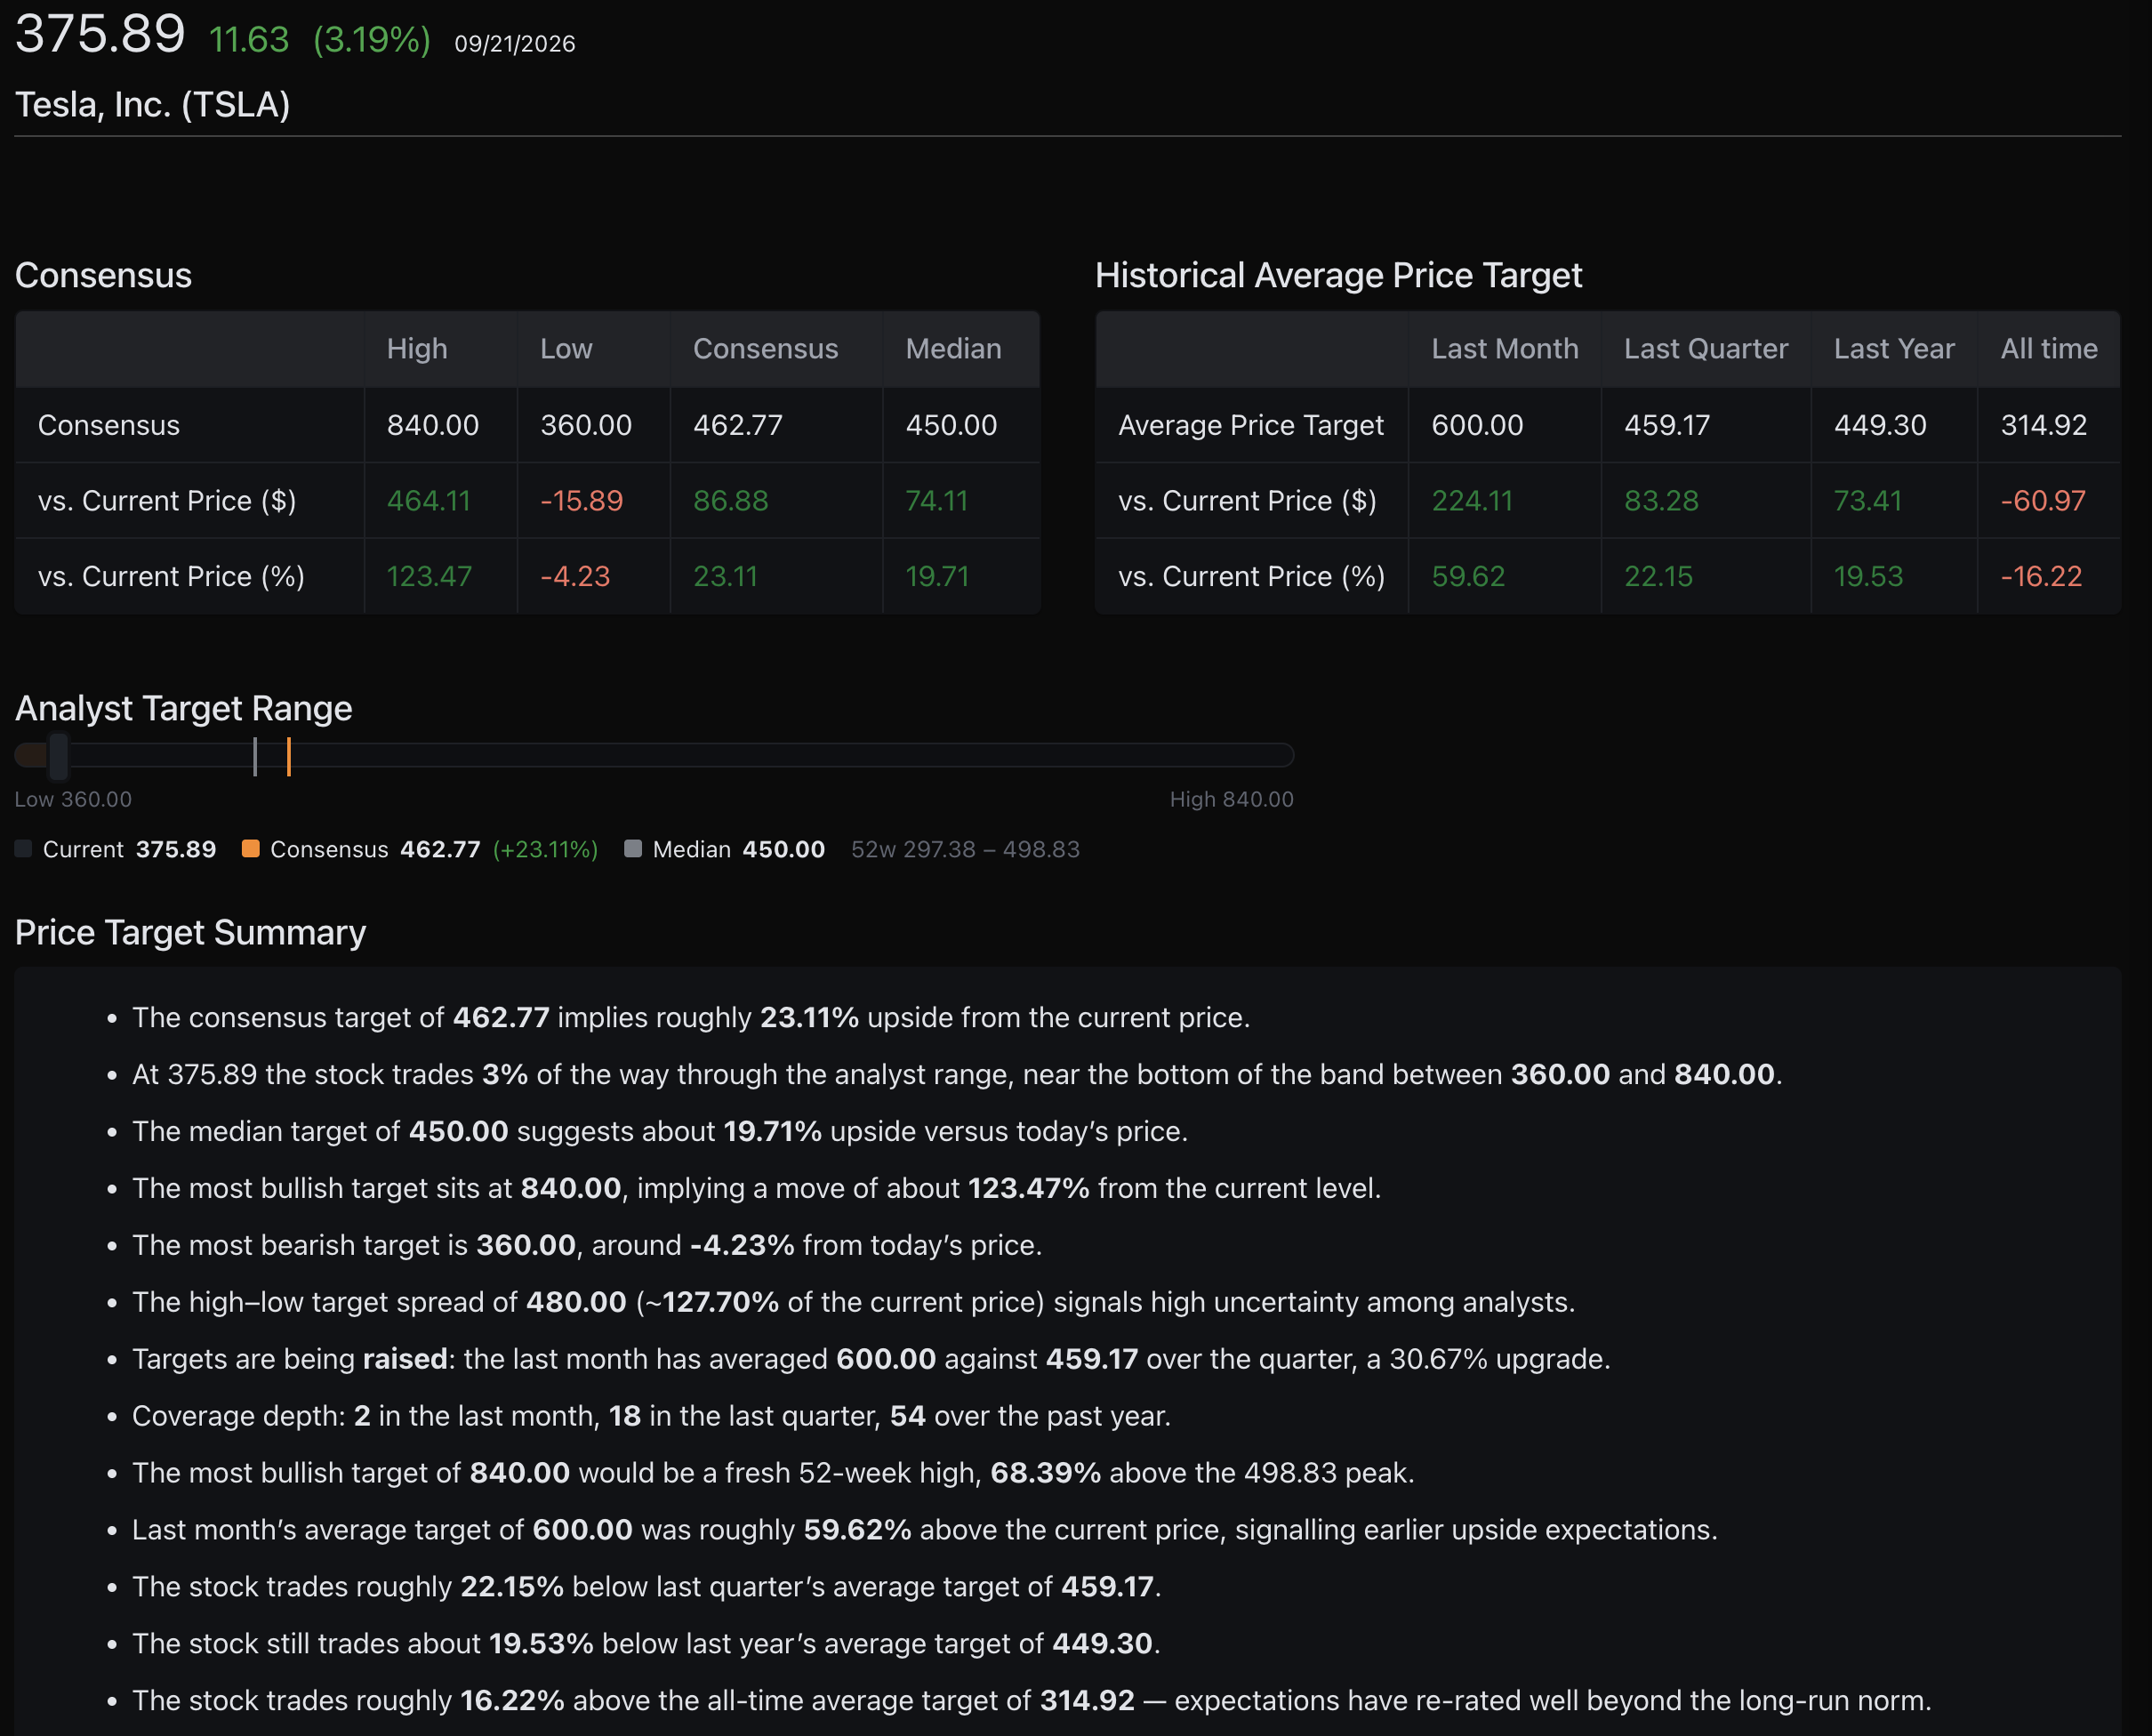
KlickAnalytics now gives you a deeper view of analyst expectations—showing not only the current consensus price target, but how targets are distributed, changing, and positioned against the stock’s current price.
Quickly evaluate:
-
High, low, consensus, and median price targets
-
Implied upside or downside from the current price
-
Where the stock trades within the complete analyst target range
-
Historical average targets over the last month, quarter, year, and all time
-
Whether analyst expectations are being raised or lowered
-
The spread between bullish and bearish targets
-
Coverage depth across recent periods
-
How targets compare with the stock’s 52-week range
A new automatically generated Price Target Summary translates the data into clear observations—highlighting changes in expectations, analyst disagreement, potential upside or downside, and longer-term shifts in market sentiment.
See the range. Track changing expectations. Understand what analysts are pricing in.
To access: Search for any symbol say TSLA, and click Company > Price targets
New: Top Analysts—See the Record Behind Every Call
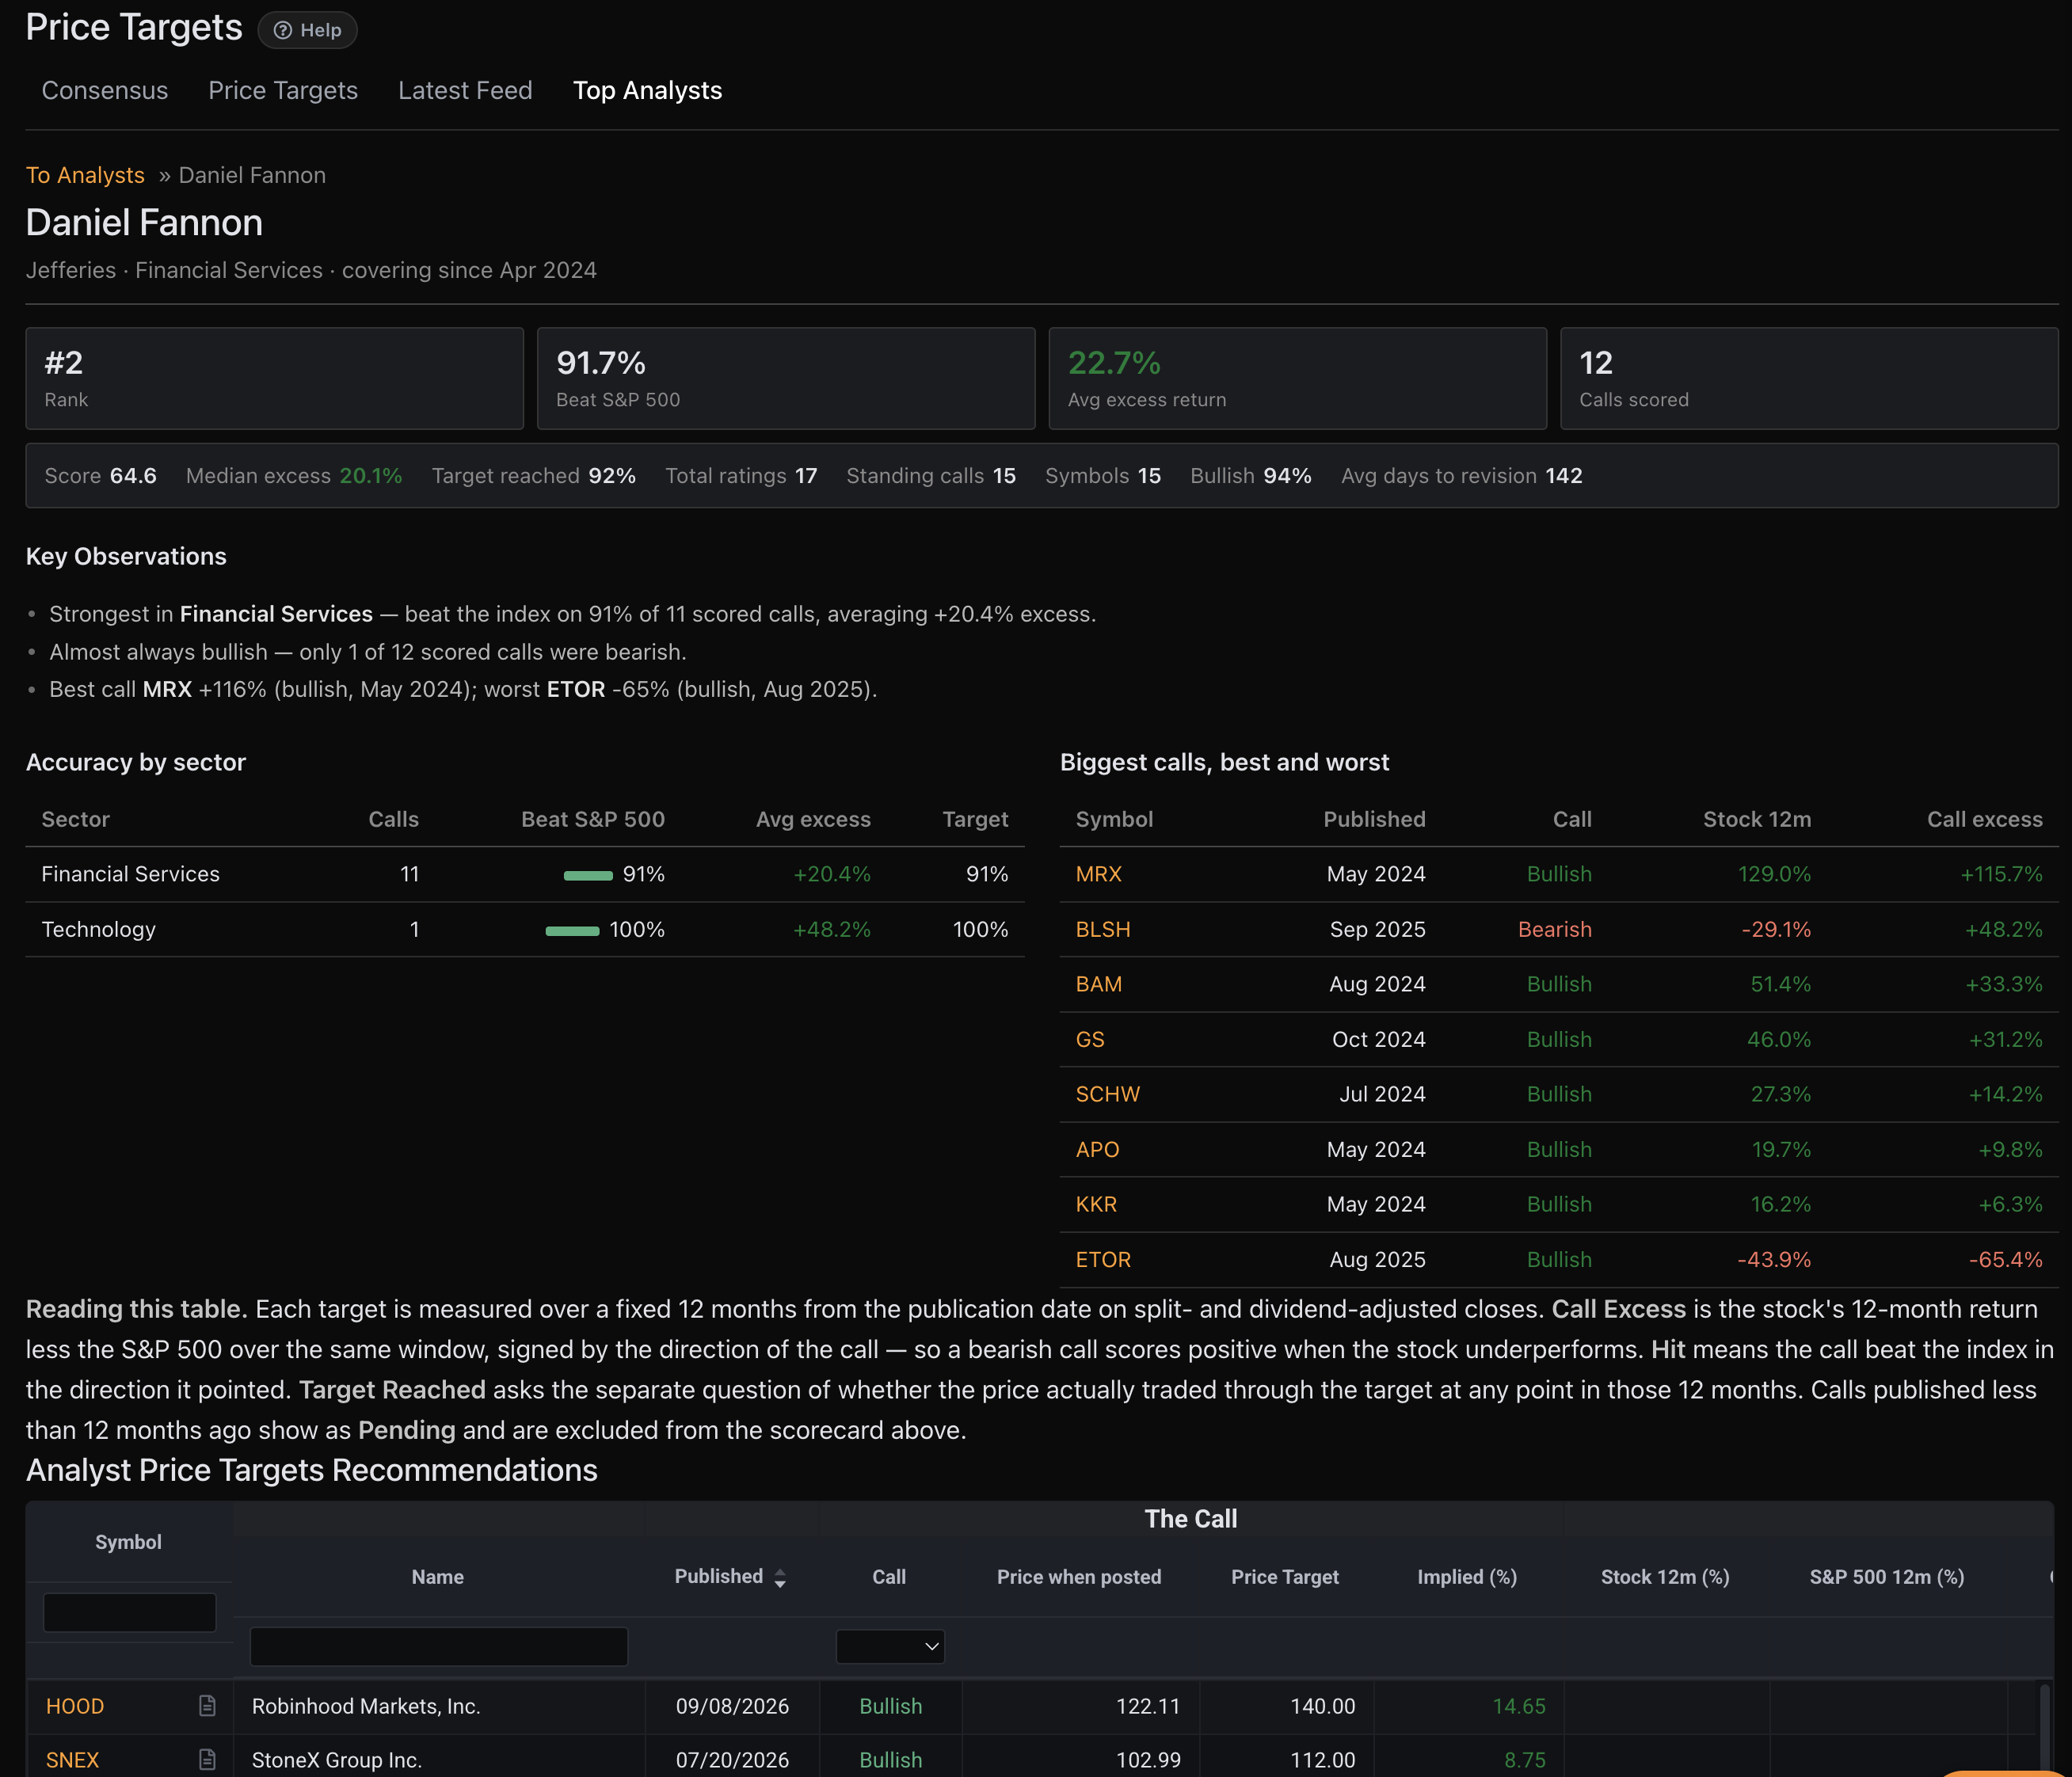
KlickAnalytics now lets you evaluate analysts using their actual historical performance—not just their latest rating or price target.
Each analyst profile provides a transparent, standardized scorecard, including:
-
Overall analyst rank and performance score
-
Percentage of calls that beat the S&P 500
-
Average and median excess returns
-
Price-target achievement rate
-
Bullish and bearish call history
-
Sector-level accuracy and specialization
-
Best and worst historical calls
-
Average time between recommendation revisions
-
Complete coverage across symbols and published ratings
Every eligible call is evaluated over a consistent 12-month period using split- and dividend-adjusted prices. KlickAnalytics also distinguishes between outperforming the benchmark and merely reaching a price target—giving you a more meaningful view of analyst skill.
You can then review the complete recommendation history, including the publication date, original share price, target price, implied return, subsequent stock performance, and benchmark-relative result.
Know who made the call. See how it performed. Decide whose research deserves your attention.
To access: From the Menu > Stocks > Top Analysts
Global Live TV—Inside Your Terminal
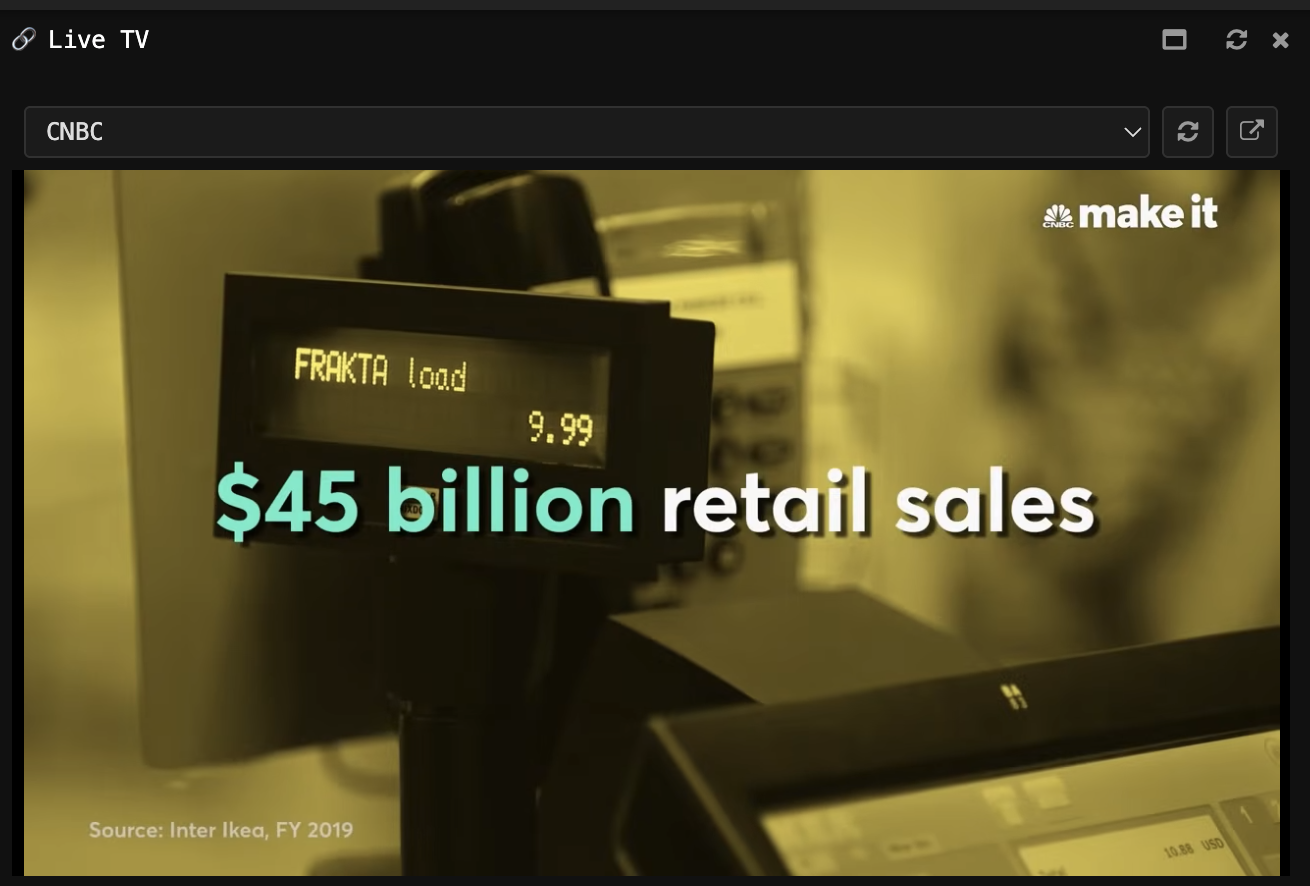
KlickAnalytics now brings live television from leading global broadcasters directly into your Terminal workspace, including Bloomberg Television.
Follow breaking news, market commentary, economic developments, and interviews while keeping your charts, portfolios, watchlists, and analytics in view.
With the Live TV widget, you can:
-
Select and switch between available global TV channels
-
Watch live broadcasts without leaving your Terminal
-
Monitor financial news alongside market data
-
Resize the widget to fit your workspace
-
Refresh a stream or open it externally
-
Combine live coverage with News Reader, calendars, research, and other widgets
From major policy announcements to market-moving developments, Live TV helps connect what you are hearing with what you are seeing in the markets.
Stream availability depends on each broadcaster’s schedule and streaming restrictions. Off-air channels may display a message instead of a live broadcast.
Watch the world. Monitor the markets. One connected Terminal.
Introducing KlickAnalytics for Slack
Market intelligence can now move directly into the conversations where your team already works.
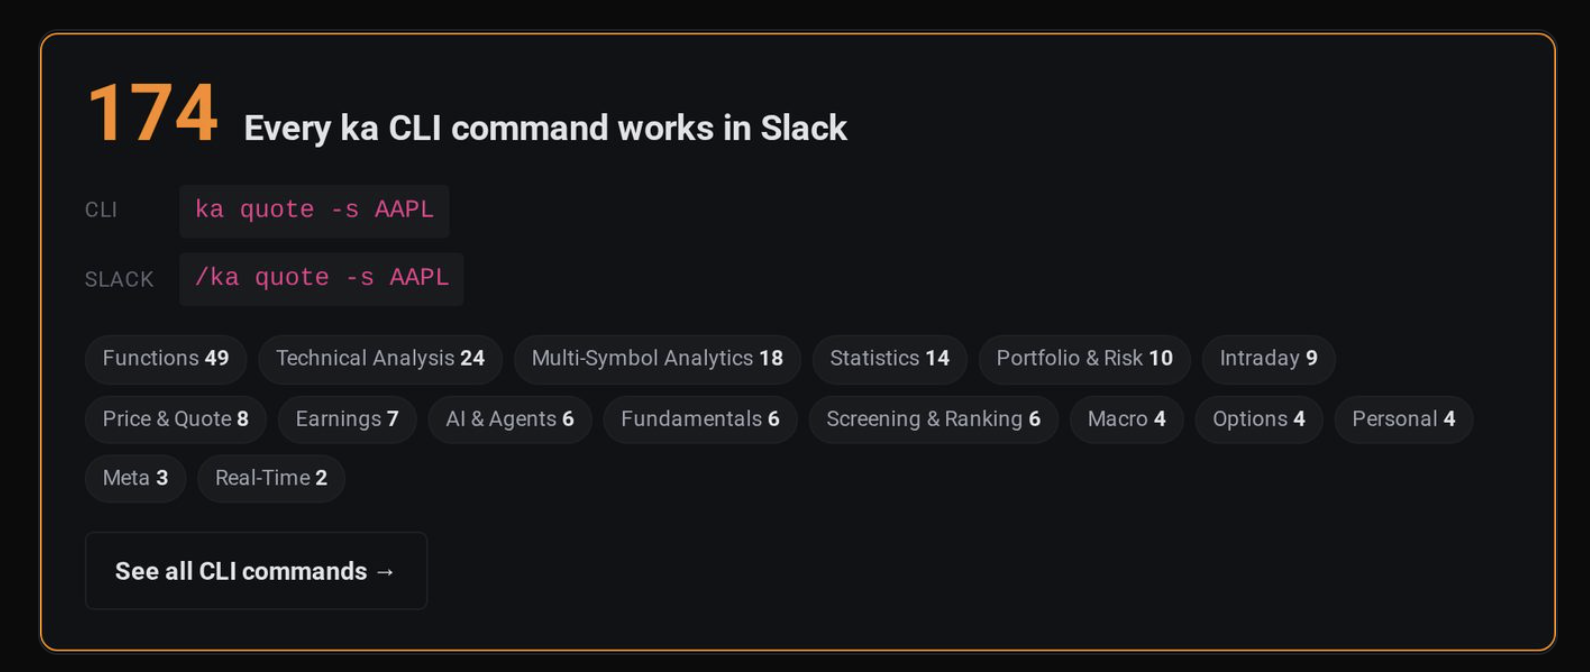
With the new KlickAnalytics Slack integration, users can run KA commands from Slack and receive structured market data and analytics without leaving the channel.
Use commands such as:
-
ka quote TSLAfor the latest quote and trading data -
ka ta MSFTfor technical indicators and market signals -
Additional KA commands for prices, fundamentals, analytics, and research workflows
KlickAnalytics first returns the result privately, allowing you to review it before deciding whether to share it with the channel. This keeps exploratory queries out of the wider conversation while making important findings easy to distribute when ready.
With KlickAnalytics for Slack, teams can:
-
Run KA commands from a Slack conversation
-
Retrieve quotes and market statistics
-
Review technical analysis and indicators
-
Receive structured, readable results
-
Keep initial results visible only to the requesting user
-
Share selected findings with the complete channel
-
Discuss market intelligen
The KlickAnalytics Blog
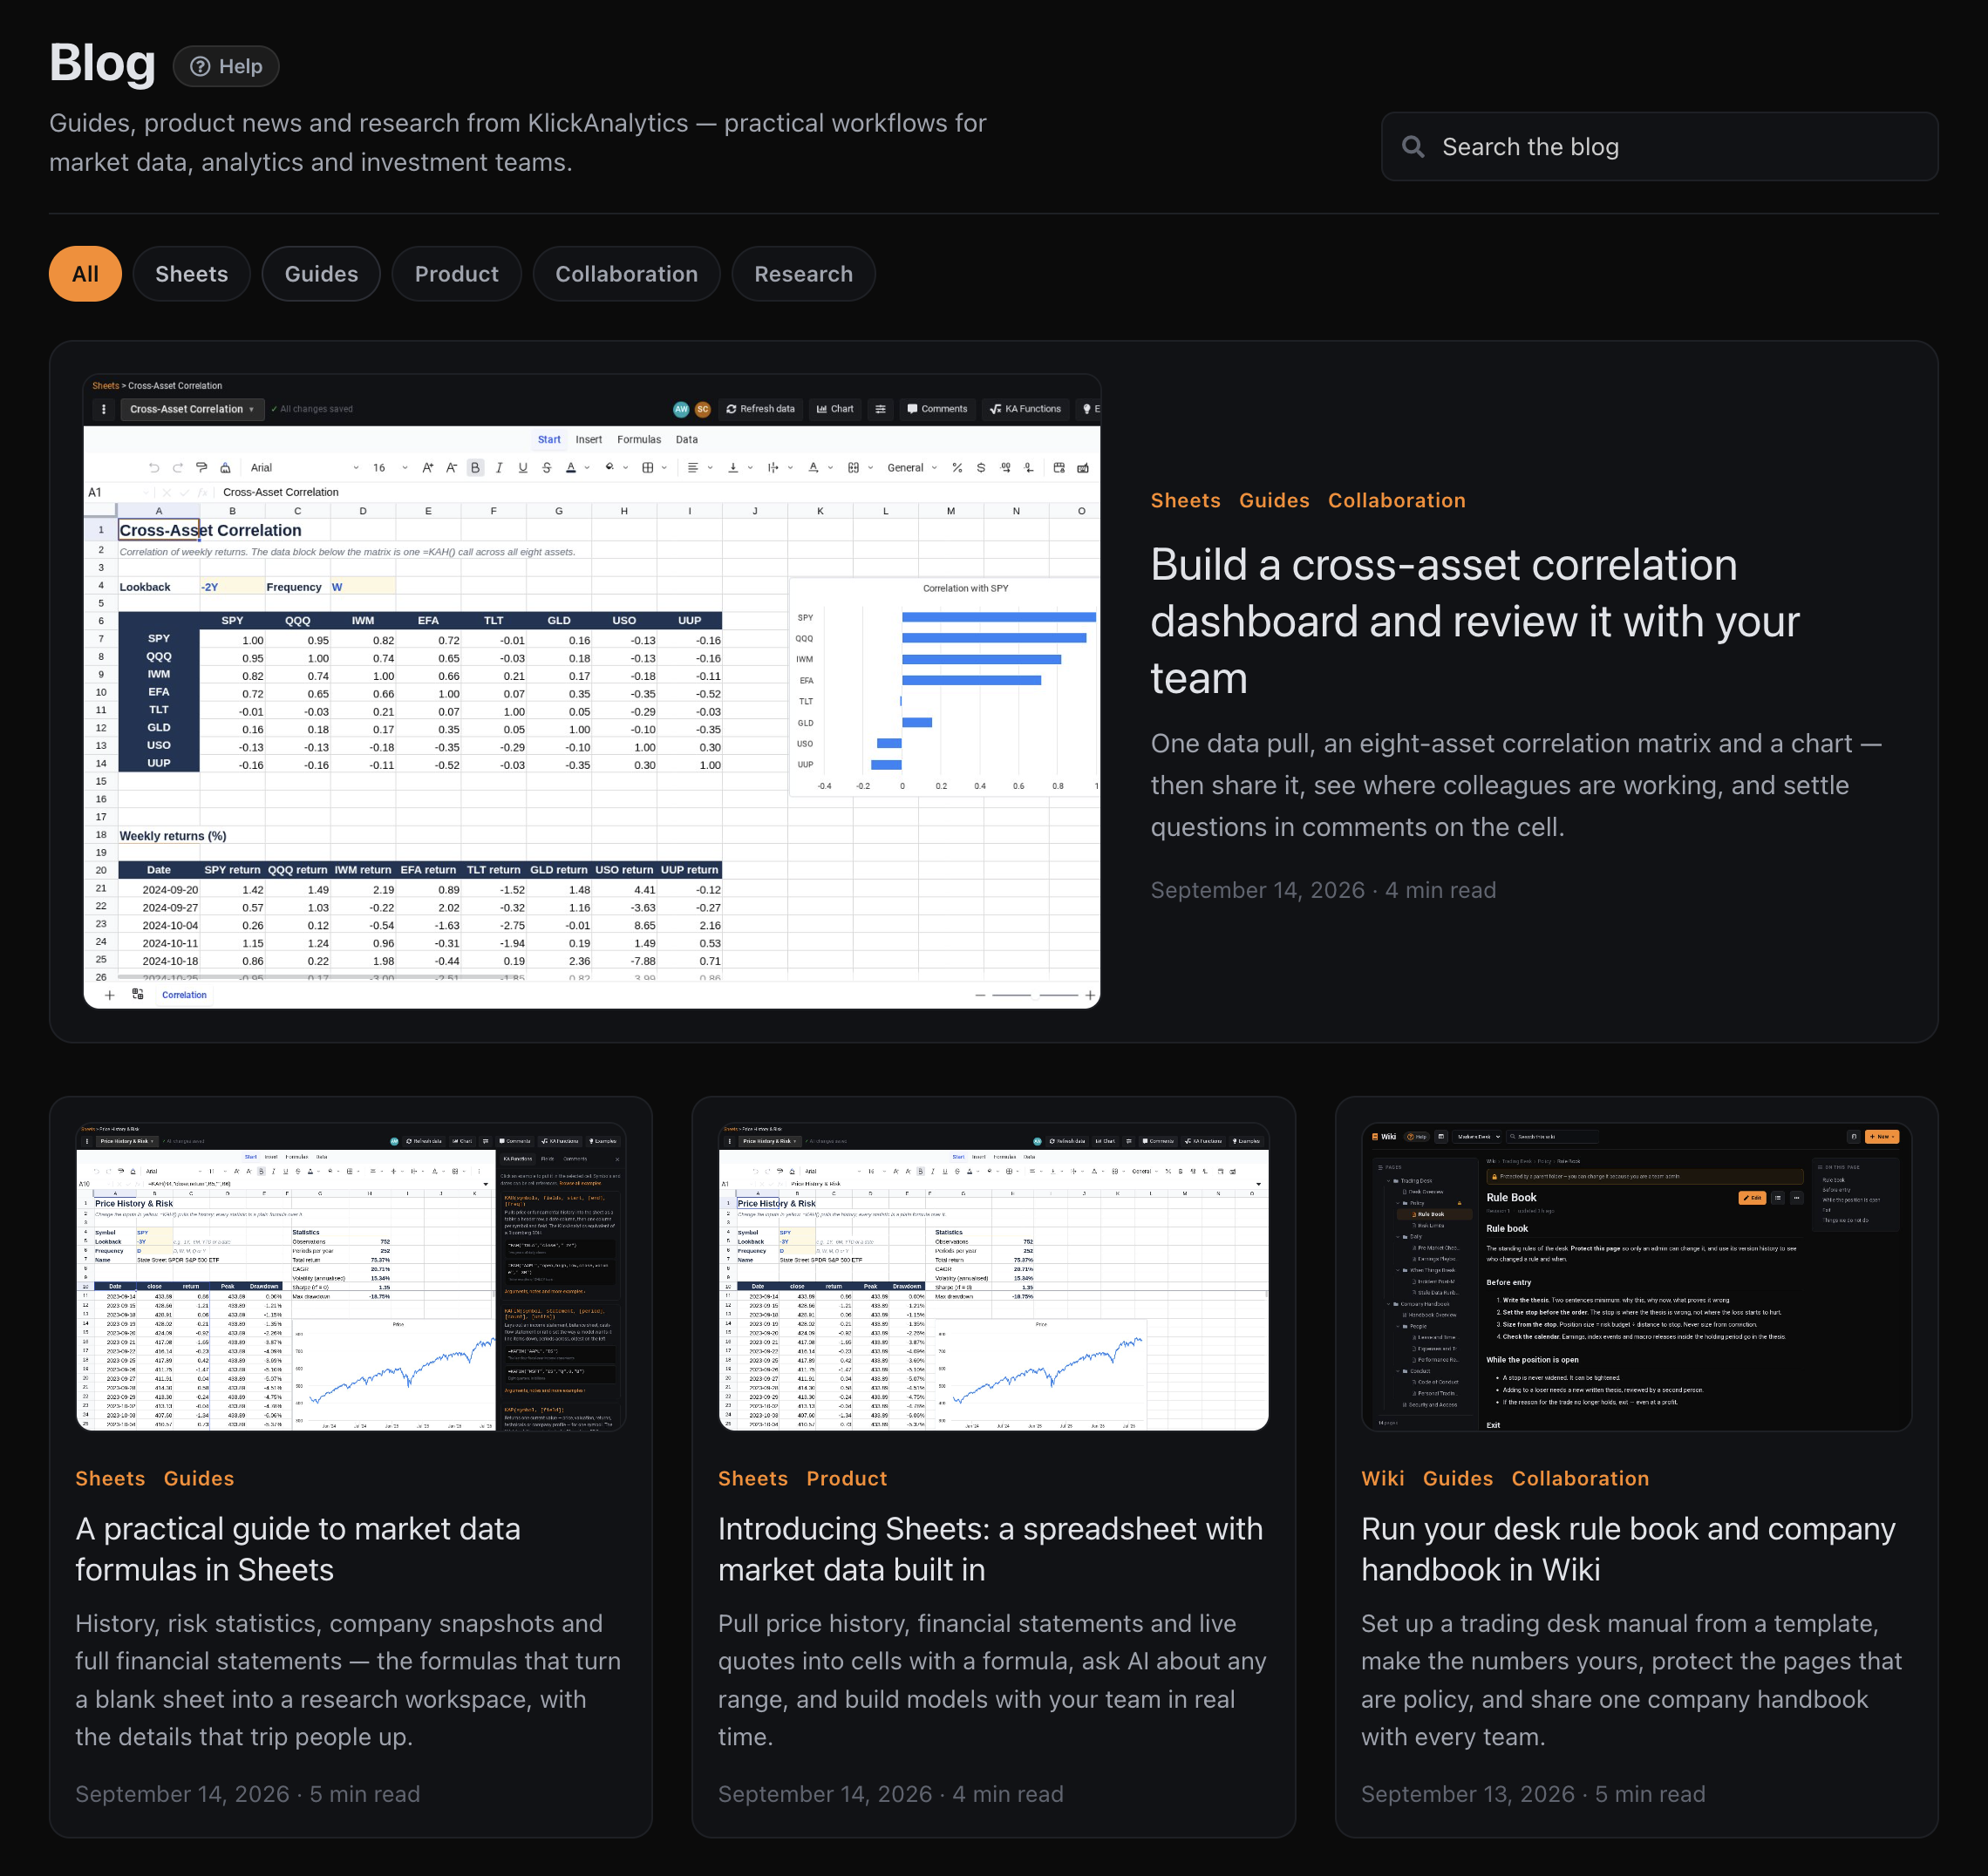
KlickAnalytics now has a dedicated Blog—bringing practical guides, product news, research ideas, and real-world financial workflows into one searchable destination.
The Blog is designed to help users understand what KlickAnalytics offers, and in addition to how to apply its tools to everyday market analysis and investment work.
Explore content across:
-
Sheets — Financial formulas, live market-data models, dashboards, and analytical templates
-
Guides — Step-by-step workflows for using KlickAnalytics effectively
-
Product — New feature announcements, capabilities, and platform improvements
-
Collaboration — Ways teams can work together using Sheets, Wiki, comments, calendars, and shared research
-
Research — Practical market analysis, investment methodologies, and data-driven insights
The Blog includes detailed examples such as:
-
Building cross-asset correlation dashboards
-
Pulling market data and financial statements into Sheets
-
Creating live portfolio and risk models
-
Using KA financial formulas
-
Building and testing investment strategies
-
Managing a trading-desk rule book in Wiki
-
Reviewing research and models with colleagues
Users can search the complete Blog, filter articles by category, discover featured content, and see the estimated reading time for every post.
This is more than a product-news page. It is a growing practical library for turning KlickAnalytics data, analytics, AI, and collaboration tools into repeatable financial workflows.
Learn the platform. Build the workflow. Apply it to the market.
To access: From the Menu > Resources > Blog
Build and Share Your Team’s Knowledge With Wiki
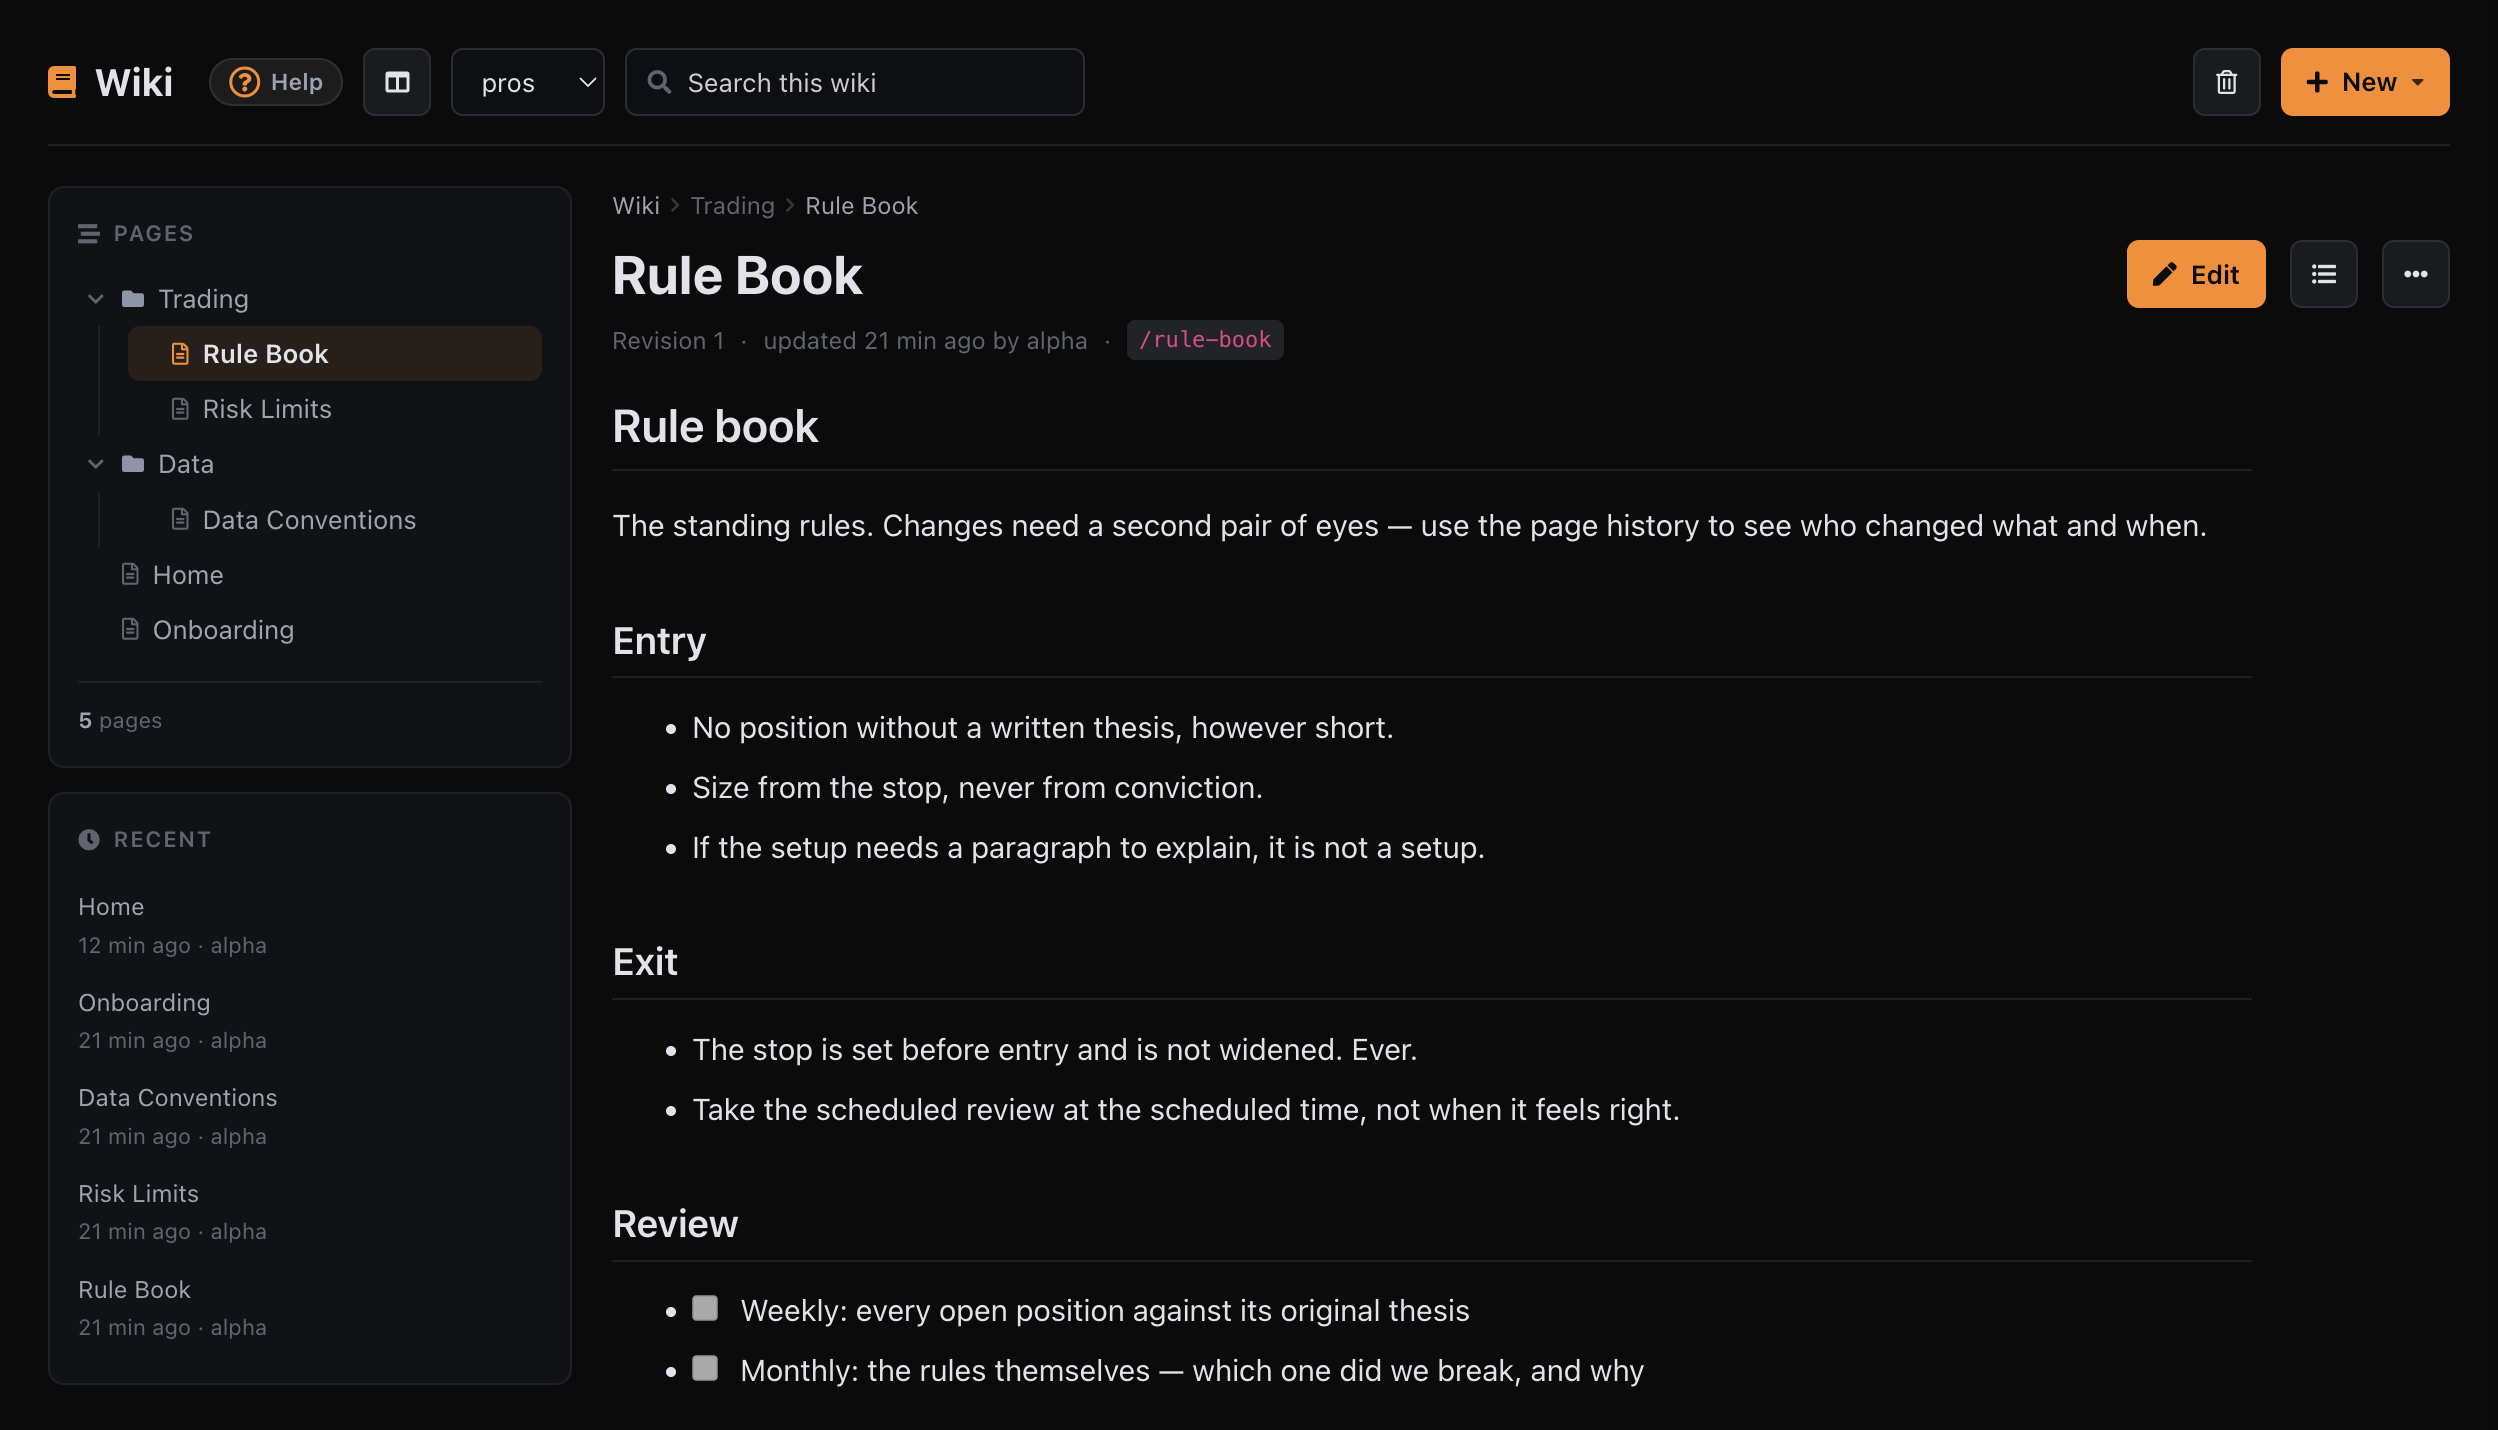
KlickAnalytics now includes a shared Team Wiki—a central place to create, organize, maintain, and share the knowledge that guides your team’s work.
Use Wiki to document:
-
Trading rules and investment processes
-
Portfolio and risk-management policies
-
Research standards and review procedures
-
Data definitions and analytical conventions
-
Operational workflows and checklists
-
Team onboarding and training material
-
Market playbooks and strategy documentation
-
Frequently used internal resources
With the KlickAnalytics Wiki, teams can:
-
Create pages and organize them into folders
-
Build a clear hierarchy for different desks, strategies, or functions
-
Search across the complete Wiki
-
Edit and update shared content
-
See when a page was updated and by whom
-
Track page revisions and review changes over time
-
Use permanent page addresses for quick access
-
View recently updated pages
-
Share institutional knowledge across the team
-
Keep important processes accessible inside the same platform used for market research
A portfolio manager can maintain an investment rule book. A risk team can publish exposure limits. A research desk can document its methodology. New team members can find onboarding material without searching through messages and disconnected files.
The Wiki turns knowledge that often lives in individuals, emails, and scattered documents into a structured resource for the entire organization.
Document the process. Share the knowledge. Build institutional memory.
To access: From the Meny > My > Wiki
Introducing KlickAnalytics Sheets — Financial Modeling With Market Data Built In
This is one of our most significant product updates yet.
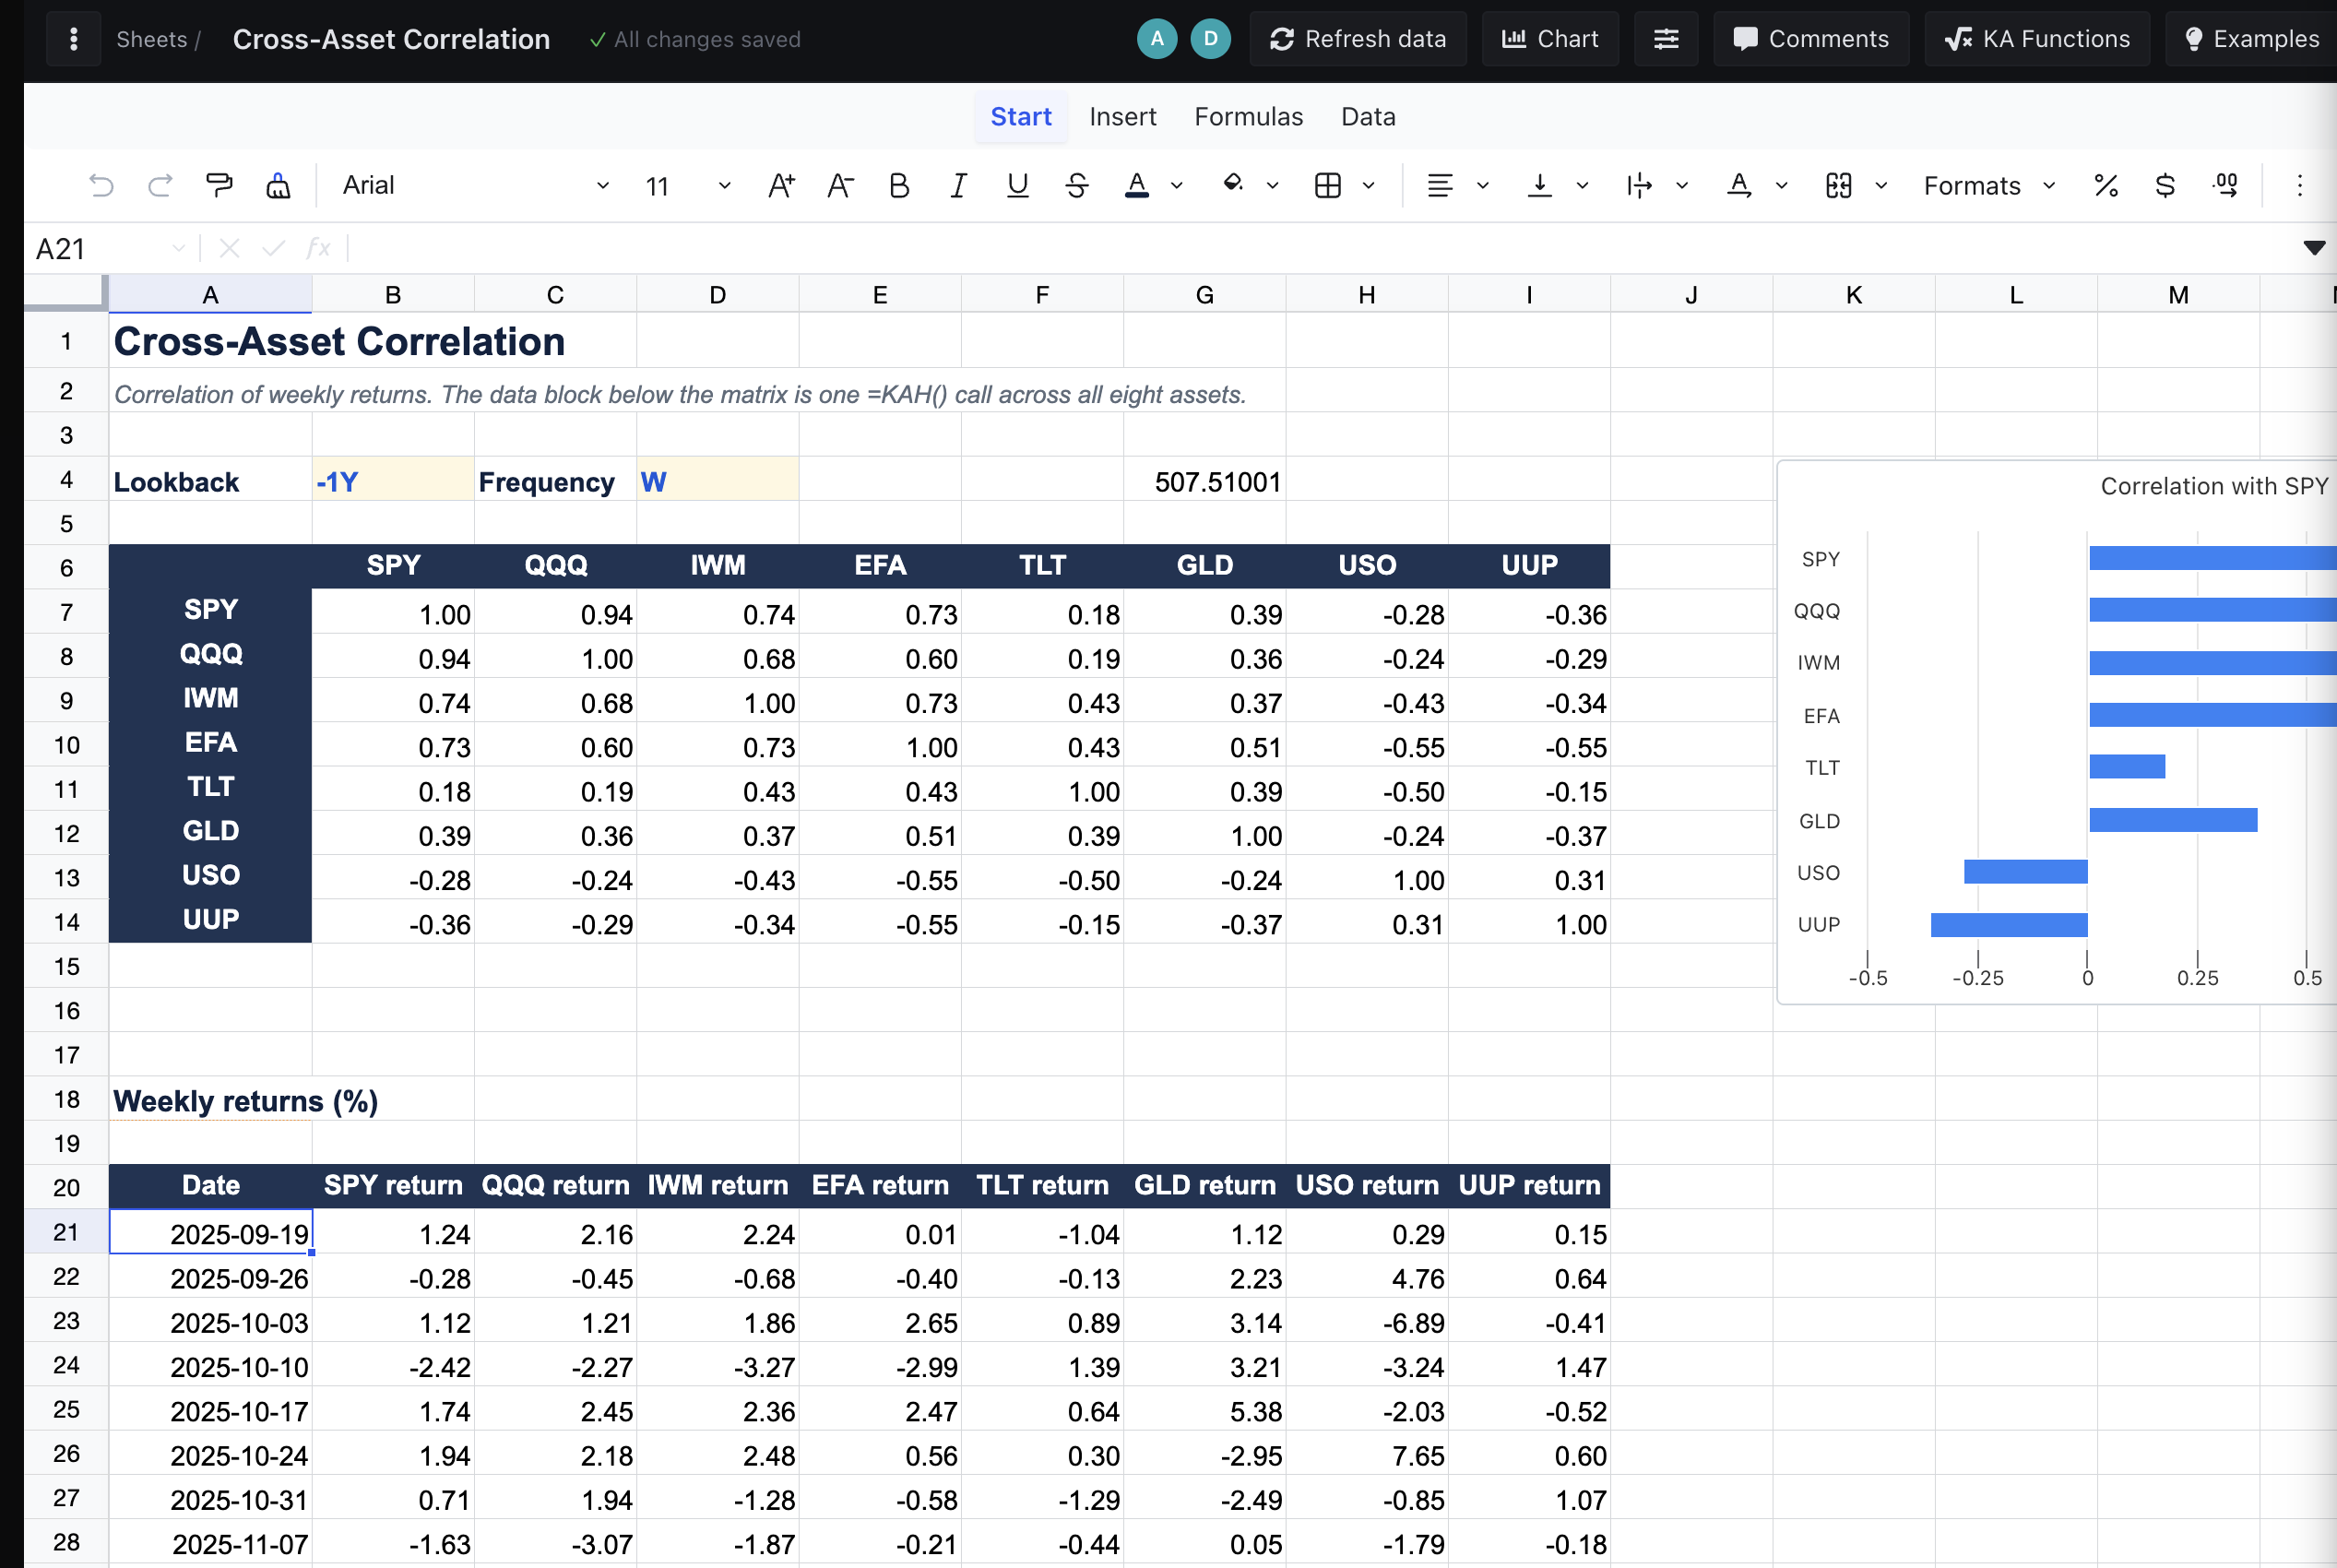
KlickAnalytics now includes a complete collaborative spreadsheet environment designed specifically for financial research, market analysis, portfolio modeling, and investment workflows.
Users can build familiar spreadsheet models while pulling KlickAnalytics price history, live quotes, company fundamentals, financial statements, returns, and analytical data directly into cells.
No downloads. No manual copying. No disconnected data files.
KlickAnalytics Functions
New native functions connect spreadsheet models to the KlickAnalytics data ecosystem:
-
KAH — Historical Data
Pull price history, OHLCV bars, returns, fundamentals, and multiple symbols across custom periods and frequencies. It provides functionality similar to Bloomberg BDH. -
KAFIN — Financial Statements
Retrieve income statements, balance sheets, cash-flow statements, and financial ratios across annual or quarterly periods. -
KAP — Current Data Points
Return a current price, valuation, performance, technical, fundamental, or company-profile field for a symbol. It provides functionality similar to Bloomberg BDP. -
KALIVE — Live Market Data
Stream the latest price or market field into a cell and automatically recalculate dependent formulas as new values arrive.
Symbols, fields, dates, and other arguments can also reference cells, making models flexible, reusable, and easy to update.
Build Complete Financial Models
Combine KlickAnalytics functions with familiar spreadsheet formulas to calculate:
-
Returns and growth rates
-
Volatility and Sharpe ratios
-
Maximum drawdowns
-
Correlations and covariance
-
Valuation multiples
-
Portfolio exposure and performance
-
Dividend income
-
Momentum and technical signals
-
Scenario and sensitivity analysis
-
Strategy and backtest results
Users can also turn results into charts, format complete financial models, add comments, and work together in real time.
Start With Ready-Made Models
A growing library of editable example sheets helps users begin immediately, including:
-
Price History and Risk
-
Live Watchlist Monitor
-
Sector Rotation Dashboard
-
Monthly Seasonality
-
Volatility Regime Monitor
-
Pair Spread and Z-Score
-
Momentum Ranking
-
Moving-Average Crossover Backtest
-
Bollinger Mean-Reversion Backtest
-
Portfolio Tracker
-
Dividend Income Planner
-
Cross-Asset Correlation
-
Fundamental and valuation models
-
AI-assisted analysis
Select a template and it opens as your own sheet. Change the symbols, assumptions, formulas, formatting, or analysis to fit your workflow.
Formula Discovery Made Simple
Users do not need to memorize every function.
The built-in formula library lets them:
-
Search by topic or analytical objective
-
Browse by function or use case
-
View working examples with explanations
-
Insert a formula directly into the selected cell
-
Copy formulas for reuse
-
Explore prices, risk, fundamentals, valuation, screening, live monitoring, and AI analysis
KlickAnalytics Sheets brings together the flexibility of a spreadsheet, the depth of a financial terminal, live collaborative work, and AI assistance in one connected environment.
Build the model. Connect the data. Watch it update. Collaborate in real time.
This is not just a spreadsheet with imported data. It is a financial analytical workspace powered by KlickAnalytics.
To access: From the Mneu > My > Sheet
A Shared Calendar for Your Entire Team
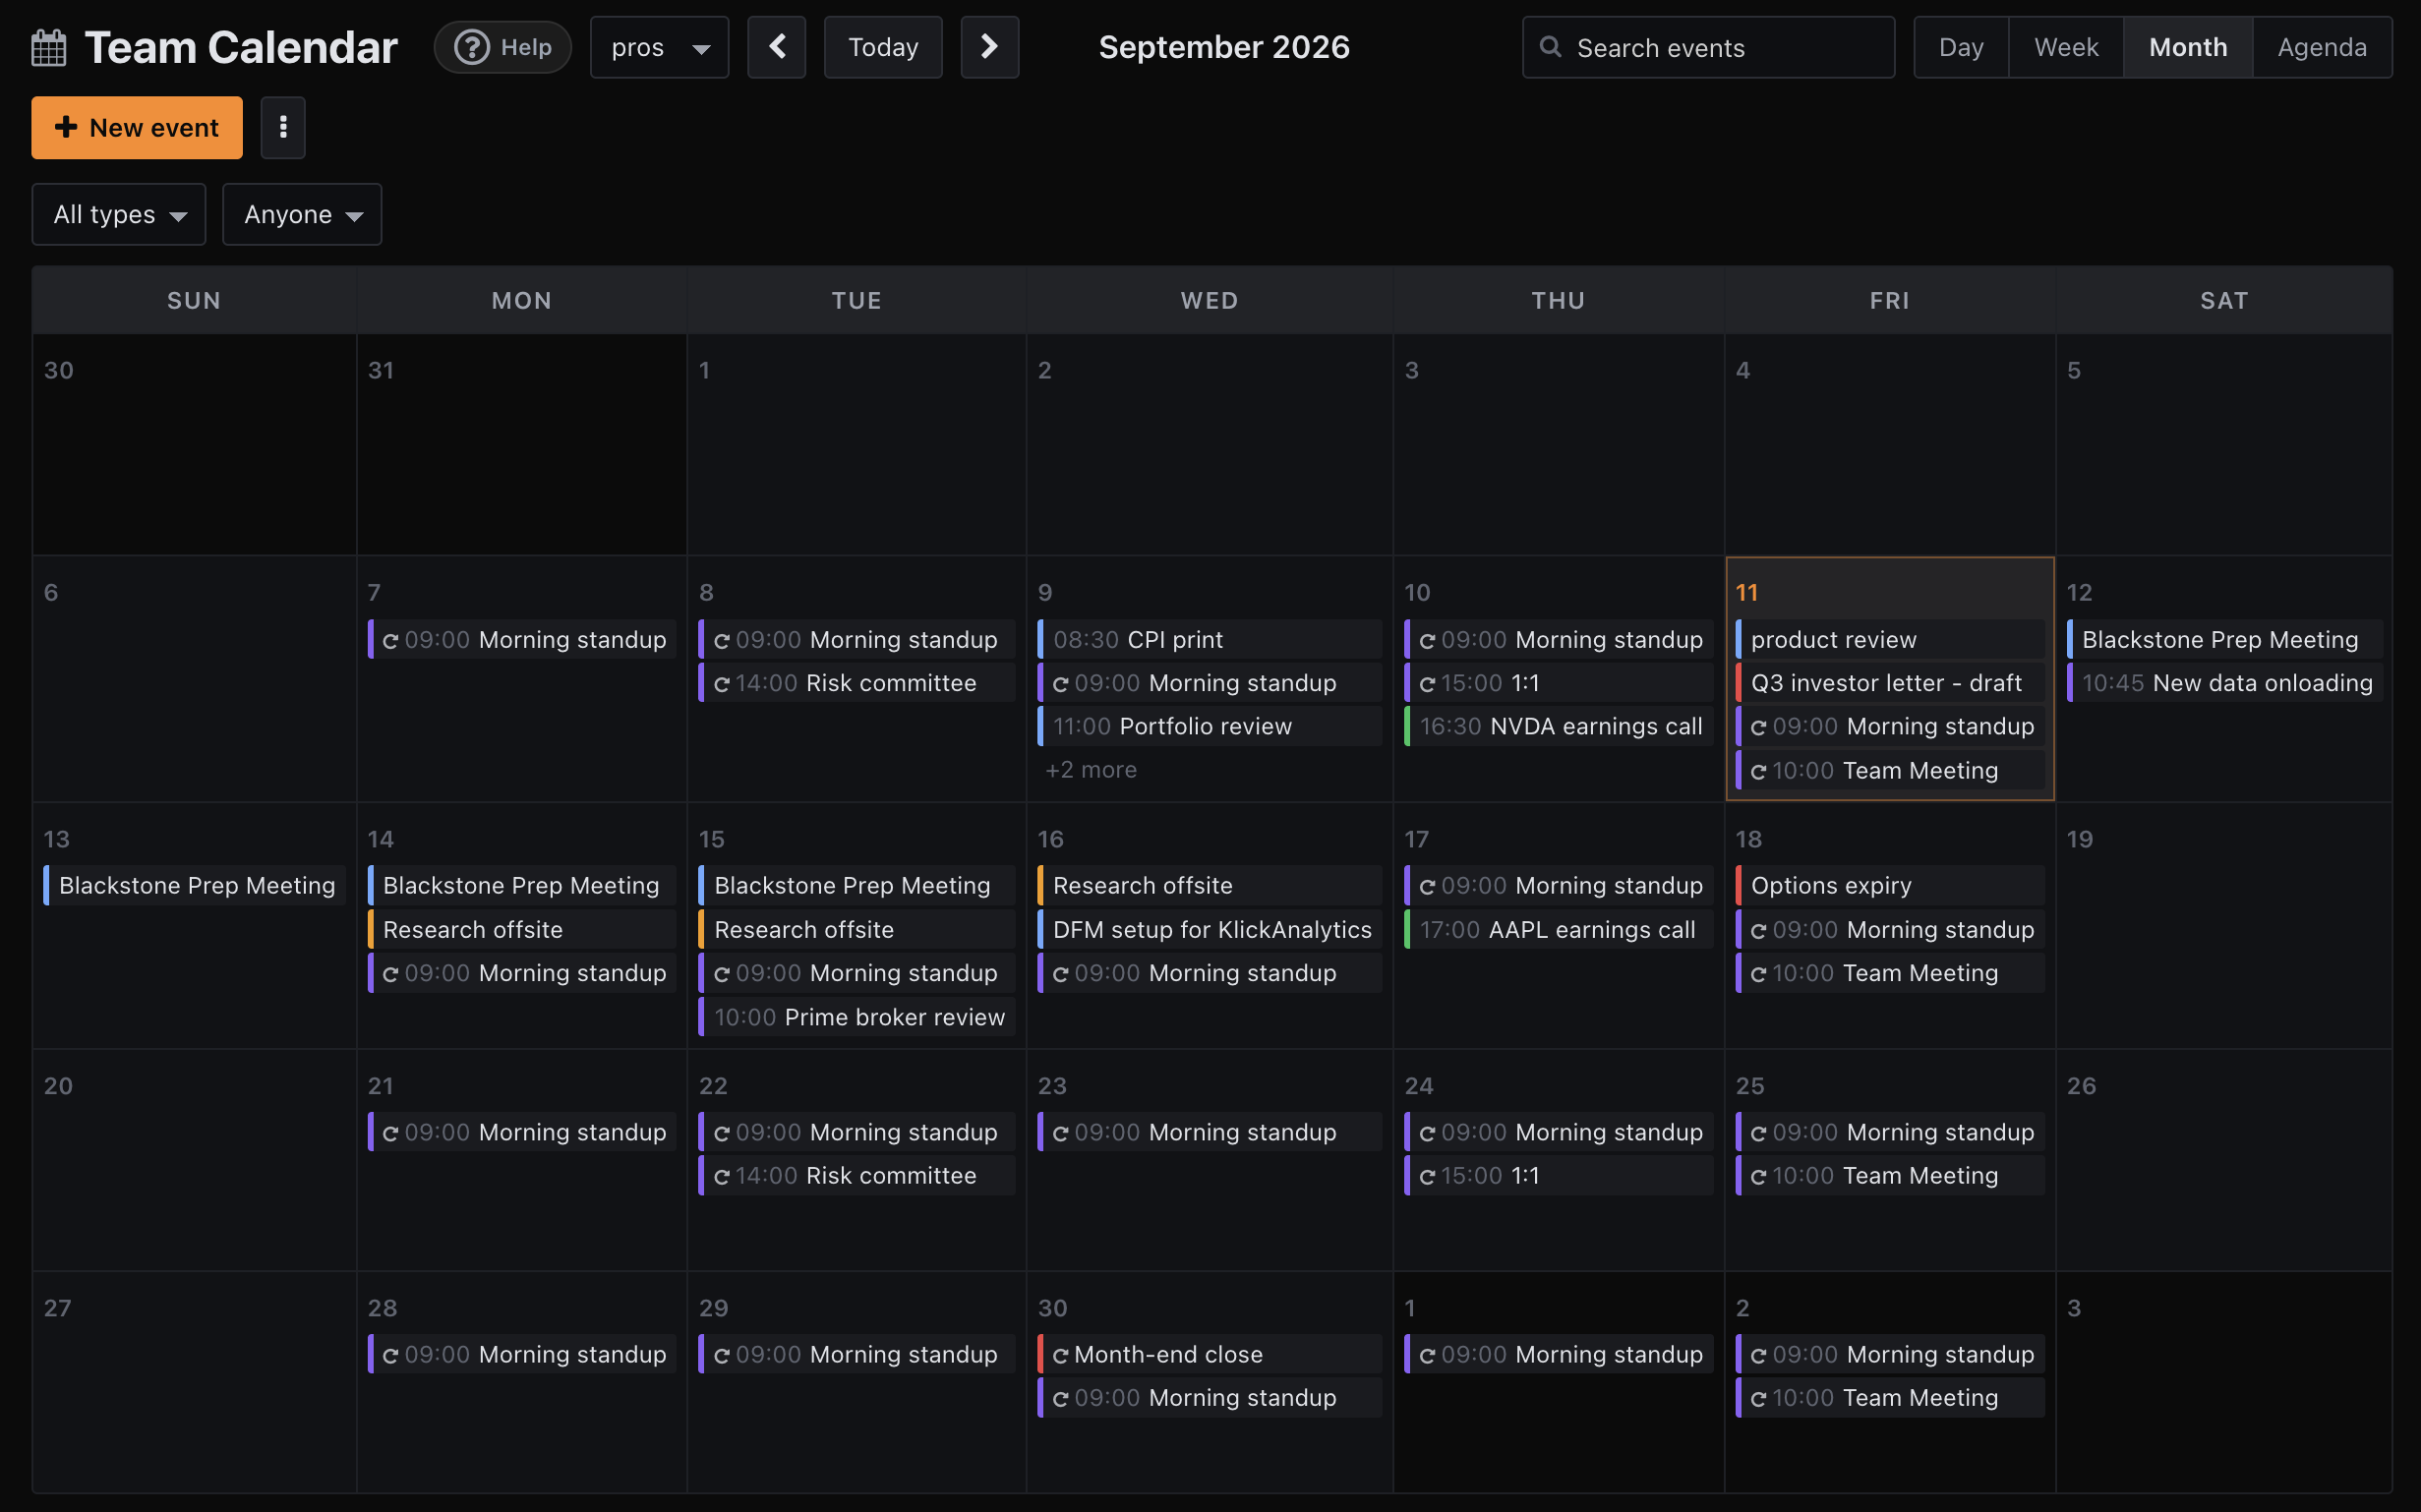
KlickAnalytics now includes a shared Team Calendar, giving everyone a central place to coordinate research, market events, meetings, deadlines, and recurring workflows.
With the Team Calendar, you can:
-
Create and share events with your team
-
Schedule recurring meetings and activities
-
Track earnings calls, economic releases, options expirations, and market deadlines
-
Plan portfolio reviews, risk committees, research sessions, and client preparation
-
Organize events by type using clear color coding
-
Search the calendar for a particular event
-
Filter events by category or team member
-
Switch between day, week, month, and agenda views
-
Navigate through past and upcoming schedules
-
Keep the entire team aligned around important dates
The Team Calendar brings market events and internal work into one coordinated schedule—helping teams see what is happening, who is involved, and what requires attention next.
Please note that this release focuses on shared scheduling and coordination. KlickAnalytics is not currently providing built-in video conferencing.
One team. One calendar. Every important event in view.
To access: From the Menu > My > Team Calendar
Data-Driven Market News Across U.S. and Gulf Markets
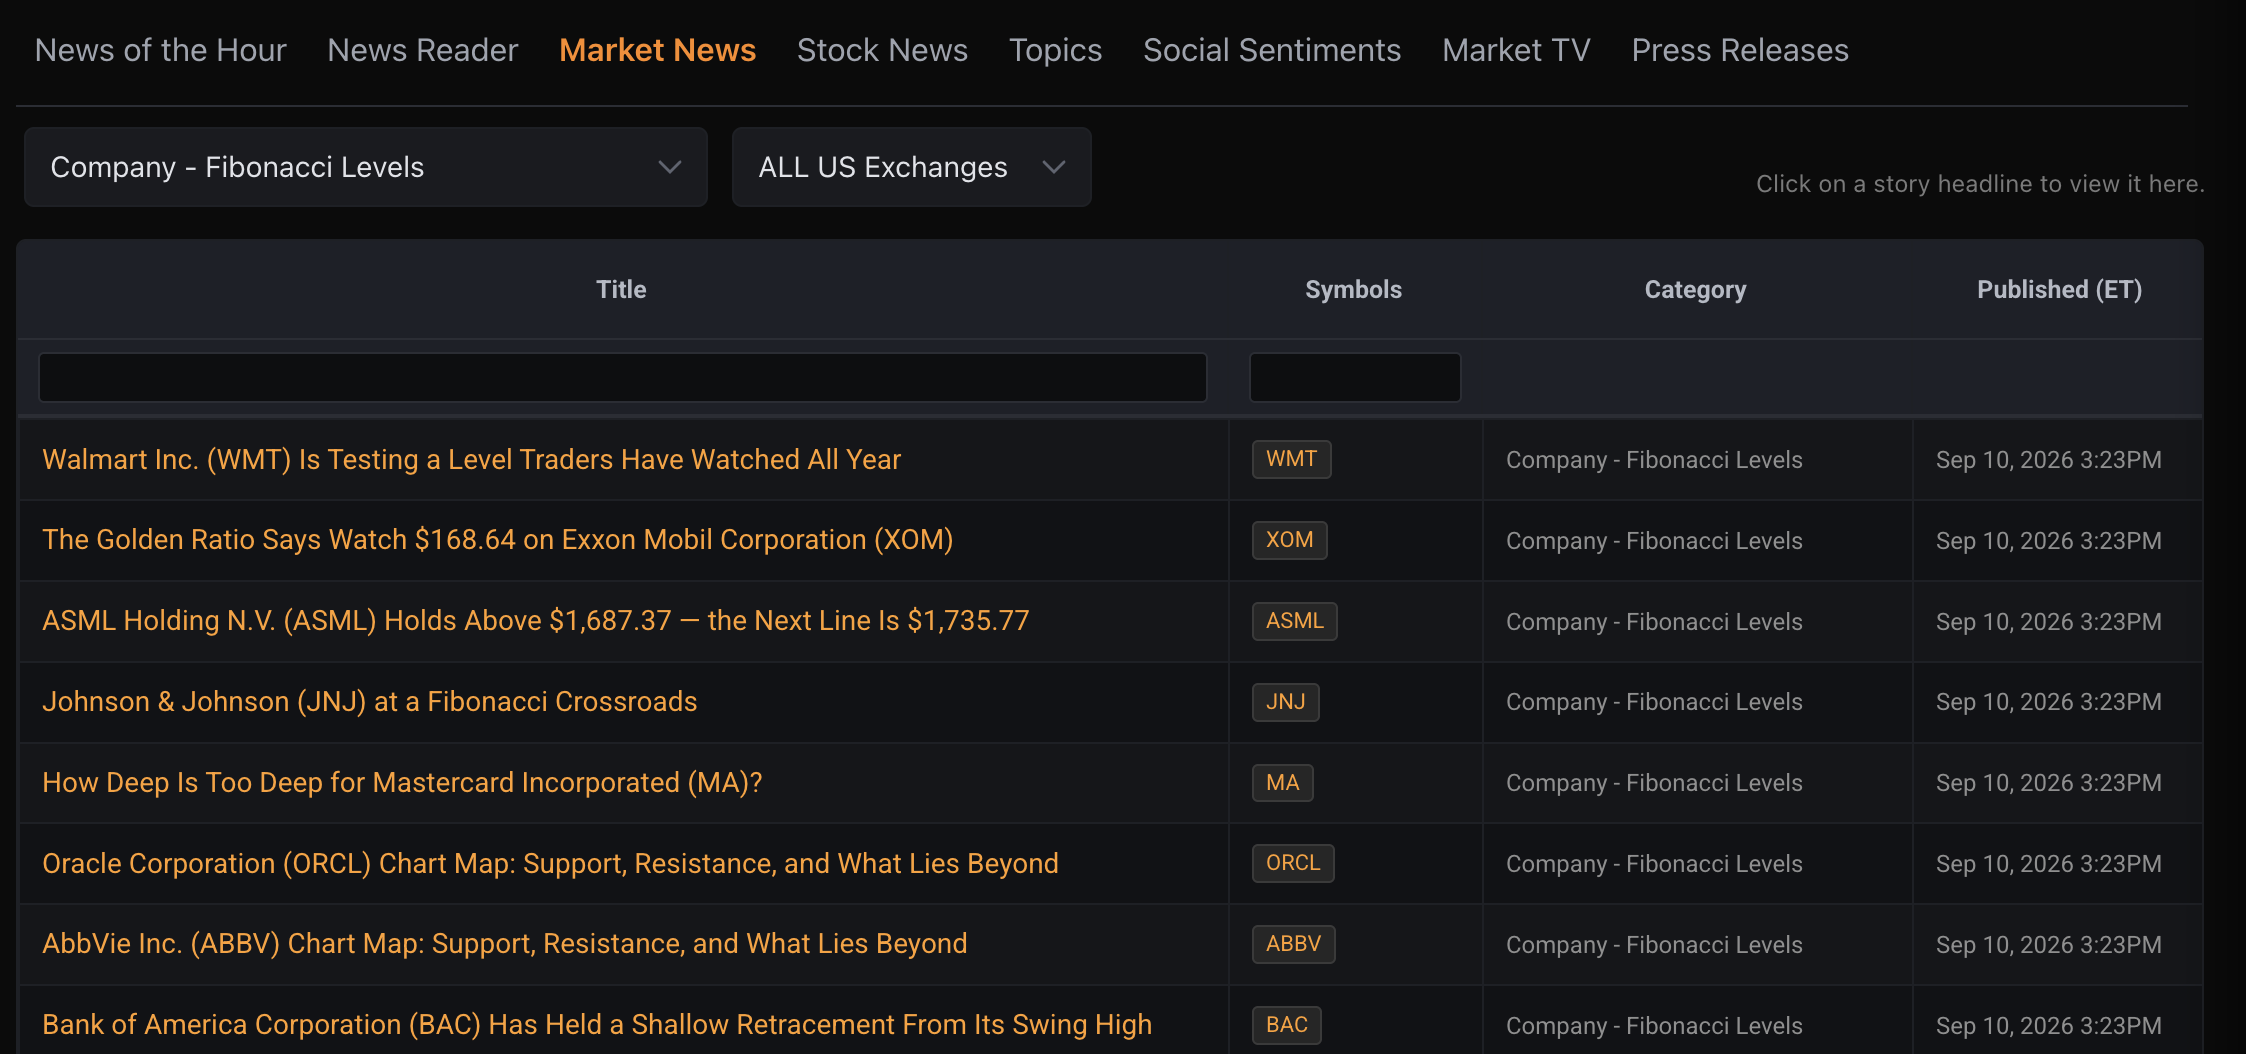
KlickAnalytics has expanded Market News with eight new systematic research categories—built directly from our KA analytics commands and published on recurring schedules.
The new coverage analyzes the top 500 U.S. companies alongside listed markets in Saudi Arabia, Dubai, and Qatar.
New categories include:
-
Market Regime — Weekly
Understand whether each market is trending, consolidating, strengthening, or weakening. -
Candlestick Patterns — Weekly
Discover important bullish and bearish patterns forming across covered securities. -
Liquidity Profile — Weekly
Identify changes in liquidity, trading depth, and market participation. -
Fibonacci Levels — Weekly
Find instruments approaching important Fibonacci retracement and extension levels. -
Gap Statistics — Fortnightly
Analyze gap behavior, continuation, reversals, and historical gap tendencies. -
Price Action Setups — Fortnightly
Surface noteworthy breakouts, pullbacks, consolidations, and other technical setups. -
Technical Signal Pack — Fortnightly
Review combined technical signals across trend, momentum, volatility, and price indicators. -
Volume Profile — Fortnightly
Identify key price zones, high-volume areas, and potential support or resistance.
These updates are produced from structured KlickAnalytics calculations rather than headlines alone. The underlying KA CLI commands analyze the market systematically, while each published story transforms those results into clear, readable market intelligence.
This gives users recurring coverage of signals and conditions that traditional news feeds often overlook—across both developed and fast-growing Gulf markets.
From market data to market intelligence—systematically, consistently, and across regions.
To access: From the Menu > NewsRoom > Market News
Ask the market a question. Get a calculated answer.
The AI is not a chatbot bolted onto a document store. It calls the same analytics engine that powers every screen on this platform — so what comes back is a number it computed from raw history, with the command that produced it.
86,000+ instruments
Global equities, ETFs, funds, options, FX, commodities, crypto, economics, filings, transcripts and news — one normalised symbol universe with adjusted history.
A real analytics engine
Screening, backtesting, technicals, options analytics, correlations, seasonality and factor models — computed on demand from raw prices, never a stale cache.
It shows its working
Answers arrive with the charts, tables and tool calls behind them, so you can check the number instead of trusting a paraphrase.
Your own documents
Upload filings, decks and research. Ask across them and the answer cites the page it came from.
Agents and workflows
Multi-step research that runs the platform's tools for you — screen, pull the history, compute, compare, then write it up.
MCP, CLI and API
The same command catalogue from Claude, your own agent, a shell or your pipeline. The answer on screen is the answer your job gets at 4am.
You ask
“How does NVDA usually trade through earnings?”
It calls
→ ka.options_expected_move(NVDA)
It answers
NVDA has averaged a 9.2% absolute move on the day after earnings and closed higher 67% of the time. Two in three reactions land between −4.2% and +16.3% — the distribution is skewed right, not symmetric.
Every figure computed live from our own history — not scraped, not summarised.
Or start with