Valuation models on any ticker.
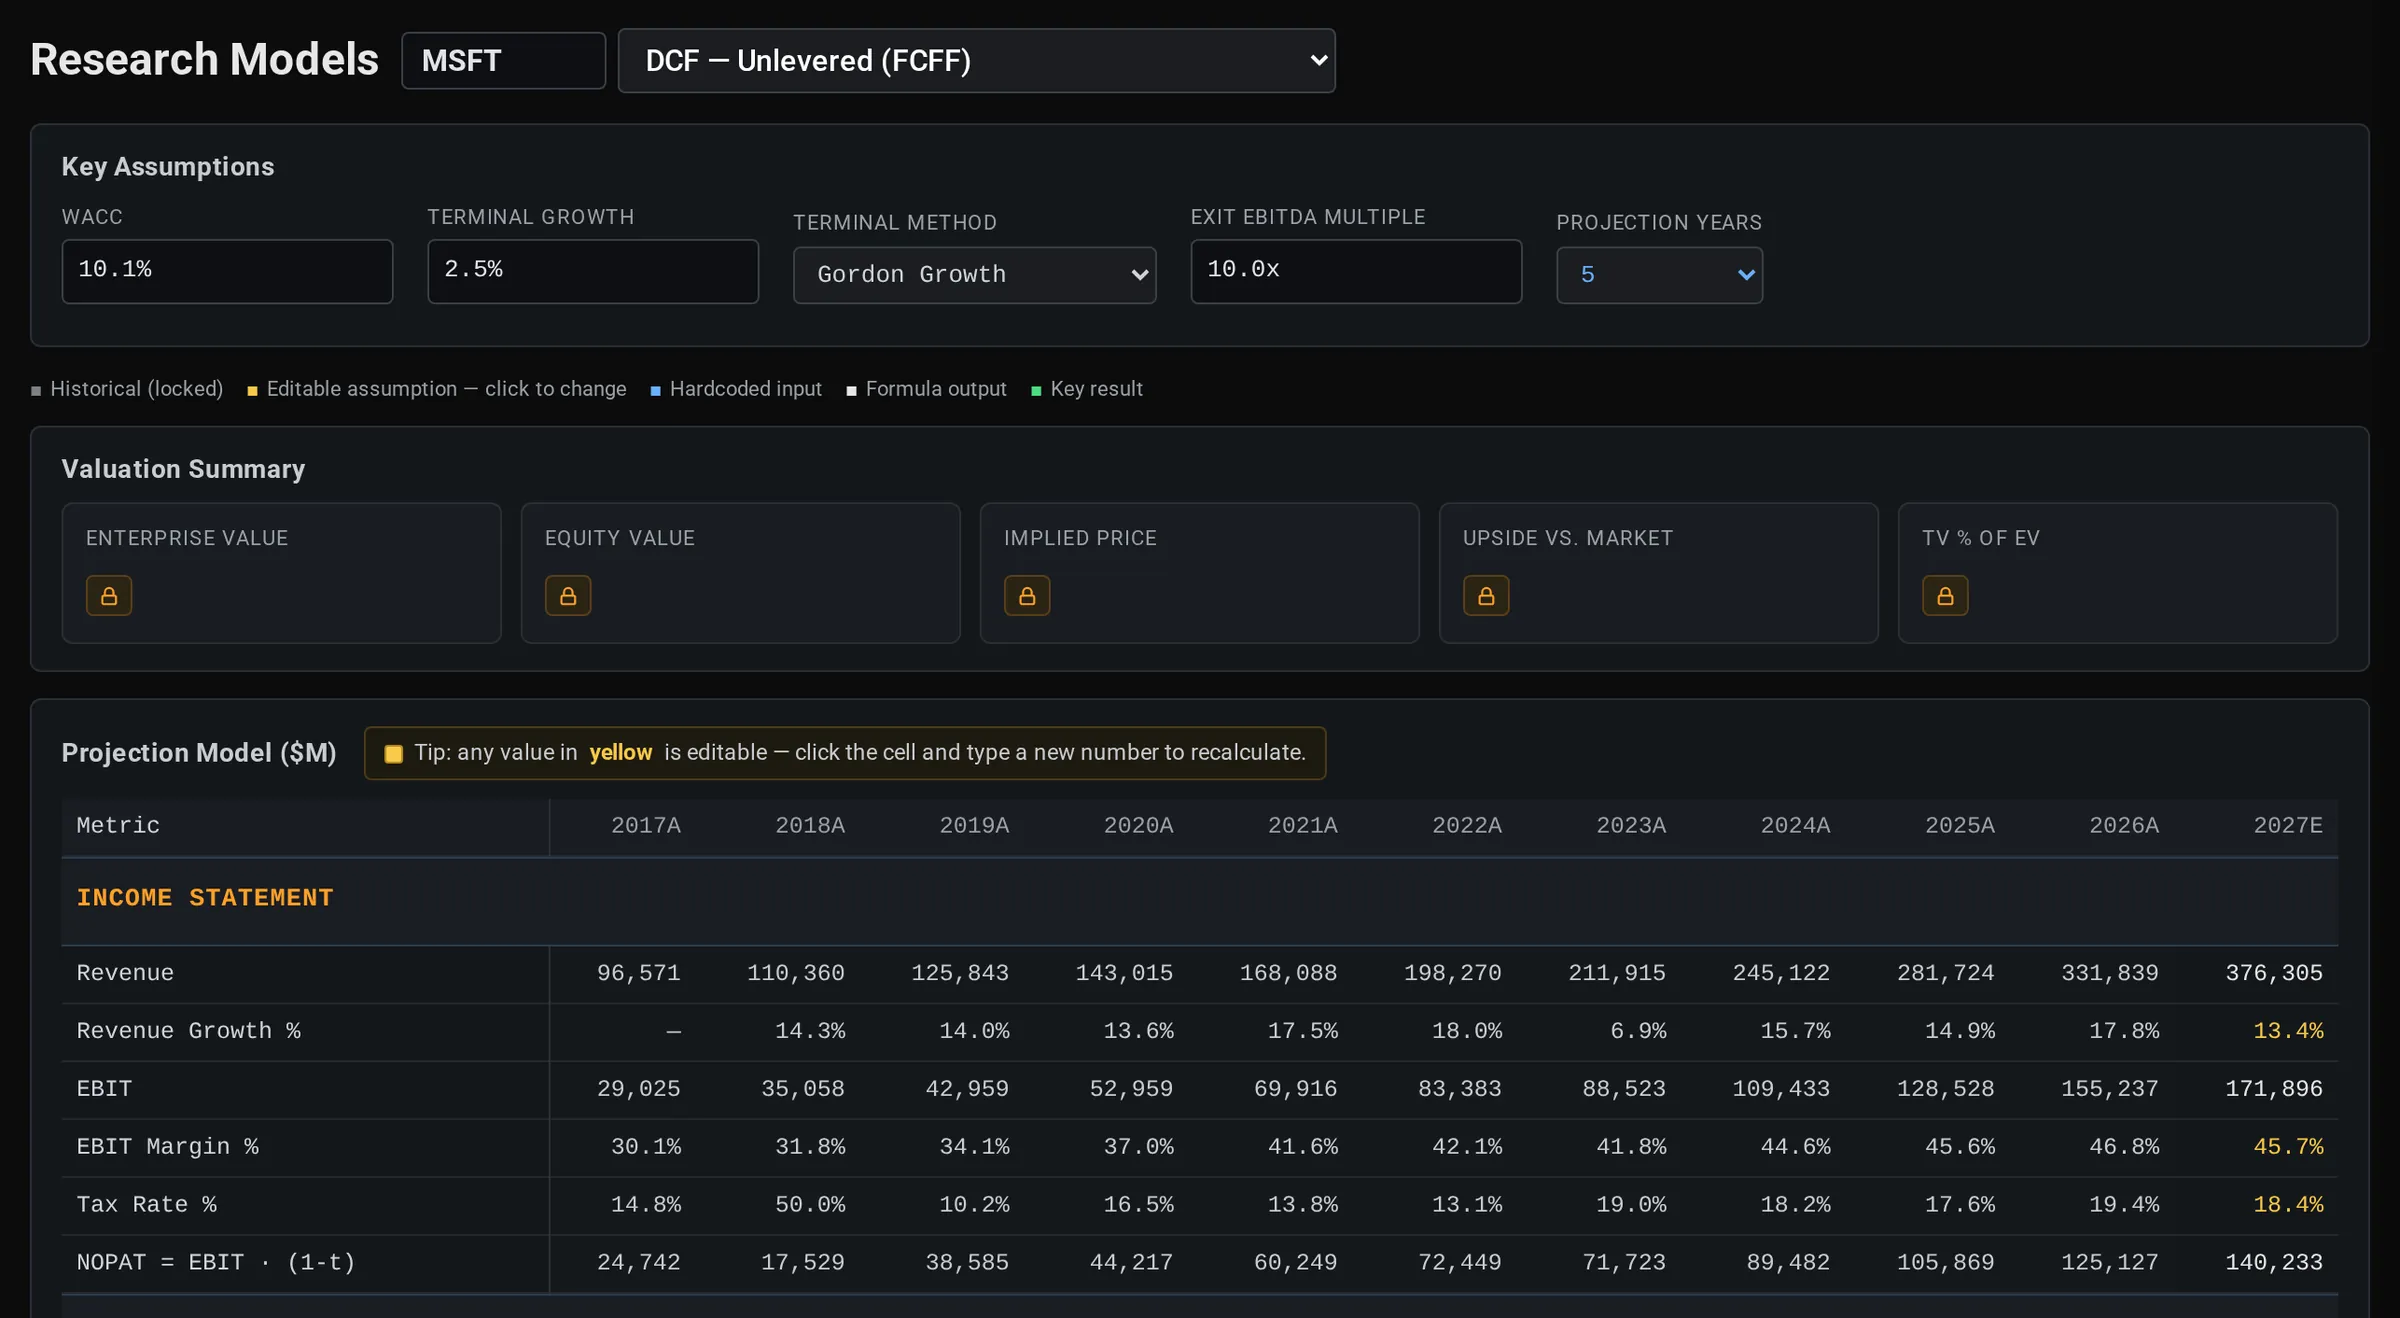
Run a DCF, an LBO or 70+ other models on real company financials, change the assumptions and watch the valuation move.
Full models are included in paid plans.
-
70+ models
DCF, LBO, three-statement, WACC, dividend discount, M&A, REIT, SaaS, Monte Carlo, Piotroski and Altman Z.
-
Real financials, filled in
Pick a ticker and the historical years and starting assumptions load for you.
-
Change any assumption
Edit a highlighted cell and every figure recalculates on the spot.
-
Sensitivity, bridge and peers
See the implied value across a range of assumptions, next to charts and a peer table.
-
Saves as you work
Your assumptions are kept for each ticker and model, so you pick up where you left off.
-
Ask AI about the numbers
An AI explainer answers questions using the model's current figures.
Value your first company.
Ask the market a question. Get a calculated answer.
The AI is not a chatbot bolted onto a document store. It calls the same analytics engine that powers every screen on this platform — so what comes back is a number it computed from raw history, with the command that produced it.
86,000+ instruments
Global equities, ETFs, funds, options, FX, commodities, crypto, economics, filings, transcripts and news — one normalised symbol universe with adjusted history.
A real analytics engine
Screening, backtesting, technicals, options analytics, correlations, seasonality and factor models — computed on demand from raw prices, never a stale cache.
It shows its working
Answers arrive with the charts, tables and tool calls behind them, so you can check the number instead of trusting a paraphrase.
Your own documents
Upload filings, decks and research. Ask across them and the answer cites the page it came from.
Agents and workflows
Multi-step research that runs the platform's tools for you — screen, pull the history, compute, compare, then write it up.
MCP, CLI and API
The same command catalogue from Claude, your own agent, a shell or your pipeline. The answer on screen is the answer your job gets at 4am.
You ask
“How does NVDA usually trade through earnings?”
It calls
→ ka.options_expected_move(NVDA)
It answers
NVDA has averaged a 9.2% absolute move on the day after earnings and closed higher 67% of the time. Two in three reactions land between −4.2% and +16.3% — the distribution is skewed right, not symmetric.
Every figure computed live from our own history — not scraped, not summarised.
Or start with