What's New
Product updates, improvements and fixes across the KlickAnalytics platform.
142 updates · clear
Welcome to KlickAnalytics Blog!
We have created a new blog. This blog will help our customer by keeping them
- Updated on all the latest updates
- How To's on using various apps on our platform
- Market Commentaries and much more.
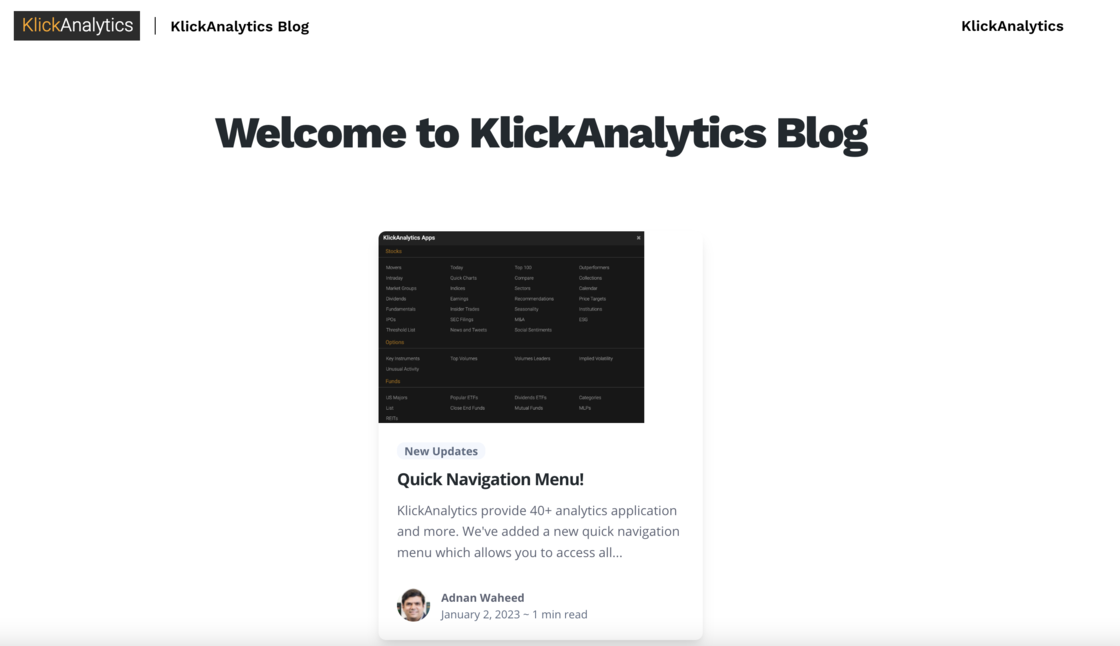
Our goal is to keep our custom informed with all the platform and market updates.
Quick access to platform 'documentation'
We've added a quick link to access the documentation of our platform on the top navigation bar. This will allow our users to quickly look at the various documentations of the KlickAnalytics platform.

To access: From the top navigation bar, click on help icon.
View all major US Funds performances!
We've added a new app called 'US Majors' under our Funds offerings.
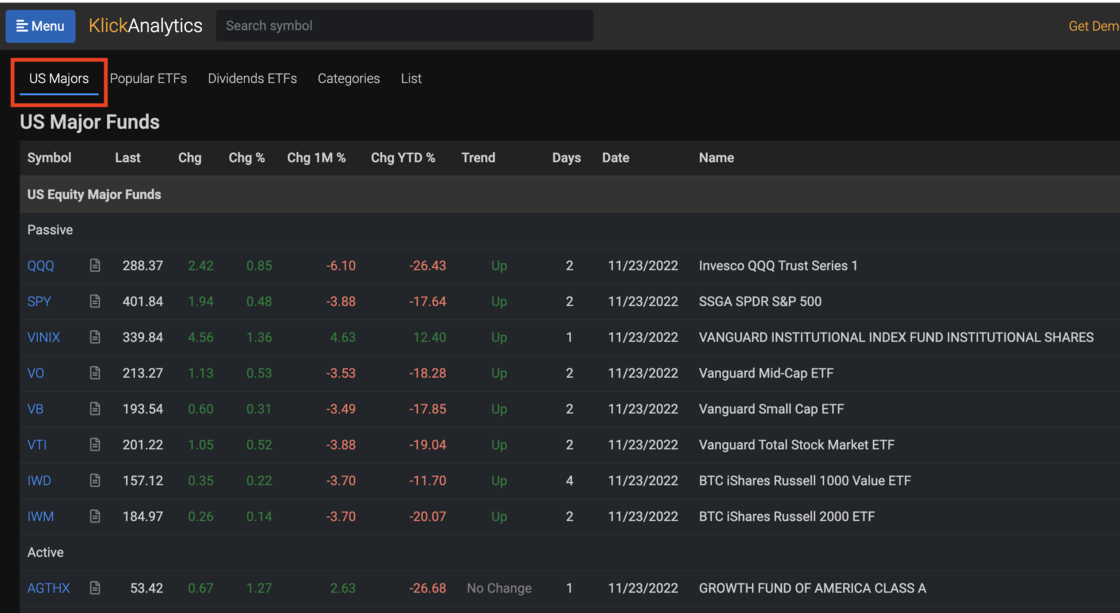
The above will allow our users to quickly view a snapshot performance view of all major funds traded in US markets and much more.
To access: Click Menu > Funds > ETFs
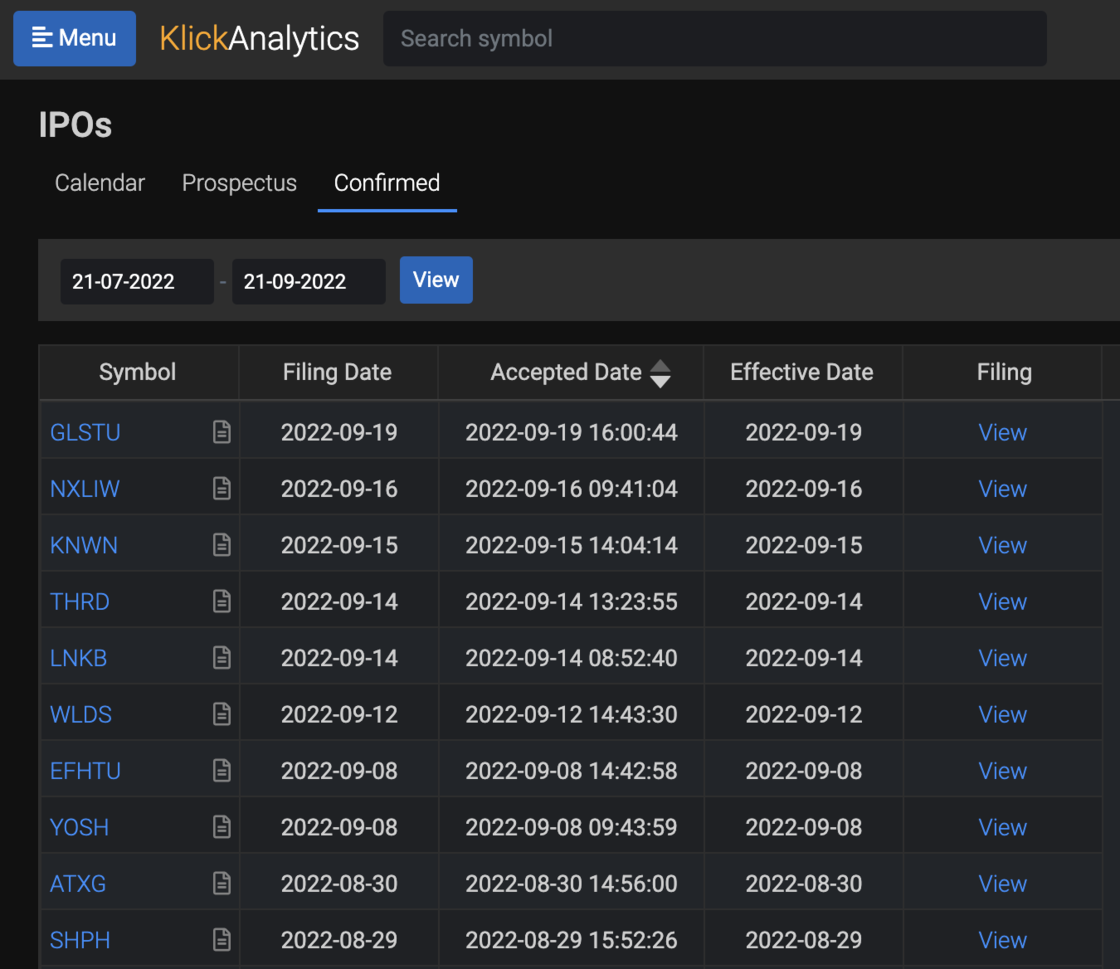
View company price target, summary and more..
View any global company price target with price consensus, historical average price targets and detail with analyst name, company, price target and more…
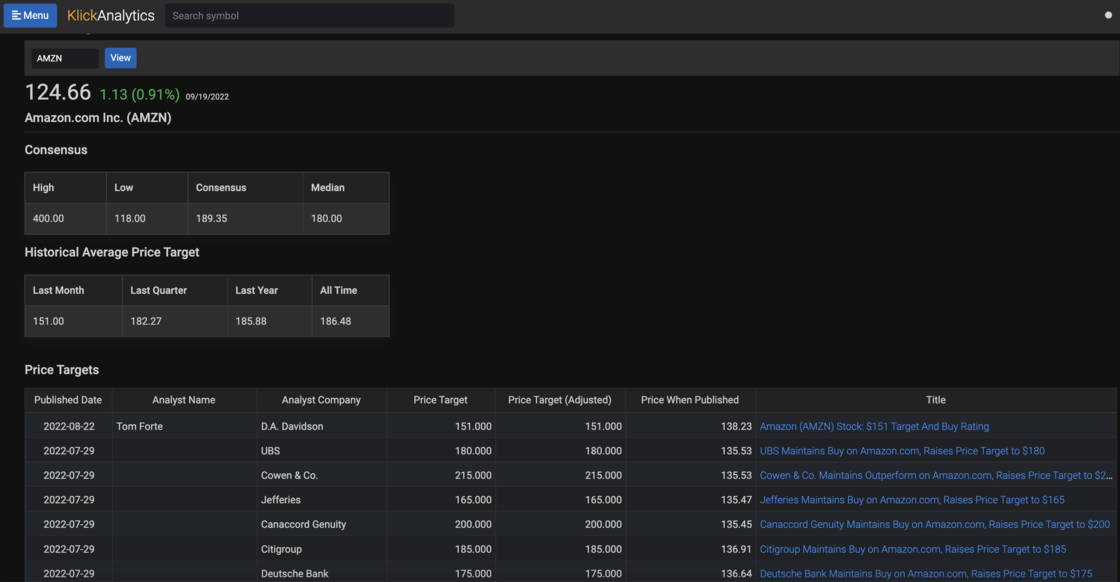
To access: Search for a symbol say TSLA, Click Company > Price Target
Access latest SEC Filings
Access latest SEC filings by companies with links to SEC filing website and more.
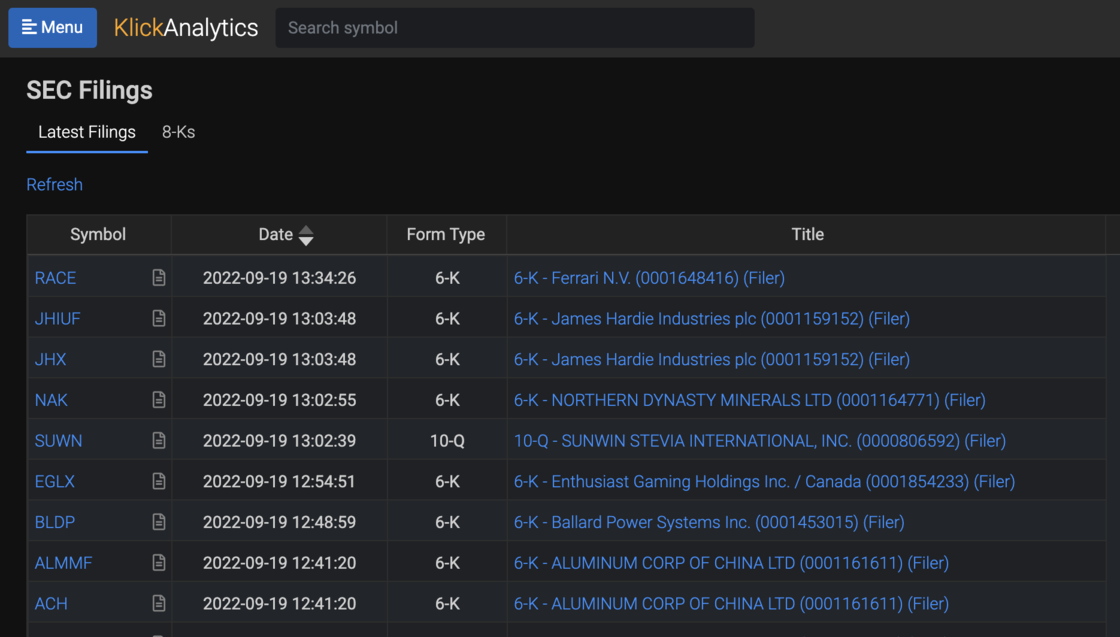
In addition, access all important event (8-K) filings along with company financials
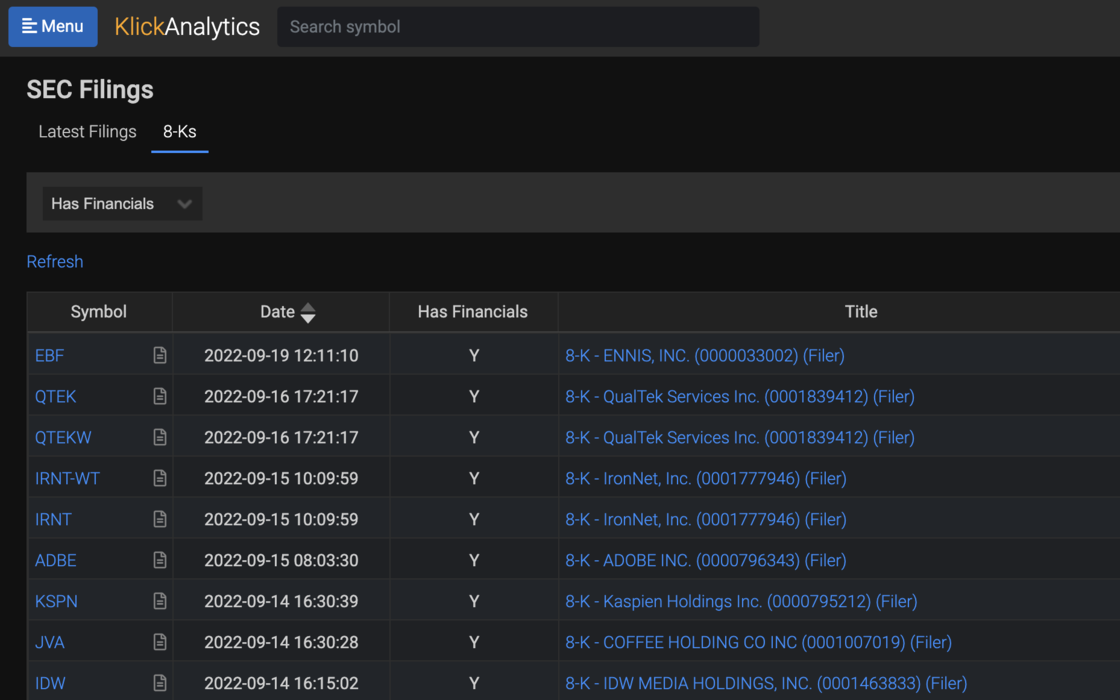
To access: Click on Menu > Stocks > SEC Filings
Access company ESG score and Risk Ratings
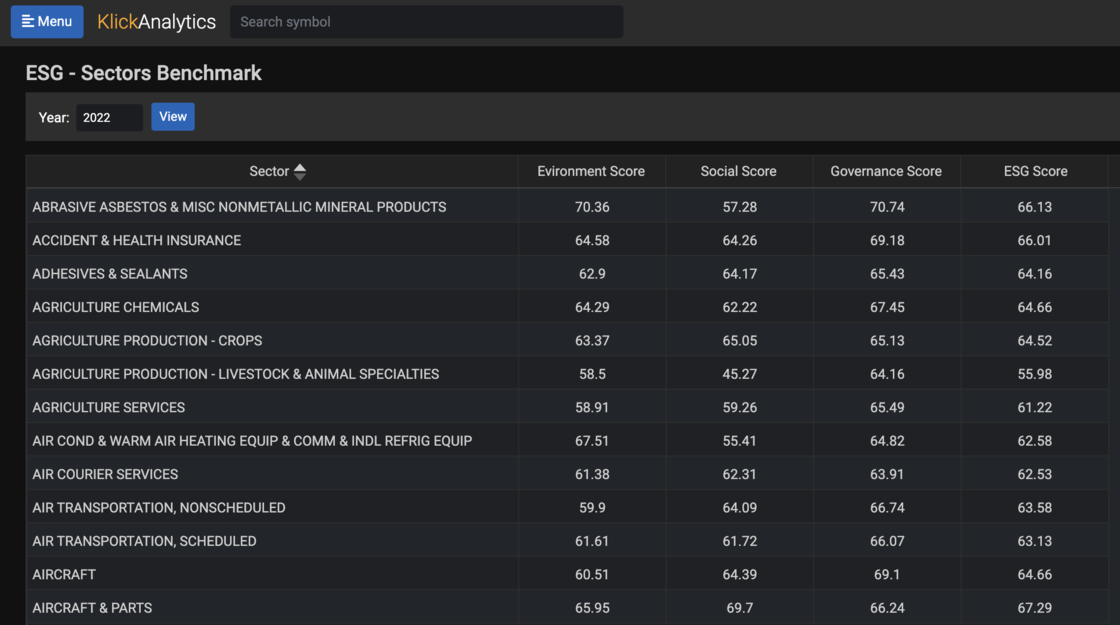
View listed companies ESG scoring with Environment, Social, Governance and overall ESG Scoring.
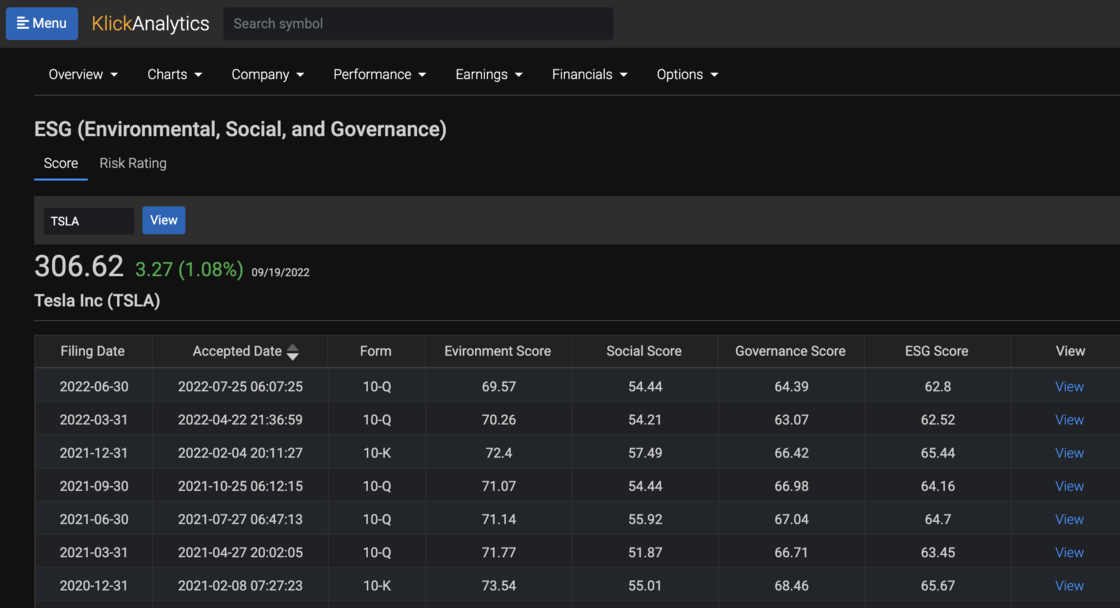
In addition, access historical yearly rating vs Industry Ranking.
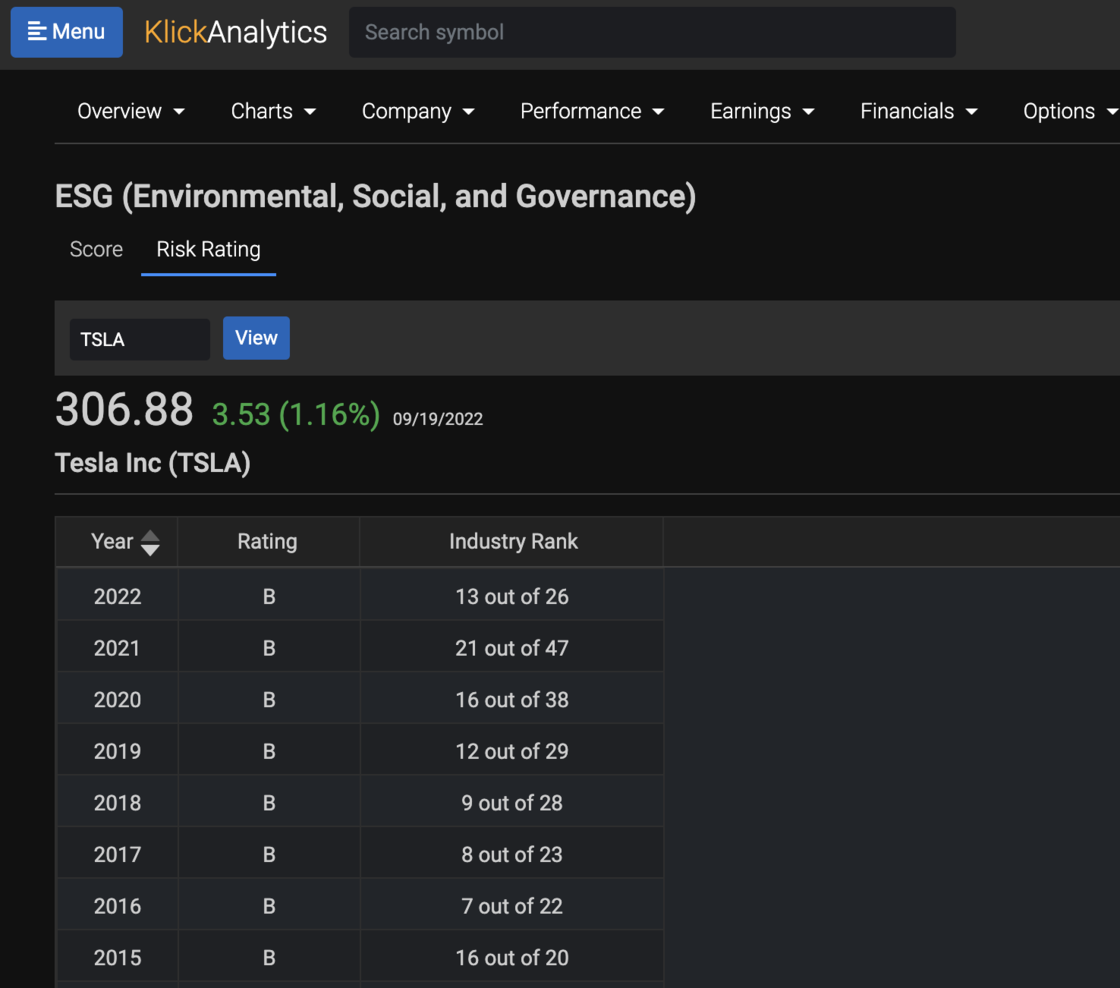
To access: Search for a symbol say TSLA > Company > ESG Score
View latest price target feed
Now you can view all the latest price target feed with Symbol, Price target, Price when published, Analyst Name, Company and more…
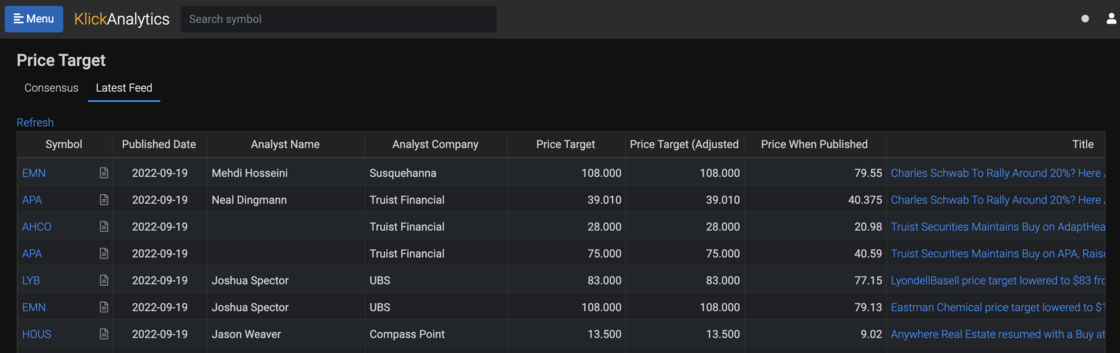
To access: Click on Menu > Price Target > Latest Feed
View analyst recommendations feeds
Now you can view all the latest analyst recommendations feeds at new app called "Latest Feeds"
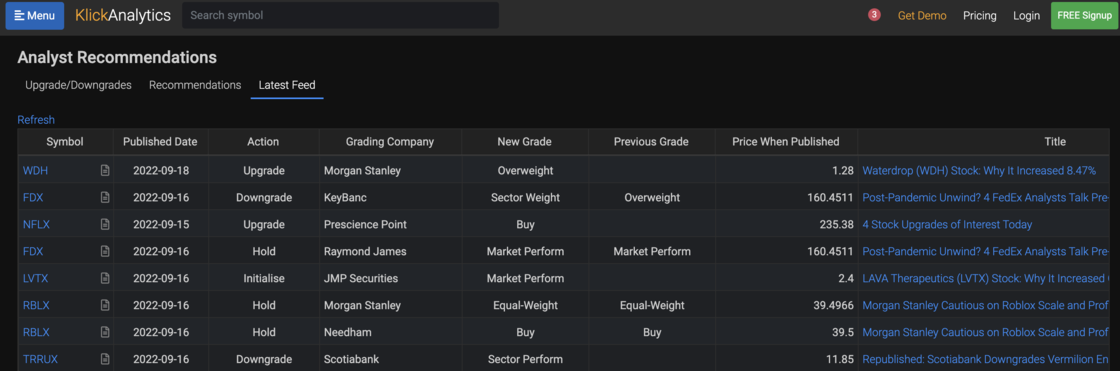
To access: Click Menu > Recommendations > Latest Feed
Ask the market a question. Get a calculated answer.
The AI is not a chatbot bolted onto a document store. It calls the same analytics engine that powers every screen on this platform — so what comes back is a number it computed from raw history, with the command that produced it.
86,000+ instruments
Global equities, ETFs, funds, options, FX, commodities, crypto, economics, filings, transcripts and news — one normalised symbol universe with adjusted history.
A real analytics engine
Screening, backtesting, technicals, options analytics, correlations, seasonality and factor models — computed on demand from raw prices, never a stale cache.
It shows its working
Answers arrive with the charts, tables and tool calls behind them, so you can check the number instead of trusting a paraphrase.
Your own documents
Upload filings, decks and research. Ask across them and the answer cites the page it came from.
Agents and workflows
Multi-step research that runs the platform's tools for you — screen, pull the history, compute, compare, then write it up.
MCP, CLI and API
The same command catalogue from Claude, your own agent, a shell or your pipeline. The answer on screen is the answer your job gets at 4am.
You ask
“How does NVDA usually trade through earnings?”
It calls
→ ka.options_expected_move(NVDA)
It answers
NVDA has averaged a 9.2% absolute move on the day after earnings and closed higher 67% of the time. Two in three reactions land between −4.2% and +16.3% — the distribution is skewed right, not symmetric.
Every figure computed live from our own history — not scraped, not summarised.
Or start with