What's New
Product updates, improvements and fixes across the KlickAnalytics platform.
67 updates · clear
A Smarter View of Analyst Price Targets
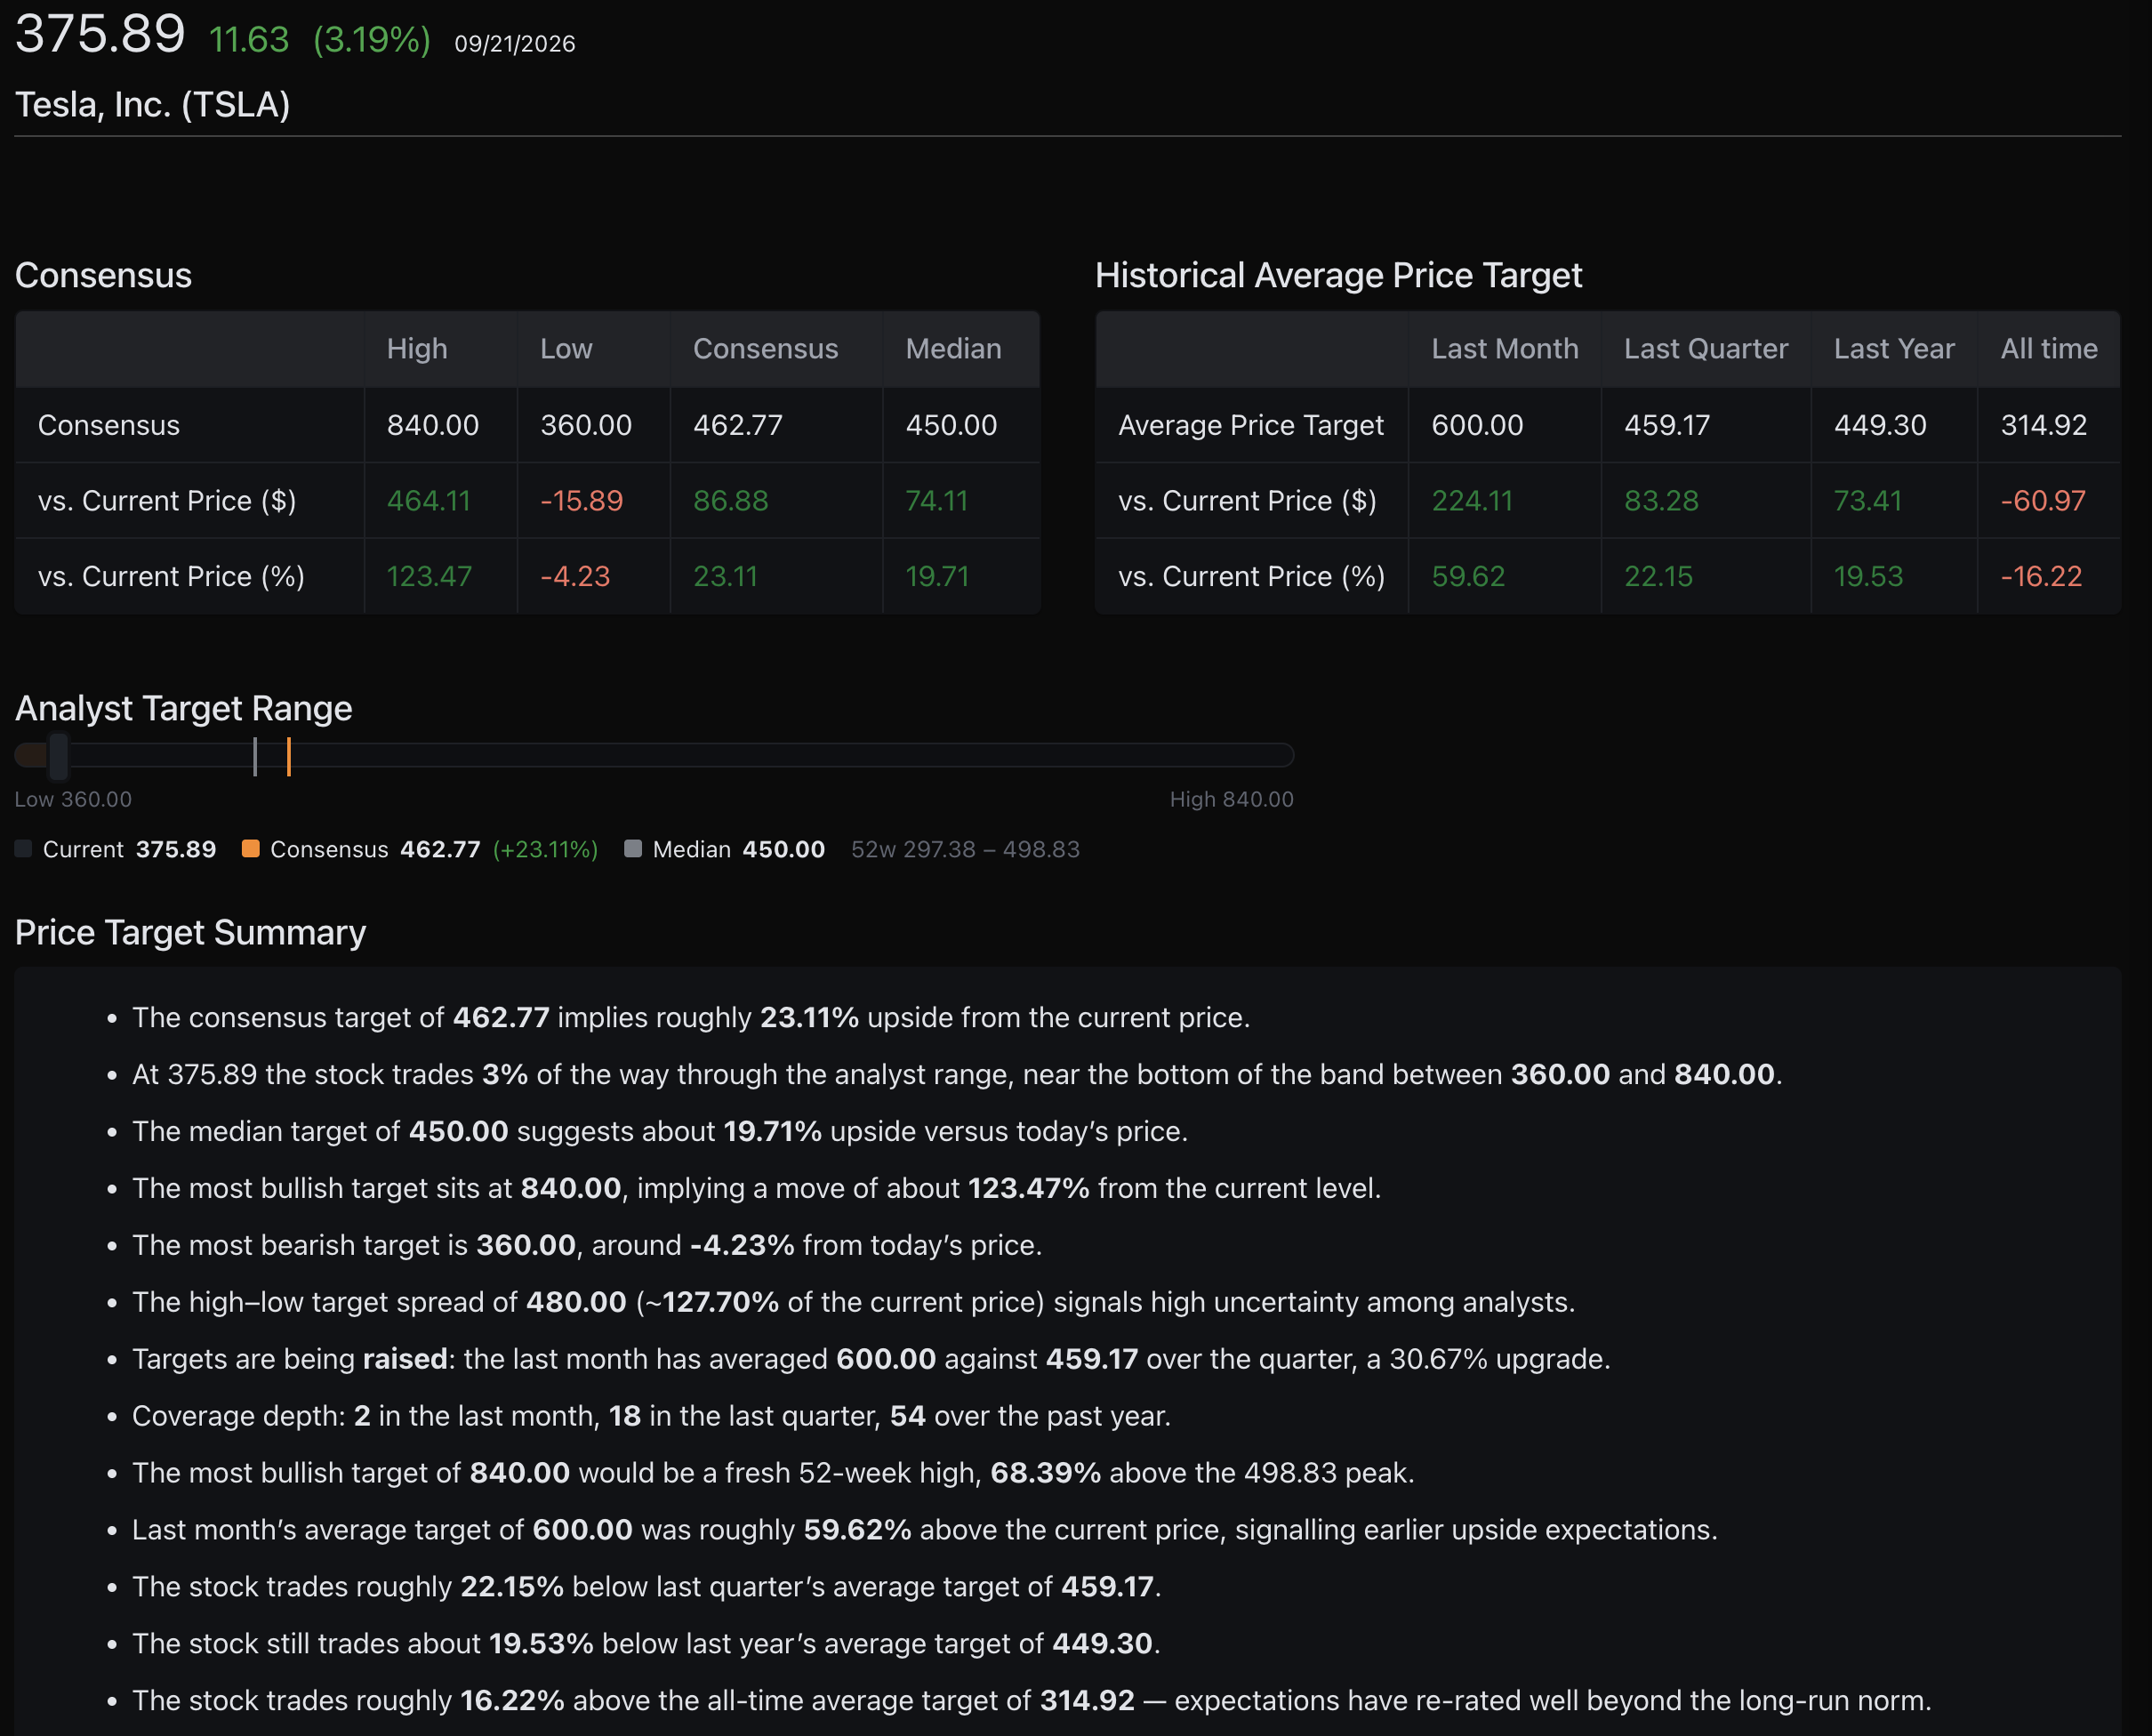
KlickAnalytics now gives you a deeper view of analyst expectations—showing not only the current consensus price target, but how targets are distributed, changing, and positioned against the stock’s current price.
Quickly evaluate:
-
High, low, consensus, and median price targets
-
Implied upside or downside from the current price
-
Where the stock trades within the complete analyst target range
-
Historical average targets over the last month, quarter, year, and all time
-
Whether analyst expectations are being raised or lowered
-
The spread between bullish and bearish targets
-
Coverage depth across recent periods
-
How targets compare with the stock’s 52-week range
A new automatically generated Price Target Summary translates the data into clear observations—highlighting changes in expectations, analyst disagreement, potential upside or downside, and longer-term shifts in market sentiment.
See the range. Track changing expectations. Understand what analysts are pricing in.
To access: Search for any symbol say TSLA, and click Company > Price targets
New: Top Analysts—See the Record Behind Every Call
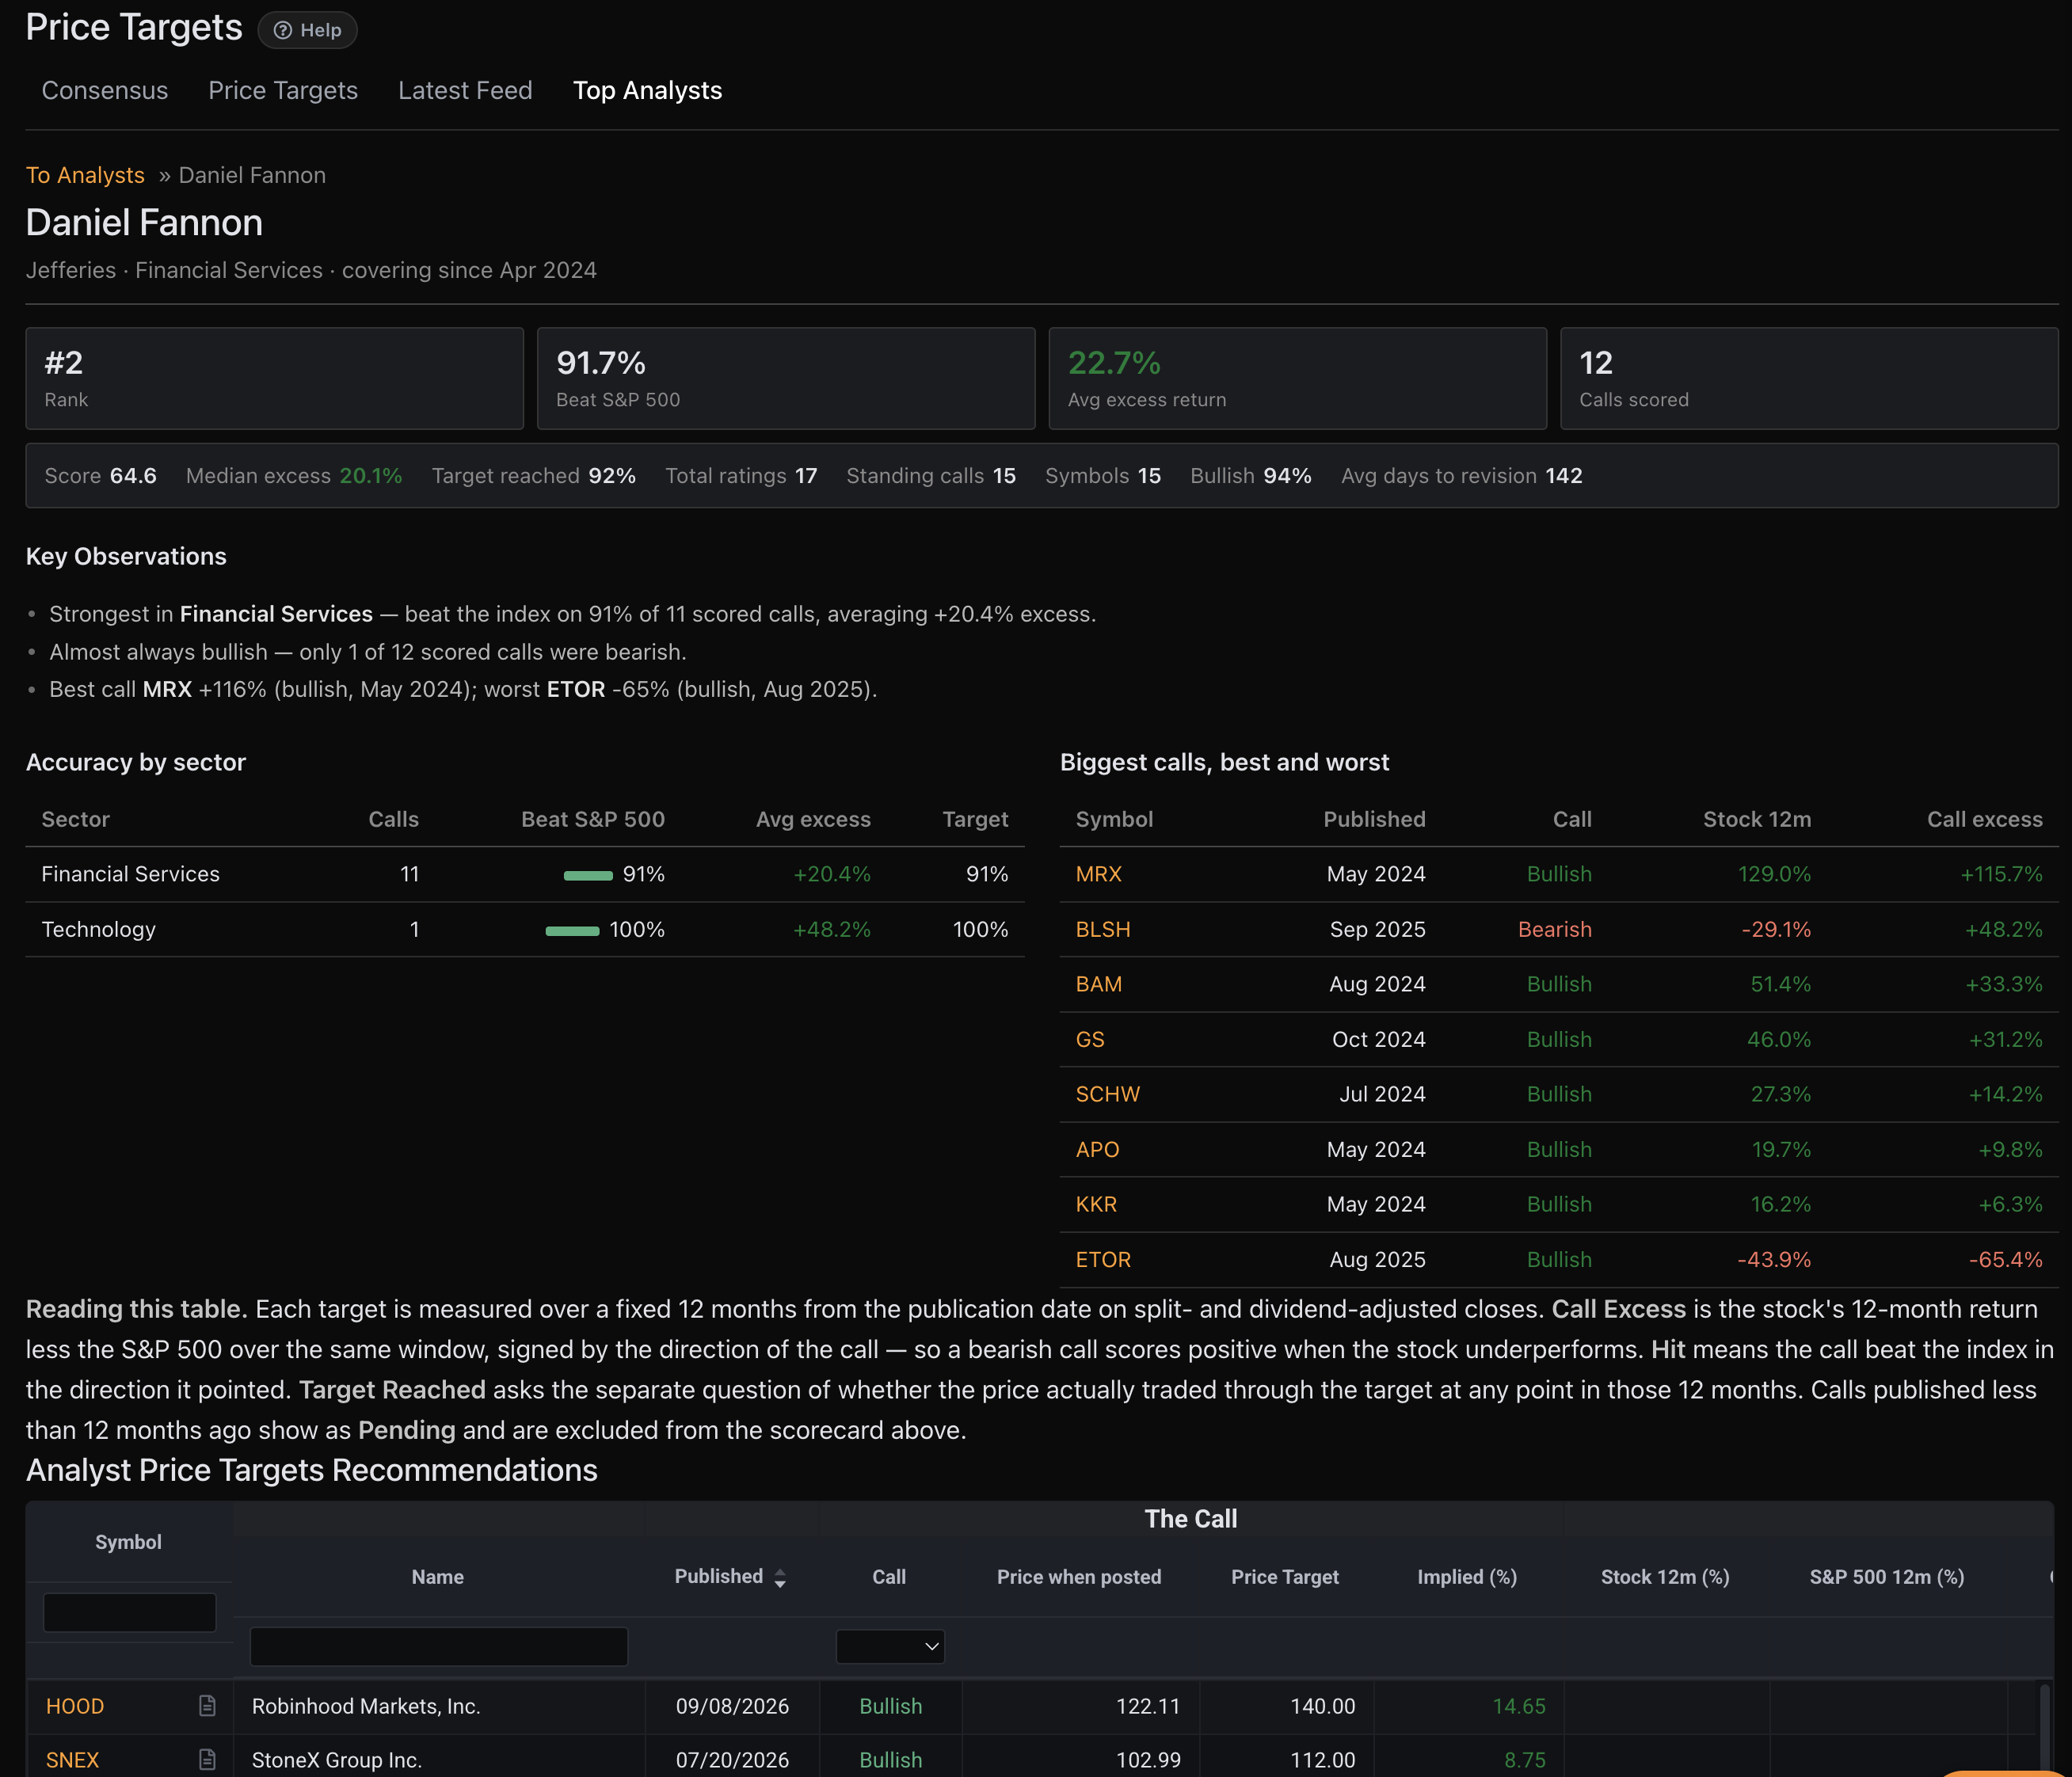
KlickAnalytics now lets you evaluate analysts using their actual historical performance—not just their latest rating or price target.
Each analyst profile provides a transparent, standardized scorecard, including:
-
Overall analyst rank and performance score
-
Percentage of calls that beat the S&P 500
-
Average and median excess returns
-
Price-target achievement rate
-
Bullish and bearish call history
-
Sector-level accuracy and specialization
-
Best and worst historical calls
-
Average time between recommendation revisions
-
Complete coverage across symbols and published ratings
Every eligible call is evaluated over a consistent 12-month period using split- and dividend-adjusted prices. KlickAnalytics also distinguishes between outperforming the benchmark and merely reaching a price target—giving you a more meaningful view of analyst skill.
You can then review the complete recommendation history, including the publication date, original share price, target price, implied return, subsequent stock performance, and benchmark-relative result.
Know who made the call. See how it performed. Decide whose research deserves your attention.
To access: From the Menu > Stocks > Top Analysts
Data-Driven Market News Across U.S. and Gulf Markets
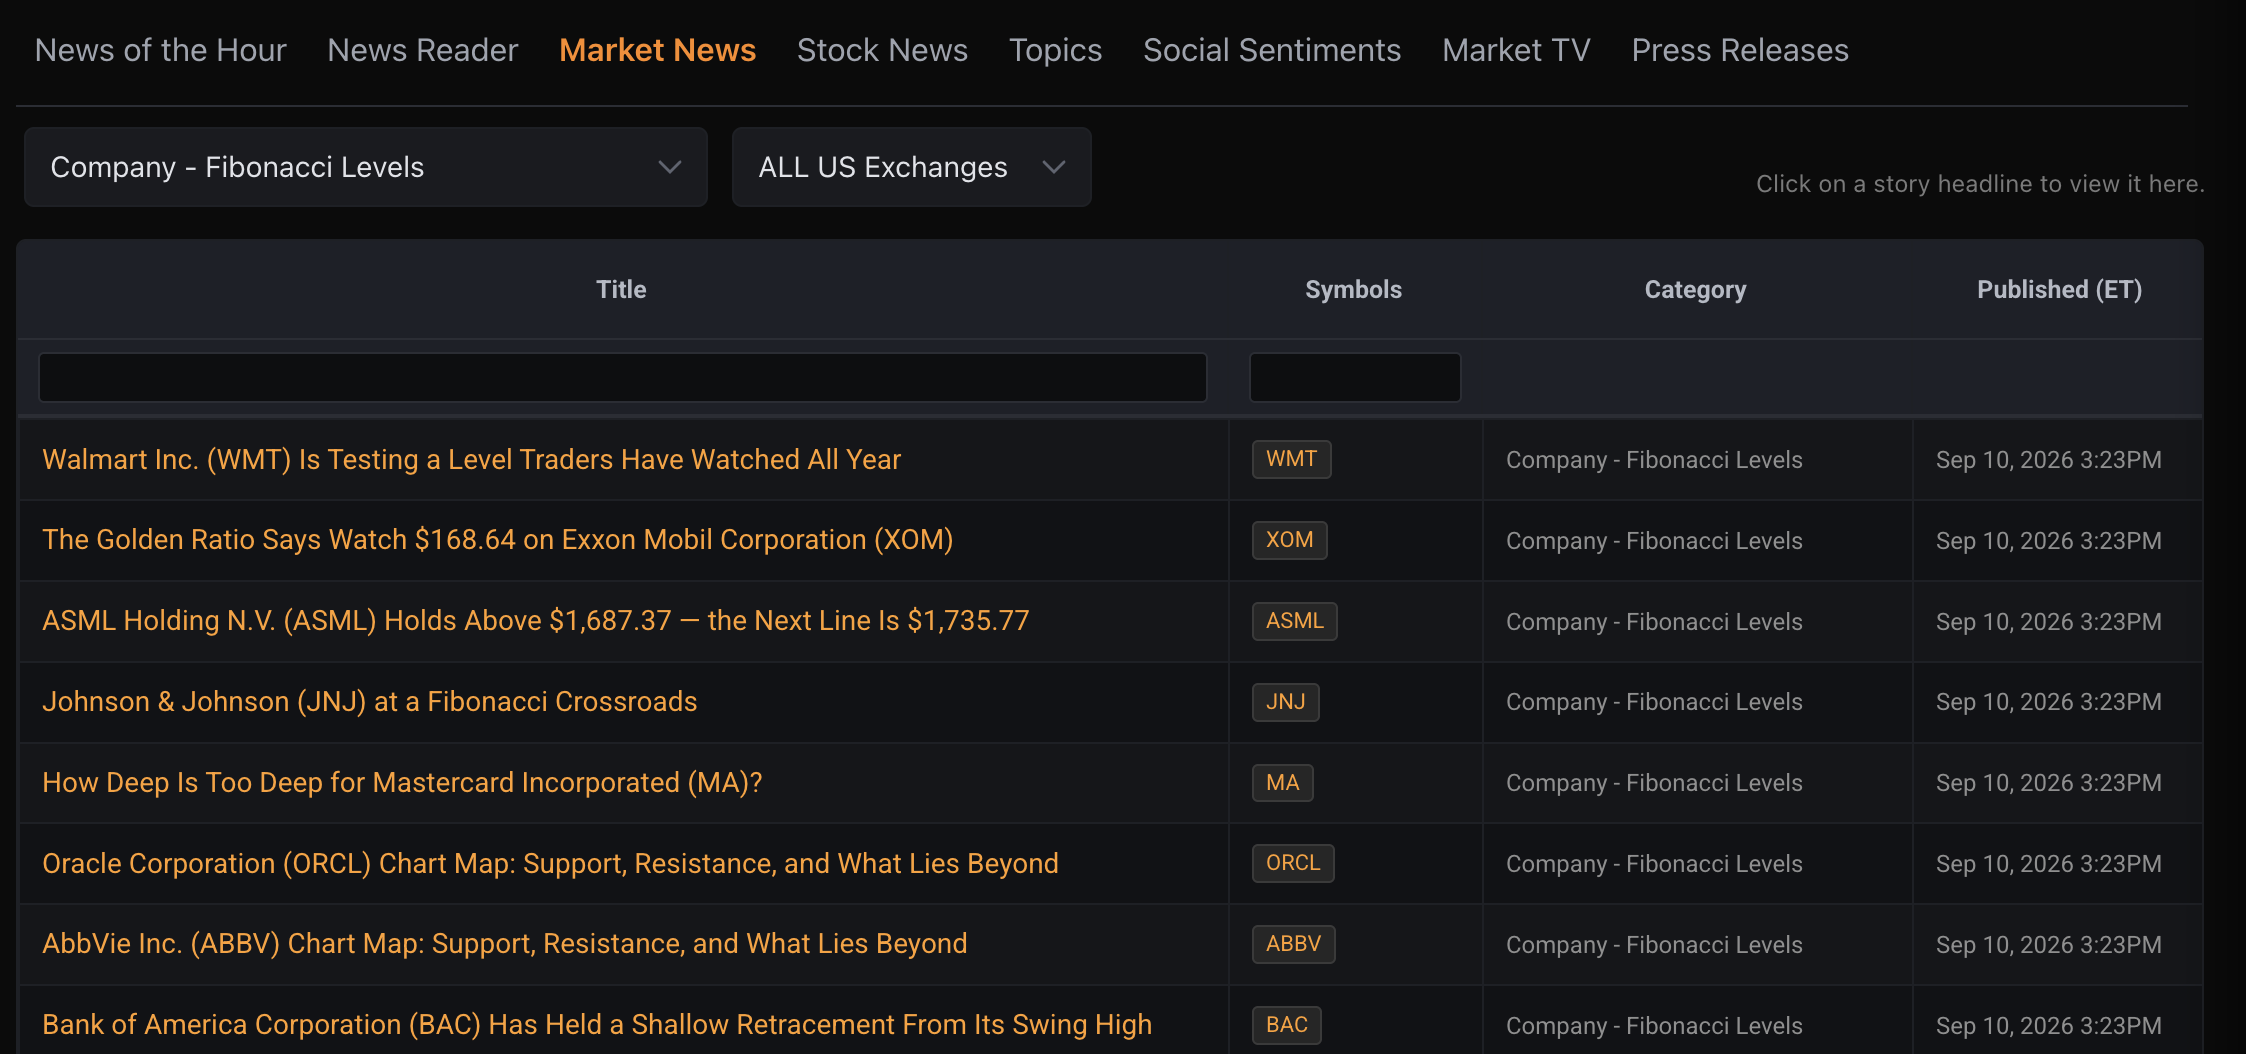
KlickAnalytics has expanded Market News with eight new systematic research categories—built directly from our KA analytics commands and published on recurring schedules.
The new coverage analyzes the top 500 U.S. companies alongside listed markets in Saudi Arabia, Dubai, and Qatar.
New categories include:
-
Market Regime — Weekly
Understand whether each market is trending, consolidating, strengthening, or weakening. -
Candlestick Patterns — Weekly
Discover important bullish and bearish patterns forming across covered securities. -
Liquidity Profile — Weekly
Identify changes in liquidity, trading depth, and market participation. -
Fibonacci Levels — Weekly
Find instruments approaching important Fibonacci retracement and extension levels. -
Gap Statistics — Fortnightly
Analyze gap behavior, continuation, reversals, and historical gap tendencies. -
Price Action Setups — Fortnightly
Surface noteworthy breakouts, pullbacks, consolidations, and other technical setups. -
Technical Signal Pack — Fortnightly
Review combined technical signals across trend, momentum, volatility, and price indicators. -
Volume Profile — Fortnightly
Identify key price zones, high-volume areas, and potential support or resistance.
These updates are produced from structured KlickAnalytics calculations rather than headlines alone. The underlying KA CLI commands analyze the market systematically, while each published story transforms those results into clear, readable market intelligence.
This gives users recurring coverage of signals and conditions that traditional news feeds often overlook—across both developed and fast-growing Gulf markets.
From market data to market intelligence—systematically, consistently, and across regions.
To access: From the Menu > NewsRoom > Market News
Browse 100+ Apps by Market Player
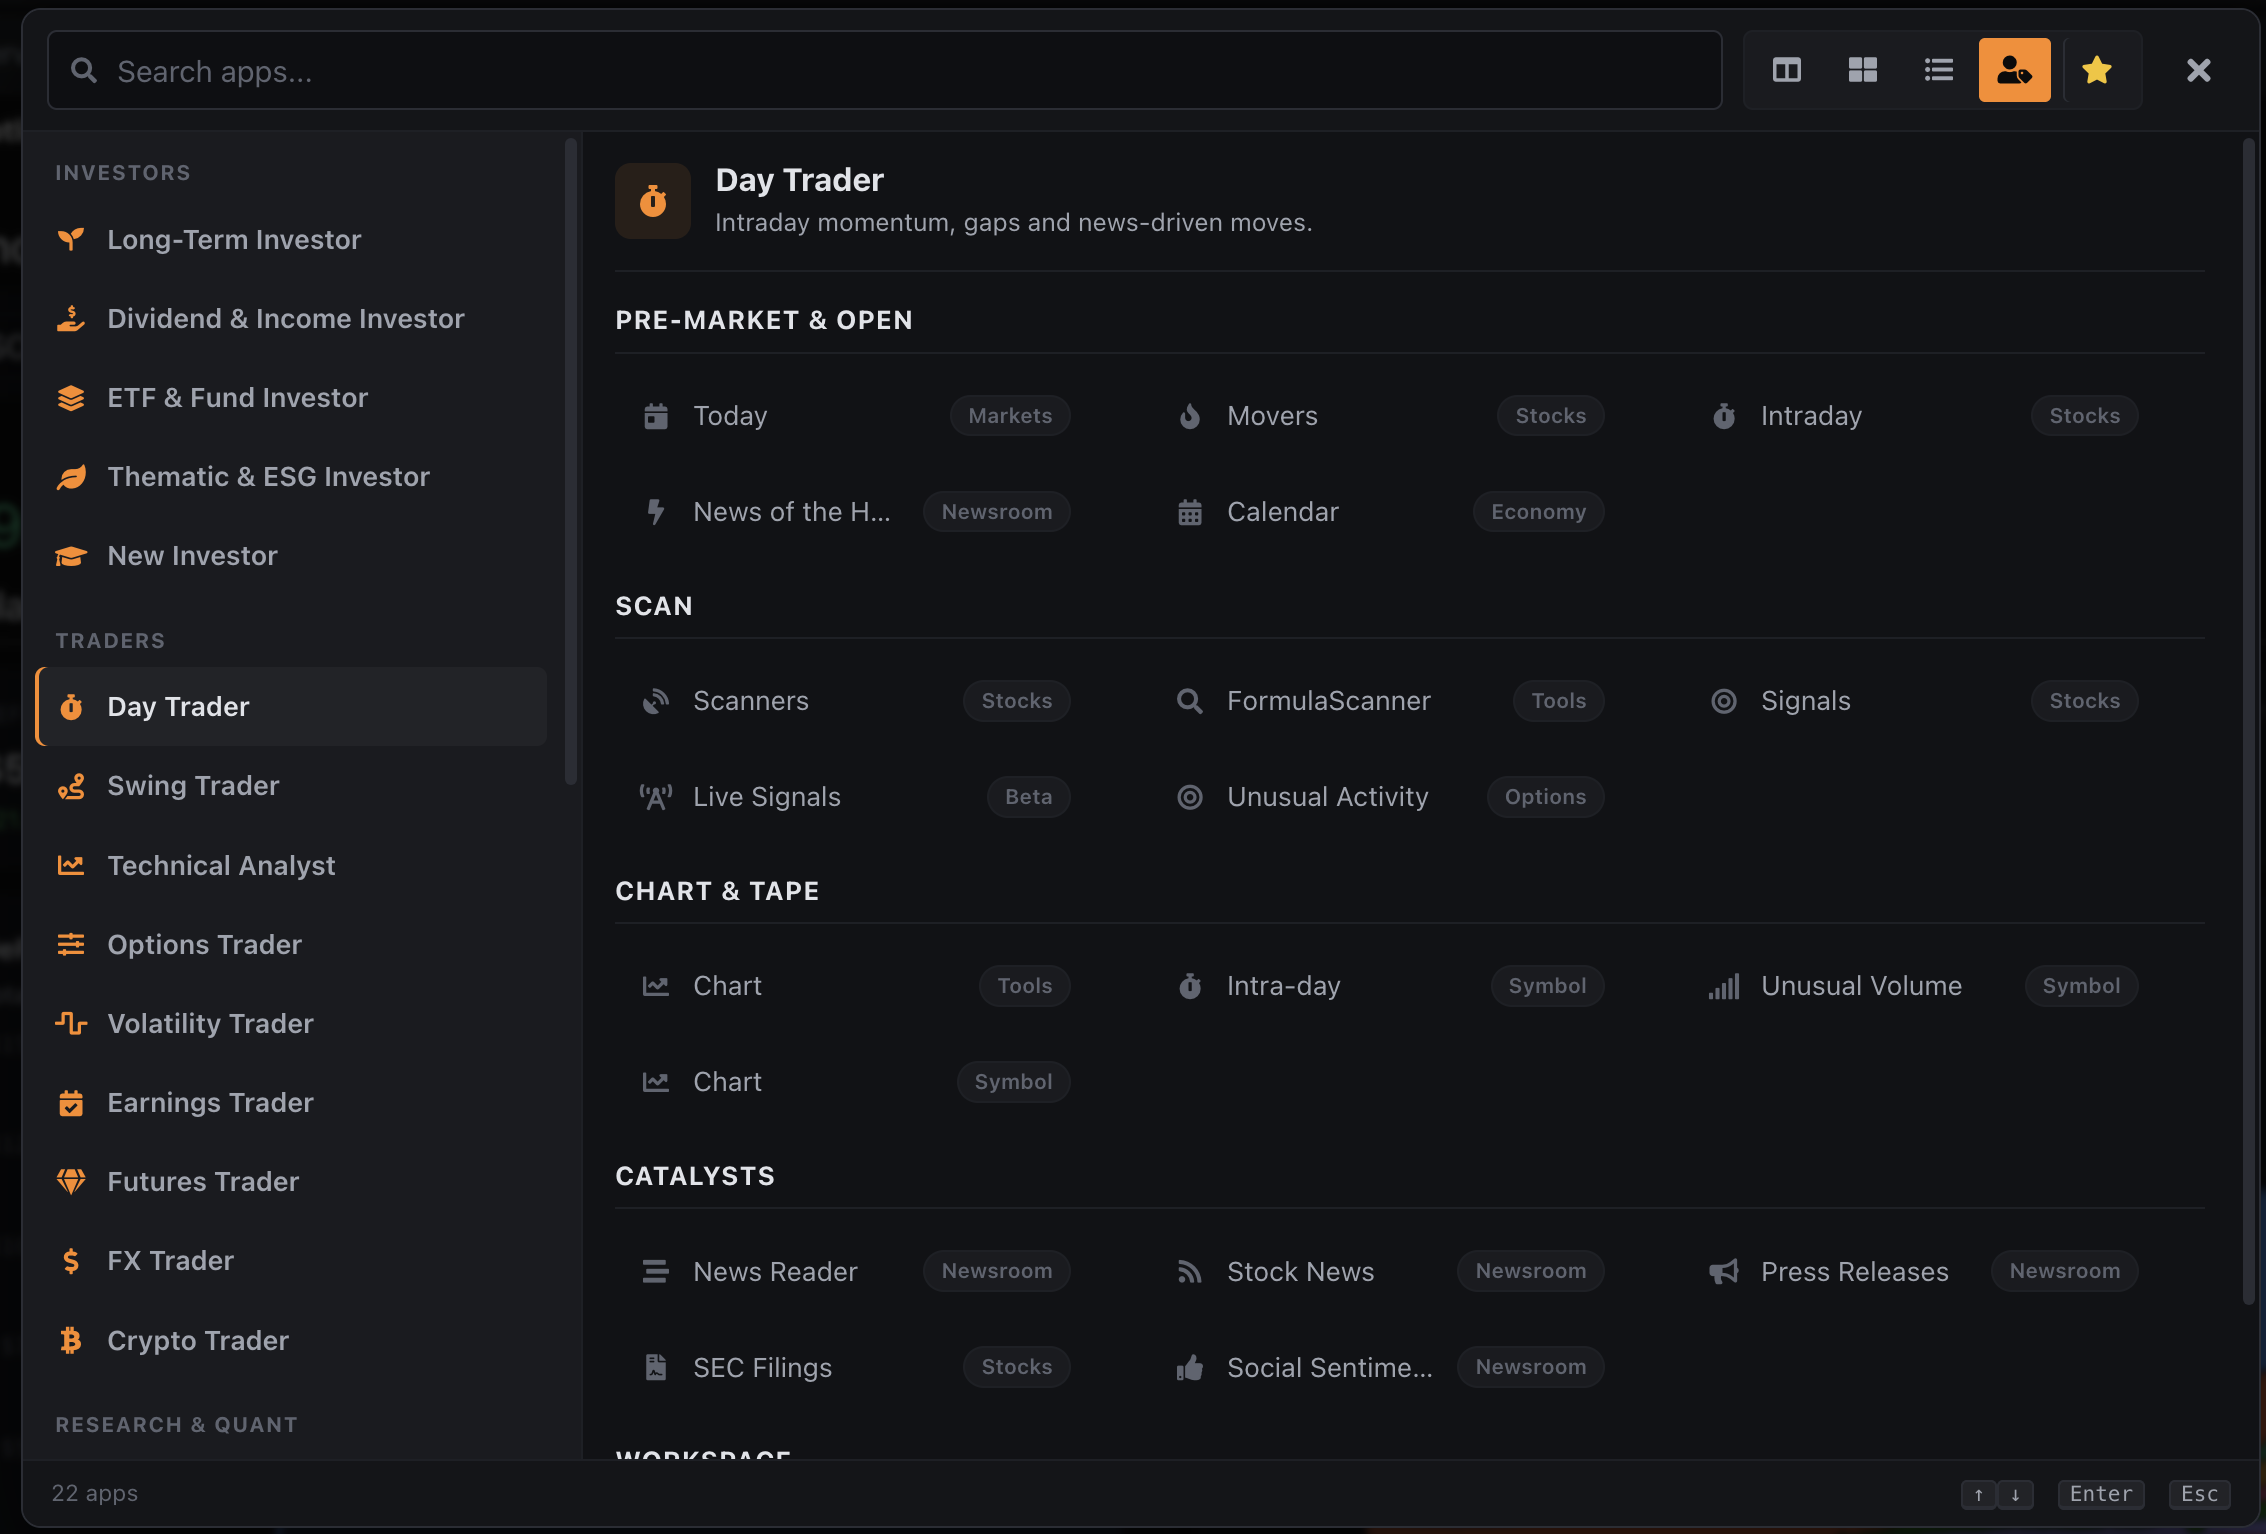
KlickAnalytics now makes it easier to discover the most relevant tools for your role in the financial markets.
In addition to searching through every available app, you can now also browse purpose-built collections organized by Market Player, including:
-
Portfolio managers
-
Traders
-
Equity research analysts
-
Quantitative analysts
-
Investment bankers
-
Hedge funds
-
Private equity professionals
-
Risk managers
-
Wealth managers
-
Economists and market strategists
Each Market Player view brings together the apps, analytics, reports, and workflows most relevant to that role—from portfolio analysis and trade research to company comparisons, valuation, risk, screening, market monitoring, and AI-powered intelligence.
Whether you are researching a company, monitoring a portfolio, preparing an investment committee review, or searching for a new opportunity, KlickAnalytics helps you find the right tool faster.
Choose your role. Discover your tools. Build your workflow.
To access: Click on Menu > and then select the people icon and select your player type
Terminal > Build and Manage Your Terminal More Easily
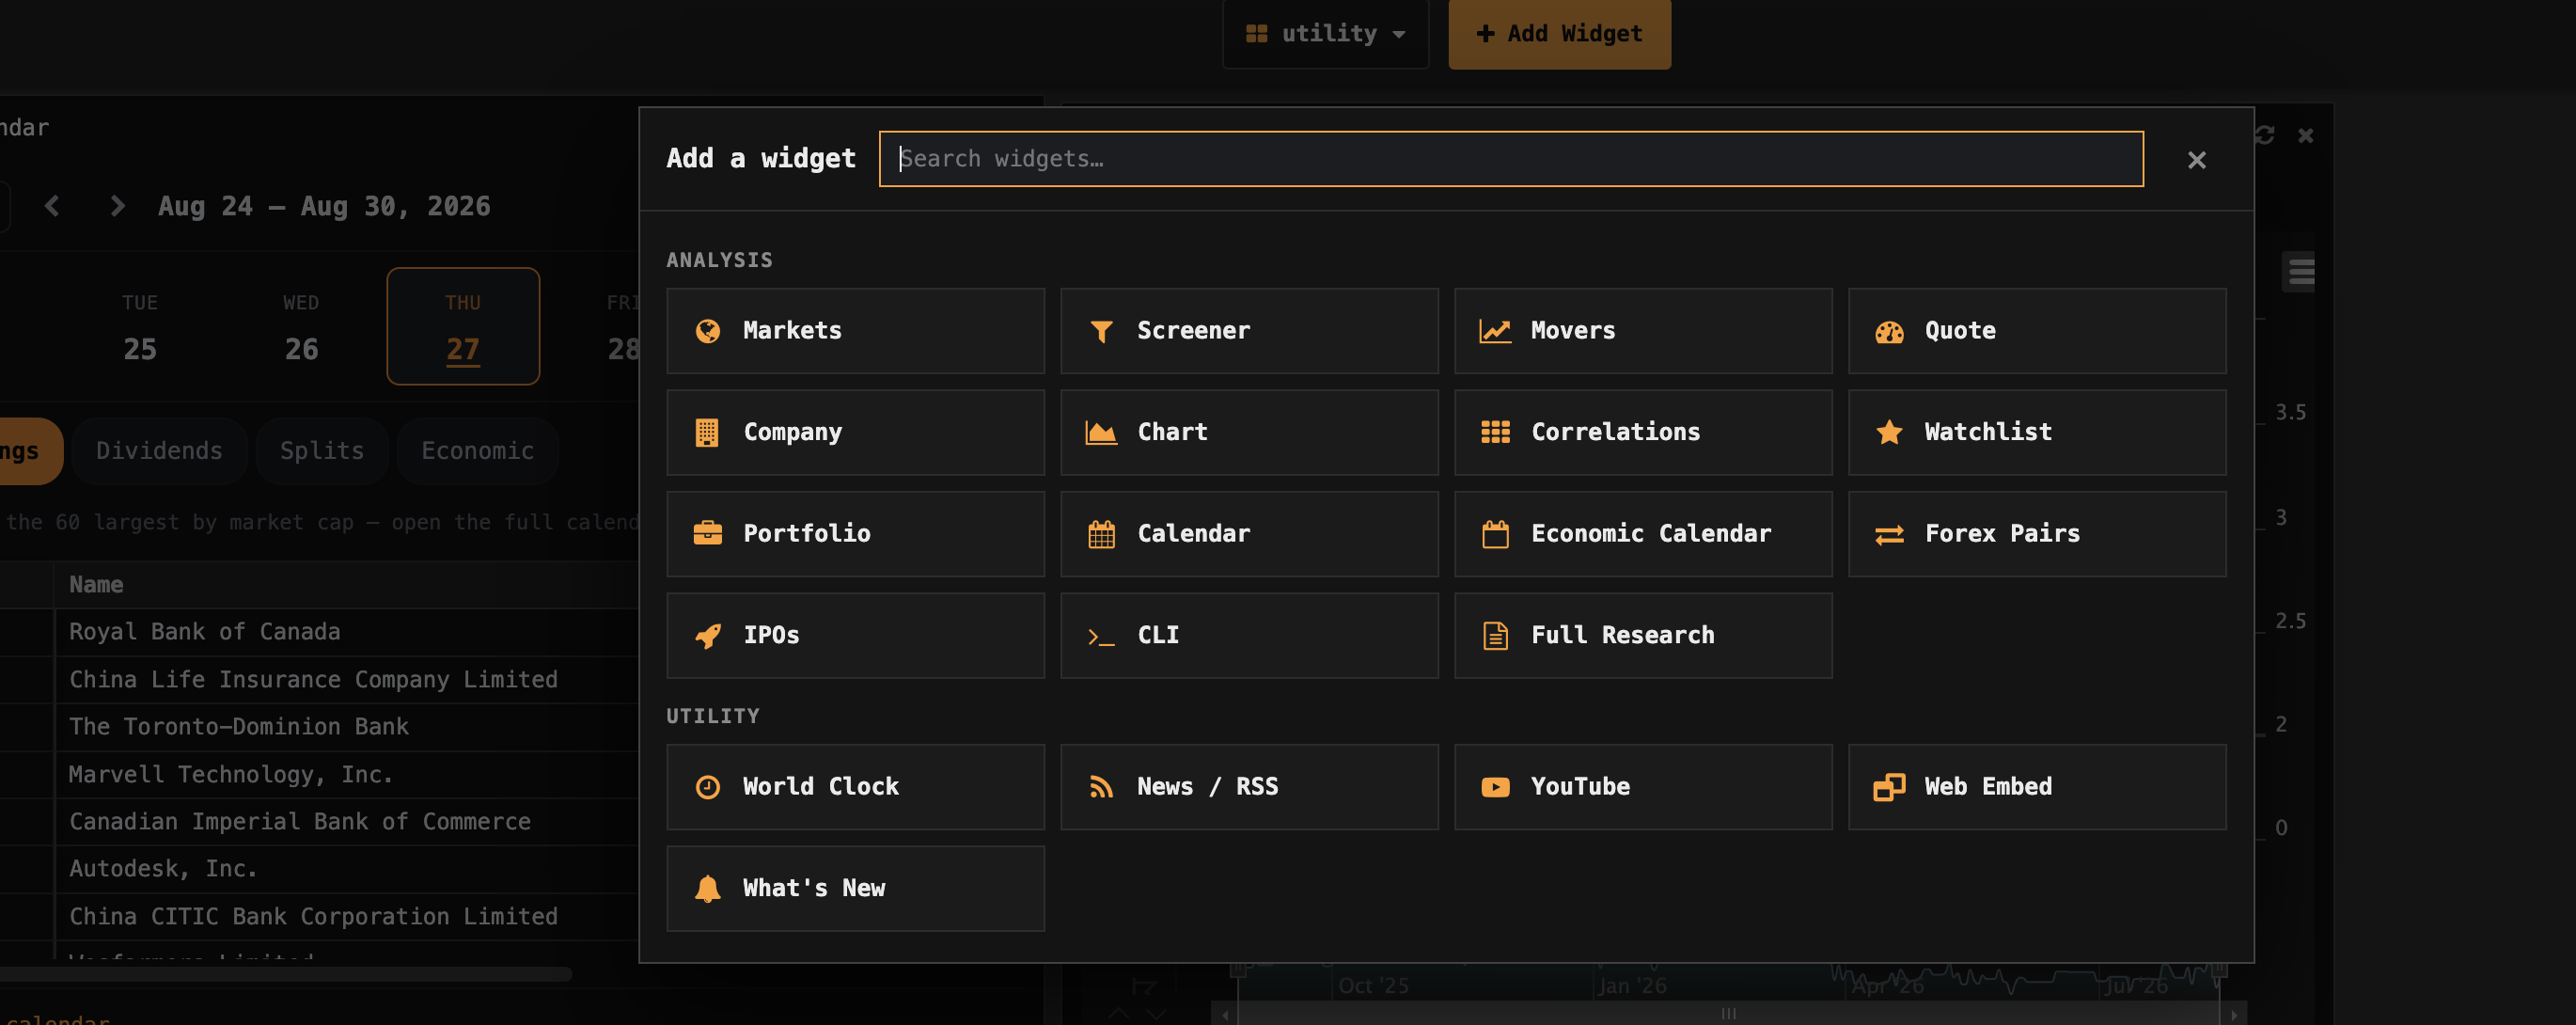
KlickAnalytics has introduced a faster, simpler way to manage Terminal workspaces and add the widgets you need.
The new widget manager lets you:
-
Search for widgets instantly
-
Browse widgets by category
-
Add market analysis, research, and utility tools with one click
-
Build specialized workspaces for trading, research, portfolio monitoring, or market surveillance
-
Quickly add charts, quotes, screeners, movers, correlations, watchlists, portfolios, calendars, news, CLI access, and more
-
Include utility widgets such as world clocks, YouTube, RSS feeds, and embedded web content
-
Organize each Terminal workspace around a specific workflow or objective
-
Update your workspace as your research needs change
Whether you need a focused symbol-analysis screen, a global-market dashboard, or a complete trading workspace, you can now assemble it quickly from one organized widget library.
Choose your widgets. Design your workflow. Make the Terminal yours.
Advanced Seasonality—Go Beyond Simple Historical Averages
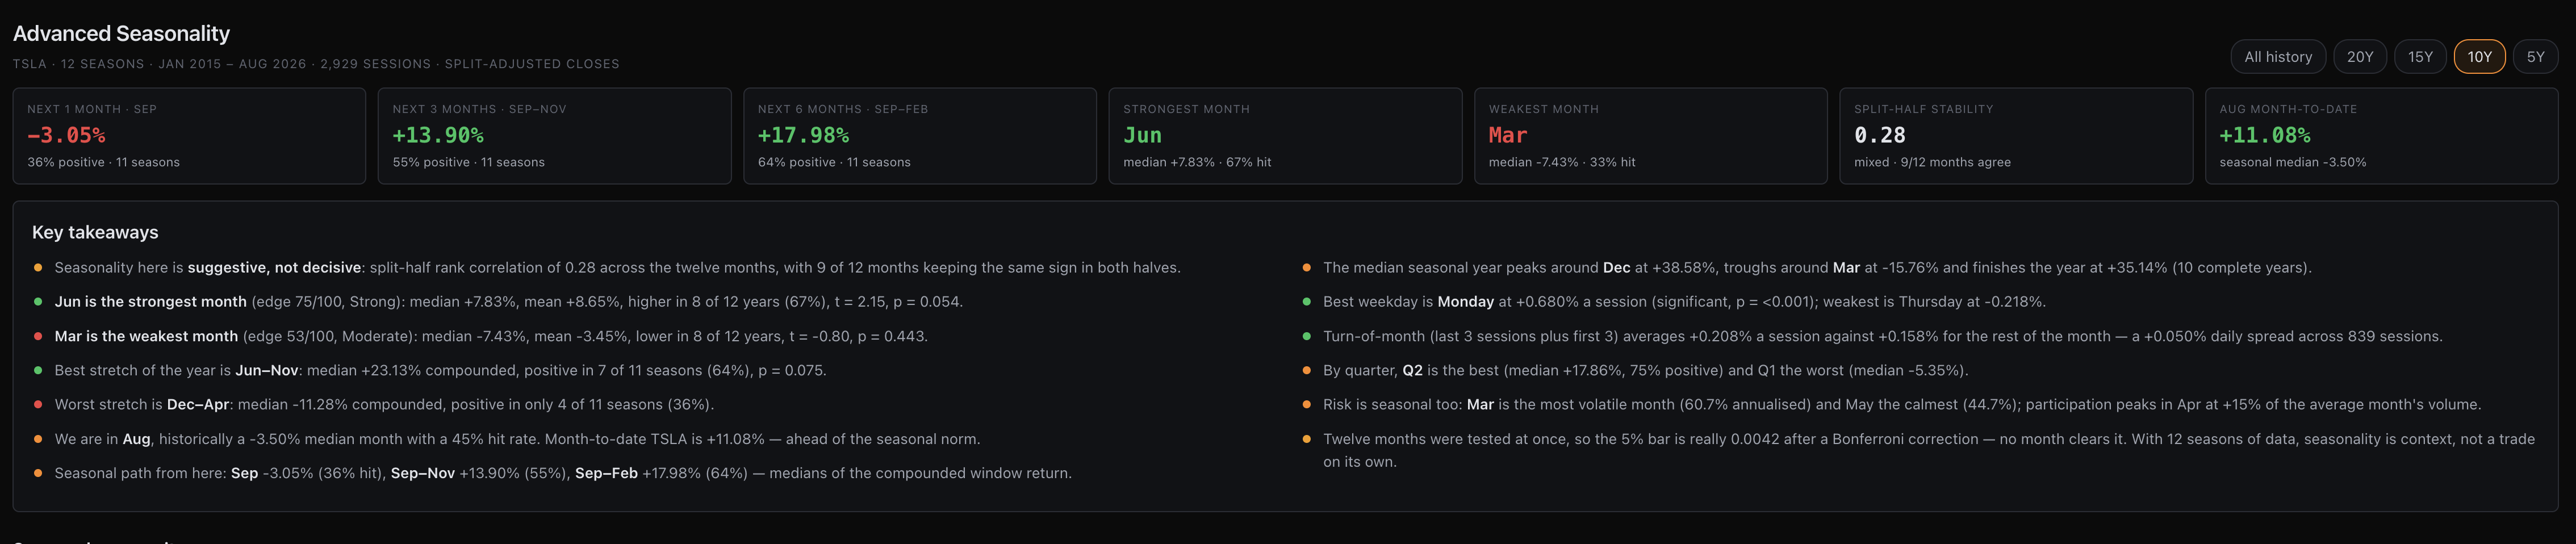
KlickAnalytics has significantly expanded its seasonality analysis, giving users a deeper and more statistically grounded view of how any symbol has historically performed across months, quarters, weekdays, and multi-month periods.
With Advanced Seasonality, you can now:
-
View expected performance for the next one, three, and six months
-
Identify the historically strongest and weakest months
-
Compare median and average returns, positive-year hit rates, and best and worst outcomes
-
Measure whether seasonal patterns remained stable between the first and second halves of history
-
Review statistical significance, volatility, risk-adjusted returns, and seasonal-edge scores
-
Discover the strongest and weakest contiguous seasonal windows
-
Compare quarterly and weekday performance
-
Analyze turn-of-the-month behavior
-
See which months historically experienced the greatest volatility and trading activity
-
Compare the current month’s performance with its historical seasonal pattern
-
Switch between five, 10, 15, 20 years, or all available history
-
Read automatically generated key takeaways explaining the most important seasonal findings
The new Seasonal Edge rating also helps distinguish potentially meaningful patterns from weak or noisy historical relationships—making it easier to understand both the opportunity and the reliability behind each result.
Seasonality is no longer just a monthly chart. It is now a complete statistical view of when a symbol has historically performed best, when it has struggled, and how much confidence you should place in the pattern.
Find the pattern. Test its strength. Prepare for what comes next.
To access: Search for any global symbol, and then from the menu select Analysis > Seasonality
World Markets—See What’s Moving Around the Globe
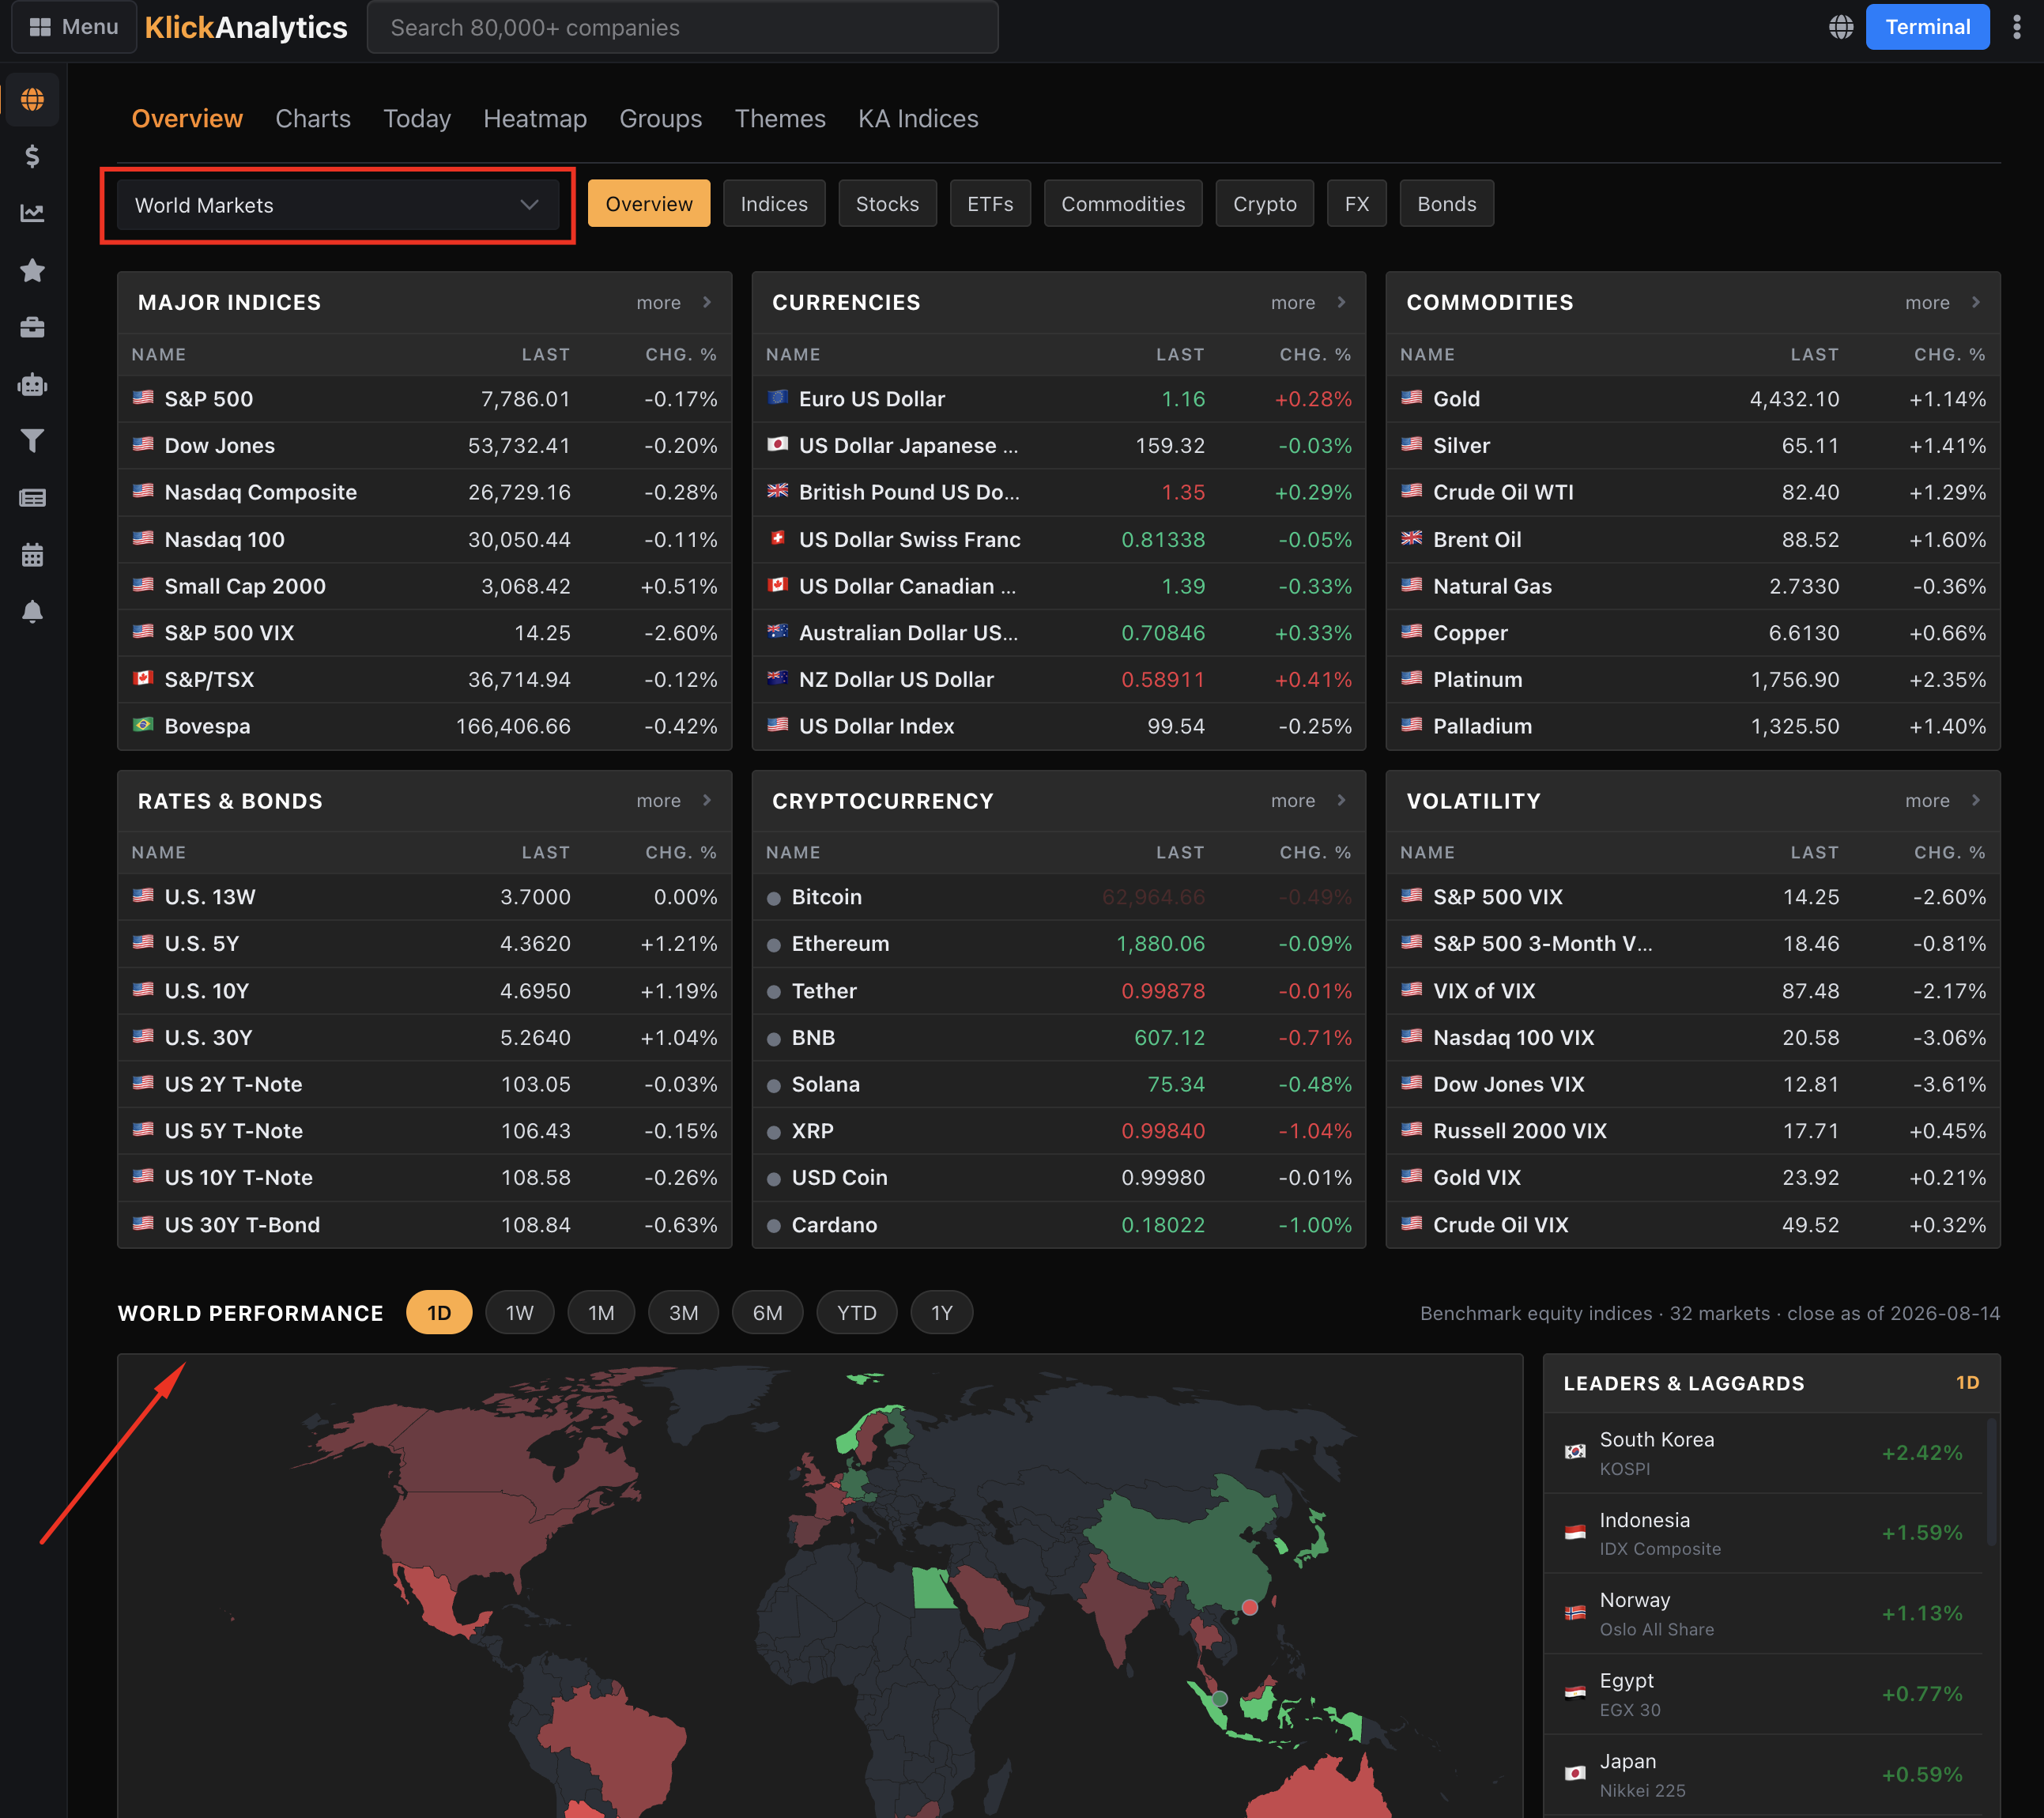
KlickAnalytics introduces World Markets, a unified view of global market activity designed to help you understand what is happening across regions and asset classes at a glance.
Quickly monitor:
- Major global indices
- Currencies and foreign-exchange pairs
- Commodities and energy markets
- Government rates and bonds
- Cryptocurrencies
- Volatility indices
- Global stocks and ETFs
The new interactive world map provides an immediate visual view of market performance across countries. Switch between time periods—from one day to one year—to see where markets are gaining or declining.
You can also identify global leaders and laggards, compare regional performance, and discover the markets driving the day’s biggest moves.
Global markets. Top movers. One powerful map.
Market TV—Financial News, All in One Place
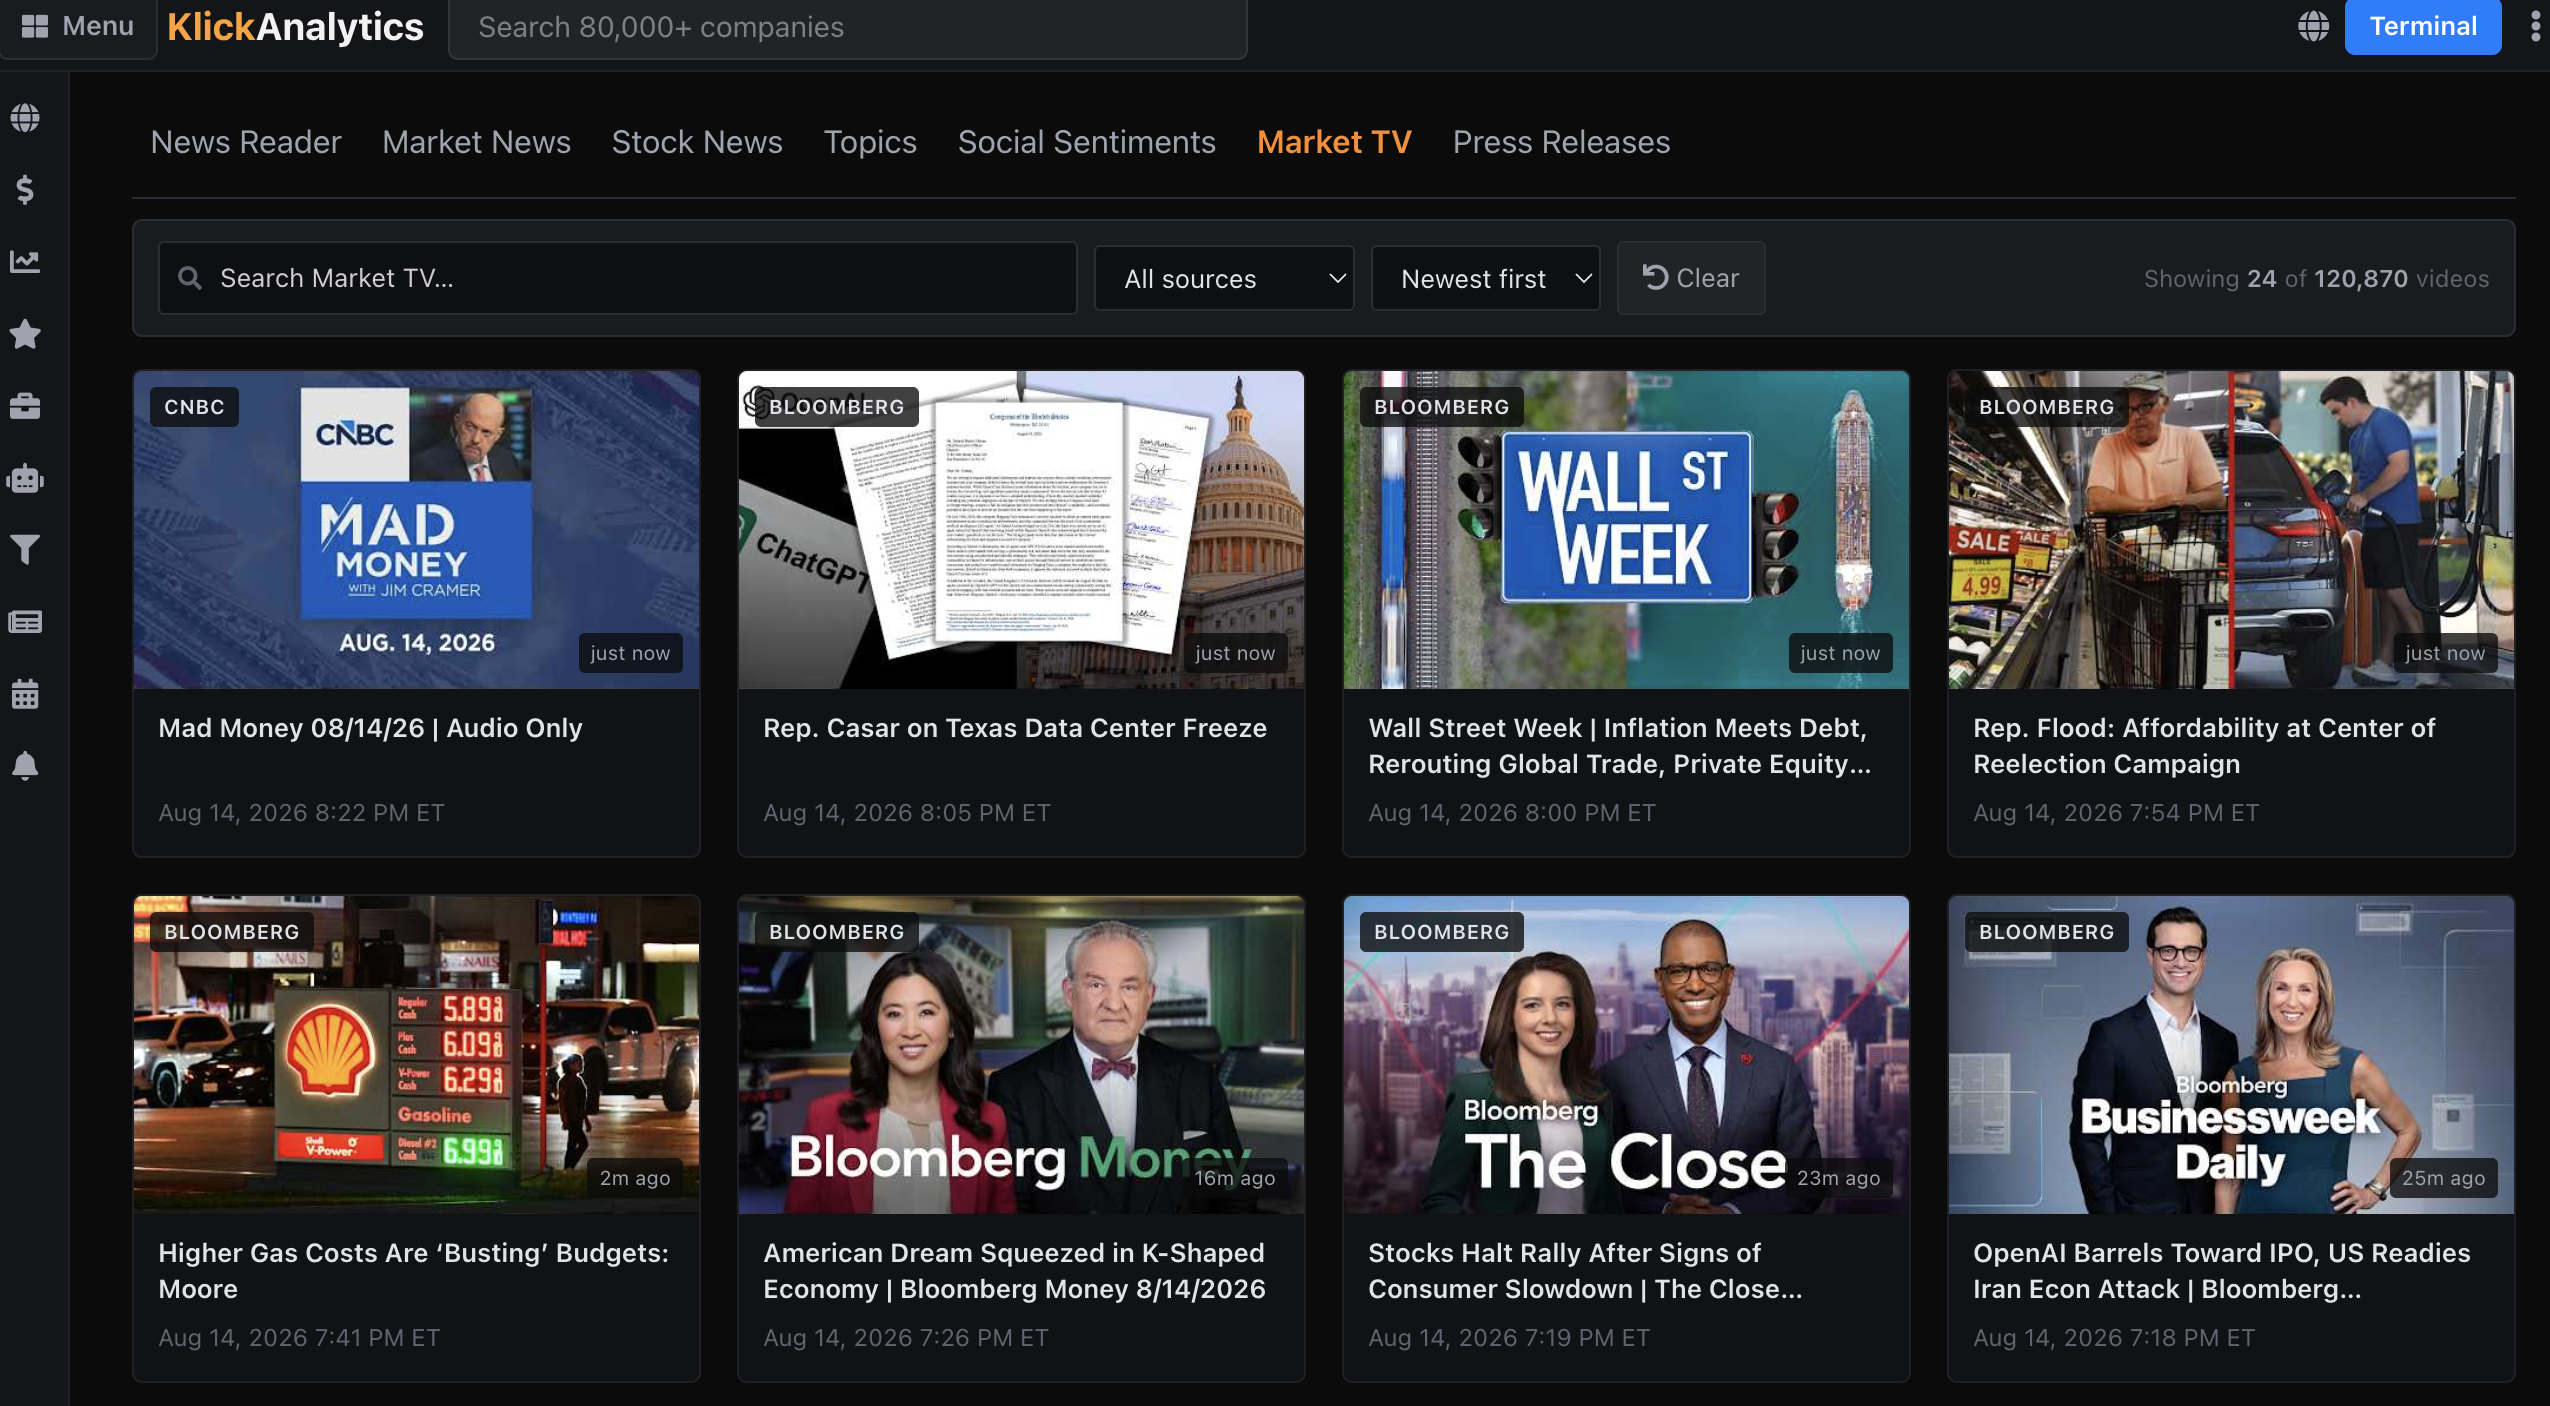
KlickAnalytics now gives you direct access to the latest financial-market videos from leading sources, including CNBC and Bloomberg.
With Market TV, you can:
- Watch the latest market news, interviews, and financial programs
- Explore more than 120,000 market-related videos
- Search for companies, topics, events, and market themes
- Filter videos by news source
- Sort coverage to find the newest updates first
- Follow breaking news, economic developments, earnings discussions, and expert market commentary
From market-moving headlines to in-depth analysis, Market TV makes it easier to stay informed without leaving KlickAnalytics.
Watch the news. Understand the markets. Make better-informed decisions.
A Complete View of Every Symbol
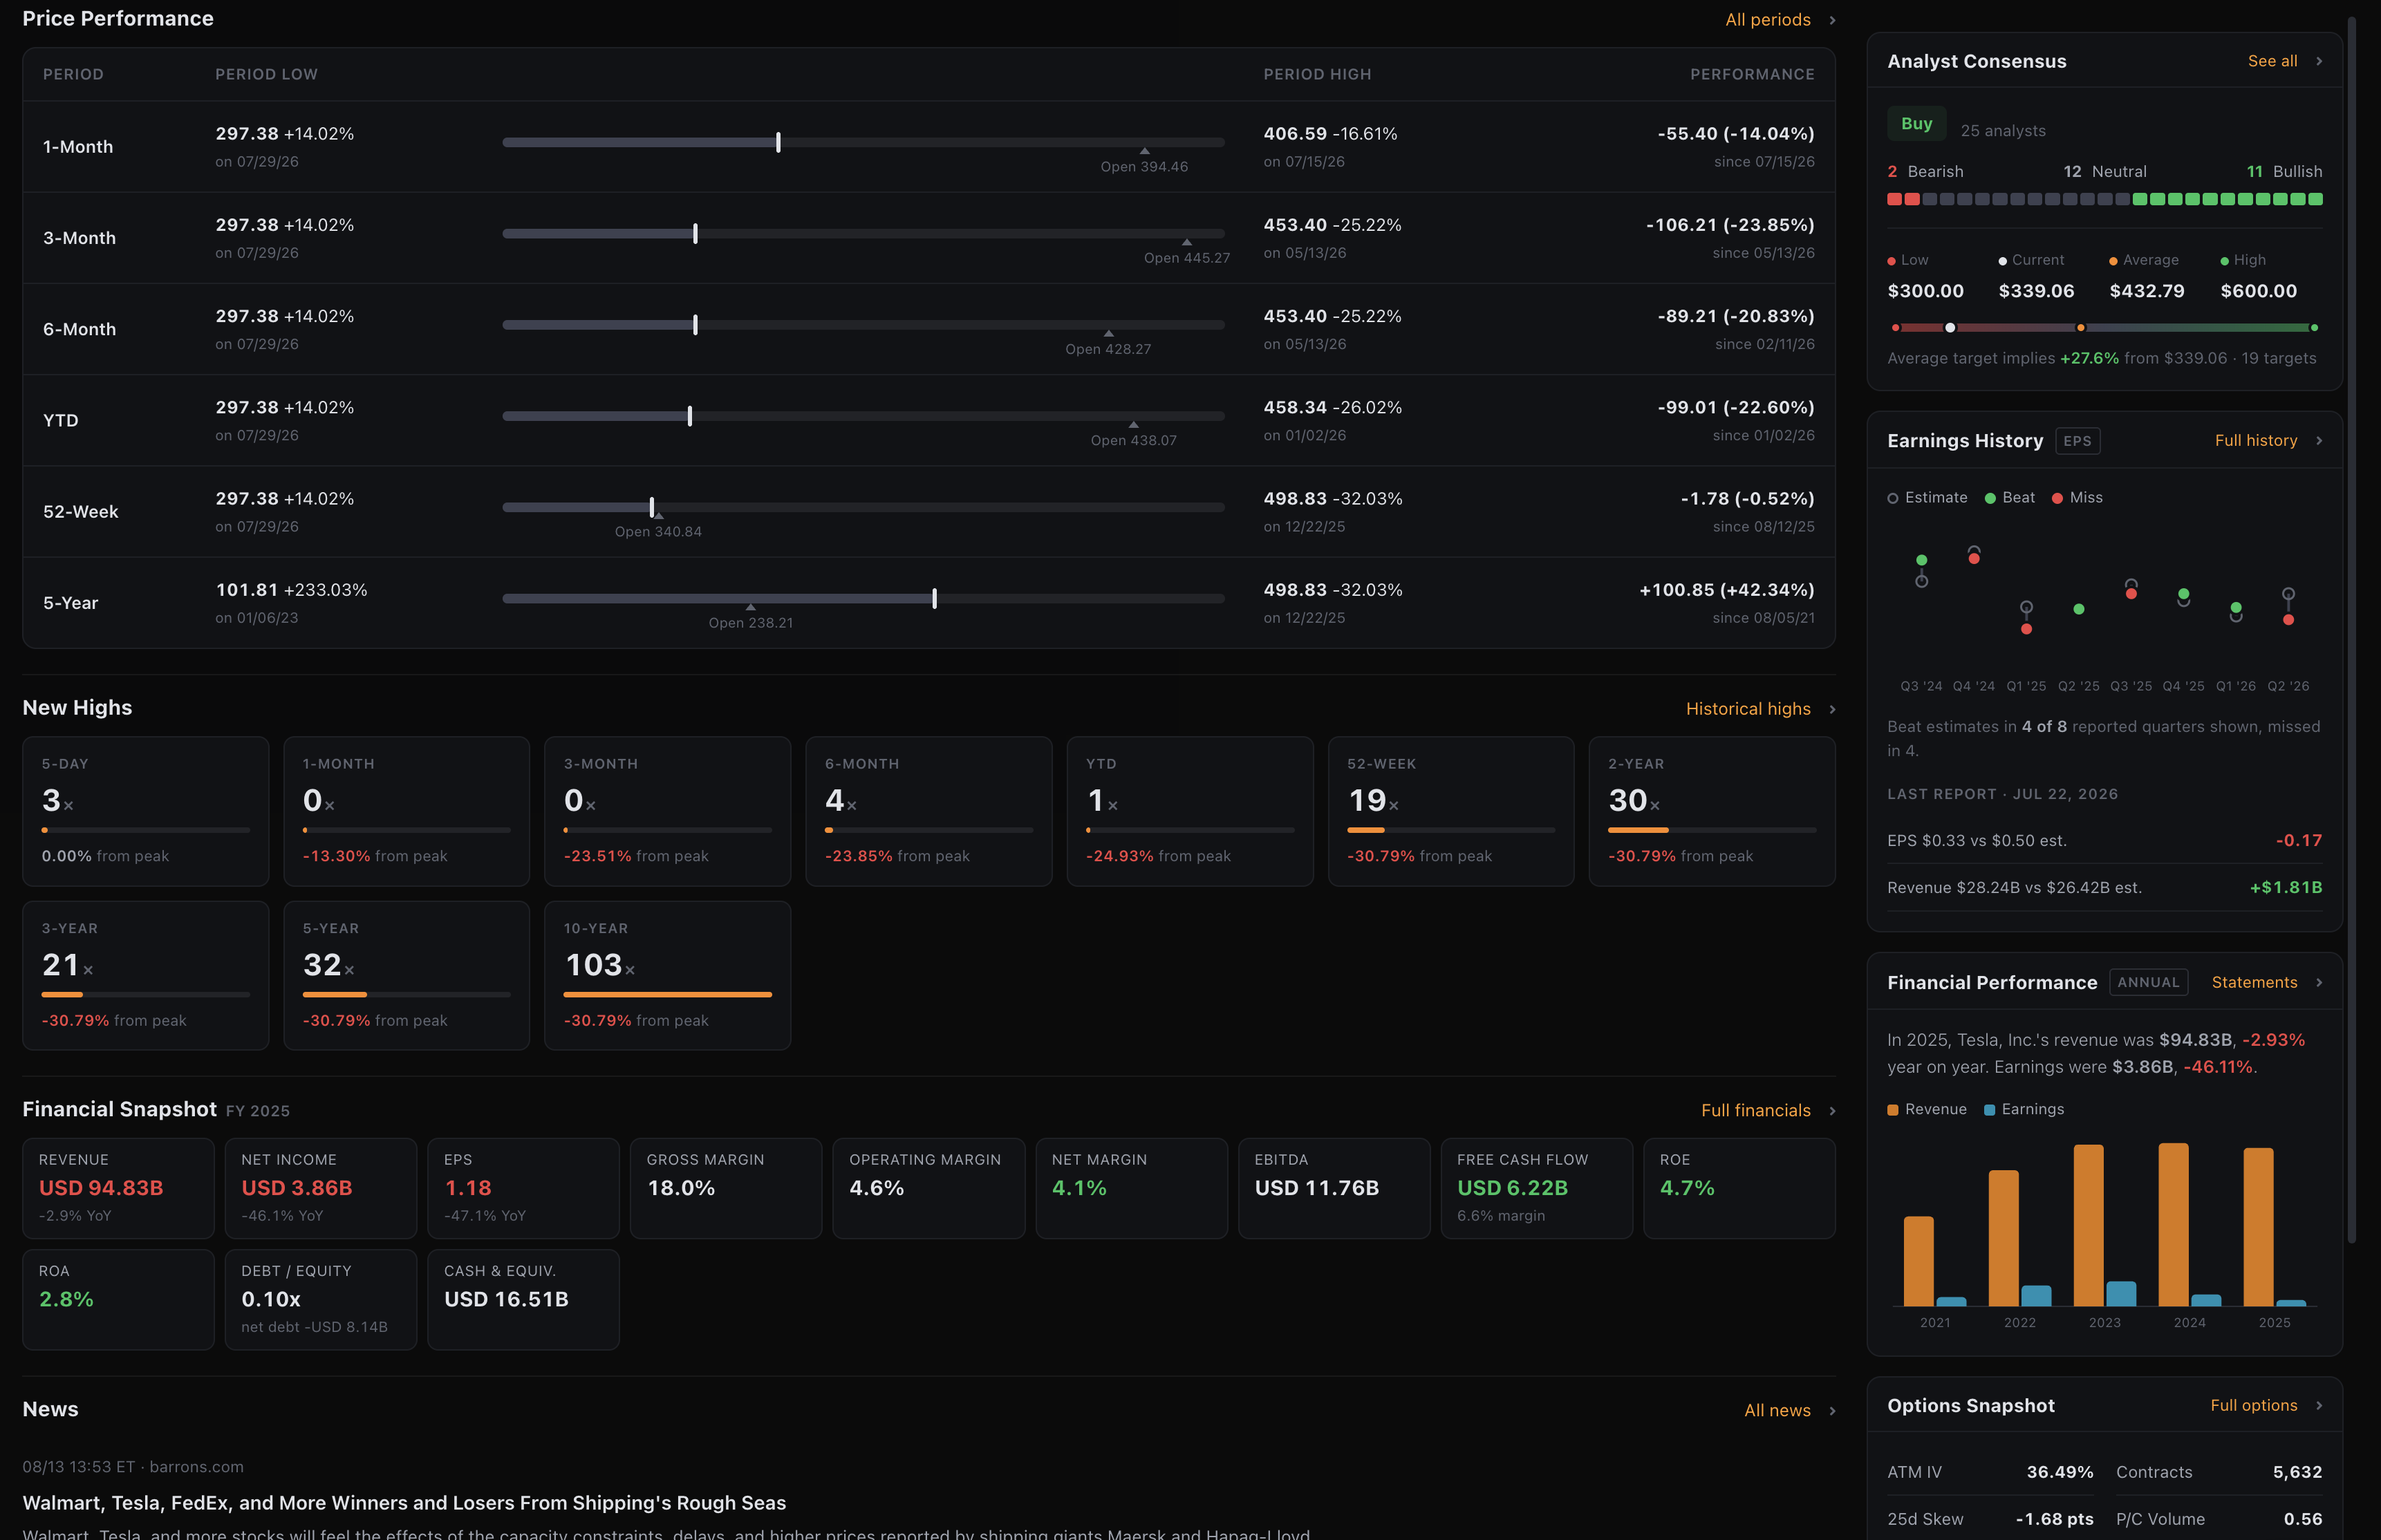
KlickAnalytics now brings price performance, analyst expectations, earnings results, financial health, options data, and the latest news together in one streamlined view.
Quickly explore:
- Price performance across multiple periods, from one month to five years and beyond
- Period highs, lows, opening levels, total returns, and the current position within each range
- New-high frequency and distance from peak across multiple timeframes
- Analyst recommendations, including bullish, neutral, and bearish ratings
- Analyst price targets, including low, average, and high estimates with implied upside or downside
- Earnings history, including EPS and revenue beats or misses
- A financial snapshot covering revenue, net income, EPS, margins, EBITDA, free cash flow, ROE, ROA, debt, and cash
- Annual financial performance trends
- Key options-market metrics and activity
- The latest company news and market developments
With the new information sidebar, essential intelligence is always visible alongside price performance—helping you understand how a symbol has performed, what analysts expect, how the company is executing, and what the market may be pricing in.
One symbol. One view. A more complete investment picture.
To access: Search for any symbol say TSLA, and you will see the information on the symbol overview page.
The Global Symbol Search...
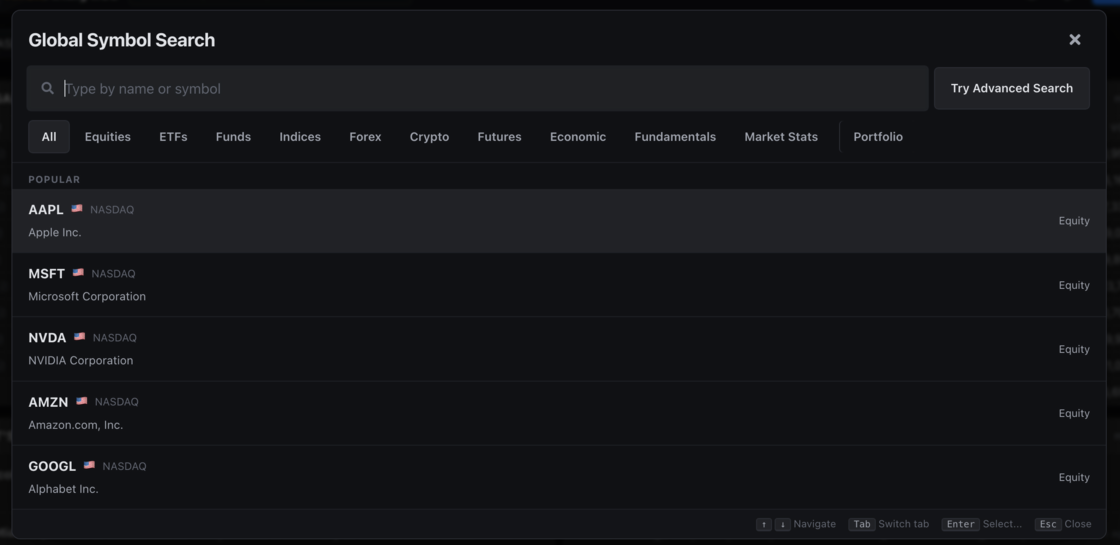
The new Global Symbol Search makes it faster to find and access instruments across the entire KlickAnalytics platform.
Search by symbol or company name, browse by asset class, and quickly jump into equities, ETFs, funds, indices, forex, crypto, futures, economic data, fundamentals, market stats, and portfolio tools—all from one unified search experience.
With popular results, tab-based filtering, and an optional Advanced Search, users can discover the exact symbol or dataset they need in seconds, making navigation across global markets much more efficient.
Ask the market a question. Get a calculated answer.
The AI is not a chatbot bolted onto a document store. It calls the same analytics engine that powers every screen on this platform — so what comes back is a number it computed from raw history, with the command that produced it.
86,000+ instruments
Global equities, ETFs, funds, options, FX, commodities, crypto, economics, filings, transcripts and news — one normalised symbol universe with adjusted history.
A real analytics engine
Screening, backtesting, technicals, options analytics, correlations, seasonality and factor models — computed on demand from raw prices, never a stale cache.
It shows its working
Answers arrive with the charts, tables and tool calls behind them, so you can check the number instead of trusting a paraphrase.
Your own documents
Upload filings, decks and research. Ask across them and the answer cites the page it came from.
Agents and workflows
Multi-step research that runs the platform's tools for you — screen, pull the history, compute, compare, then write it up.
MCP, CLI and API
The same command catalogue from Claude, your own agent, a shell or your pipeline. The answer on screen is the answer your job gets at 4am.
You ask
“How does NVDA usually trade through earnings?”
It calls
→ ka.options_expected_move(NVDA)
It answers
NVDA has averaged a 9.2% absolute move on the day after earnings and closed higher 67% of the time. Two in three reactions land between −4.2% and +16.3% — the distribution is skewed right, not symmetric.
Every figure computed live from our own history — not scraped, not summarised.
Or start with