What's New
Product updates, improvements and fixes across the KlickAnalytics platform.
142 updates · clear
View top trending symbols
Stay ahead of the game with our dynamic KlickAnalytics engine! This cutting-edge tool keeps a constant eye on the market, sifting through the latest market news and price fluctuations. The result?
View on symbols and companies making significant price moves and grabbing headlines. With this powerful resource at your fingertips, you'll unlock a world of trading opportunities and more. Don't miss out on the chance to seize the day in the market!
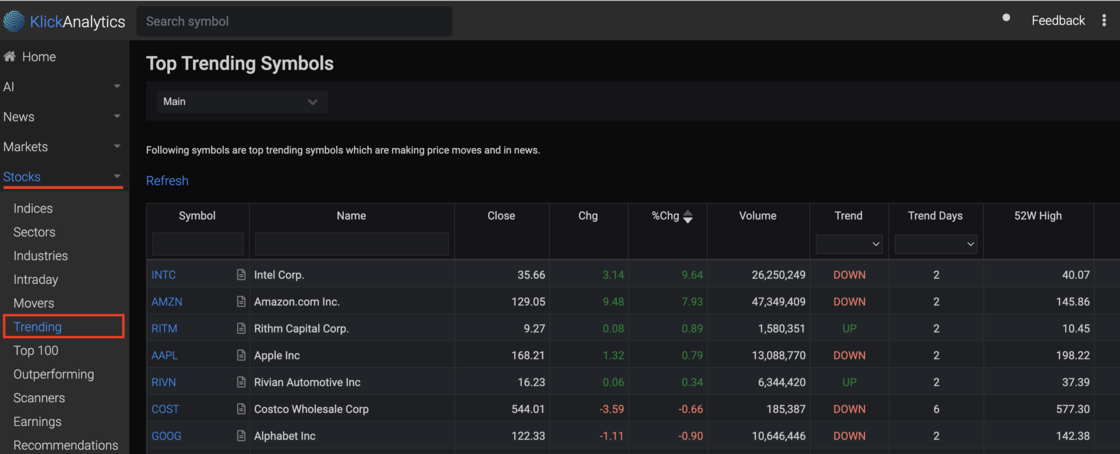
The data updates on every 10mins interval.
To view:
From the left menu, click on Stocks > Trending
View all data news by a symbol
Experience the dynamic pulse of 'Data News' as it delves deep into the latest market happenings, crafting engaging articles through the ingenious automation of KlickAnalytics' data-driven content engine.
Now our users can view all the 'Data News' related any global symbol via our new app called 'Symbol Data News'
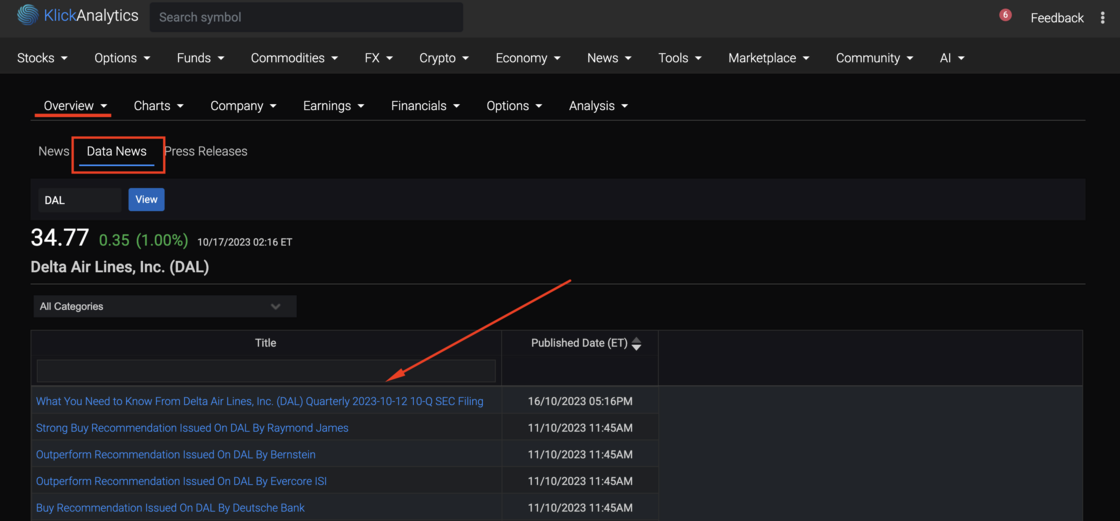
To view:
Search for any symbol, say DAL then click on dropdown Overview > News > Data News
Added coverage of Dubai - DFM Markets
KlickAnalytics vision is to provide global financial markets information.
Today, we've added the first exchange in the Middle East i.e.
Dubai Financial Markets - DFM.
Users can access price related information on following instruments traded on DFM markets;
- Stocks
- Funds
- REITs
- Exchange Traded Funds (ETFs)
- and much more.
All the symbols traded in DFM ends with .DFM e.g. The code for Dubai Financial Markets symbol will be (DFM.DFM)
More and more global exchanges will be coming soon to KlickAnalytics.com platform soon..
For more information;
Try Price Performance on DFM.DFM
We've start our crowd funding campaign
We are 'testing the waters' to gauge investor interest in an offering under Regulation Crowdfunding. No money or other consideration is being solicited. If sent, it will not be accepted. No offer to buy securities will be accepted. No part of the purchase price will be received until a Form C is filed and only through Wefunder’s platform. Any indication of interest involves no obligation or commitment of any kind.
For investment opportunities:
Checkout https://wefunder.com/klickanalytics/
Explore Best/Worst Hours of trading
We've added a new app called 'Best/Worst Hours' which looks at intra-day prices for an equity instrument, and then calculate the performance of stock prices within 1 hour interval from 9:20am ~ 4:00pm New York Trading time.
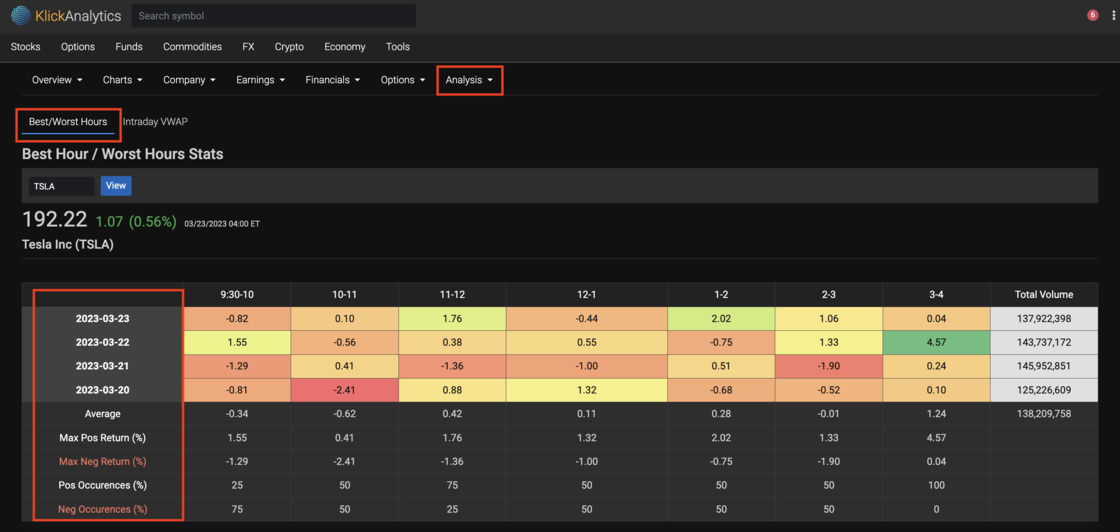
The new updates will give our users a quick ability to visualize the latest intra-day performances within each 1 hour interval of trading, along with stats like;
- Maximum/Minimum Positive and Negative returns
- # of Positive/Negative occurrences and more.
To access: Search for an instrument say TSLA, then from symbol menu, select Analysis > Intra-day > Best/Worst Hours
View all 'confirmed earnings'
We've added a new app where you can view all the 'confirmed earnings' by all companies.
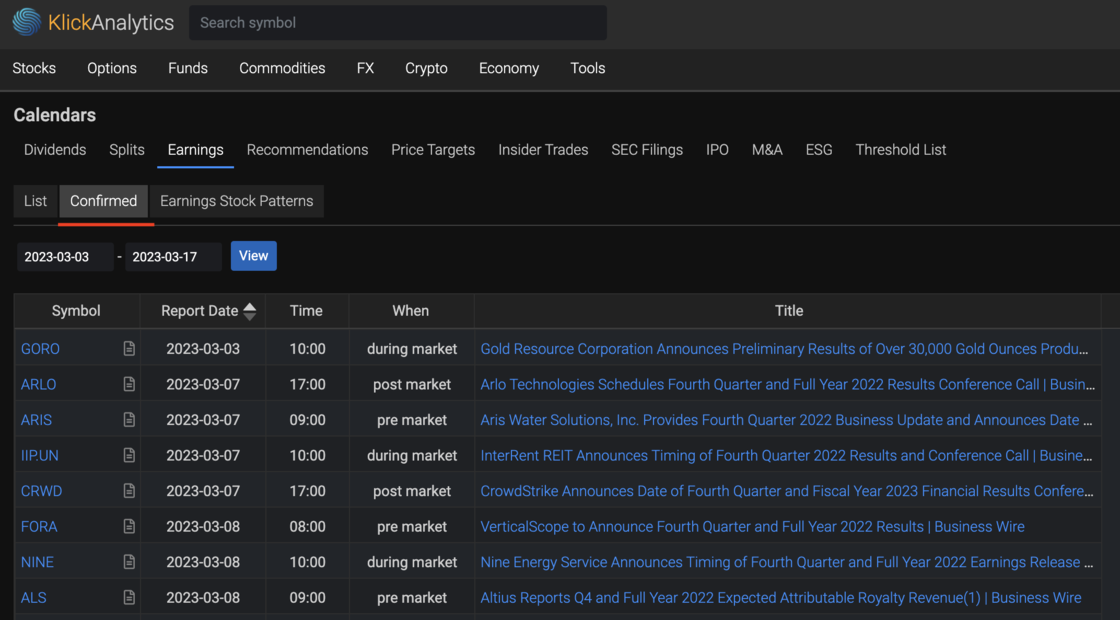
To access: From the top menu, select Stocks > Calendar > Earnings > Confirmed
View company notes due!
We've added a new coverage for providing information on a 'Company Notes Due' at KlickAnalytics.com
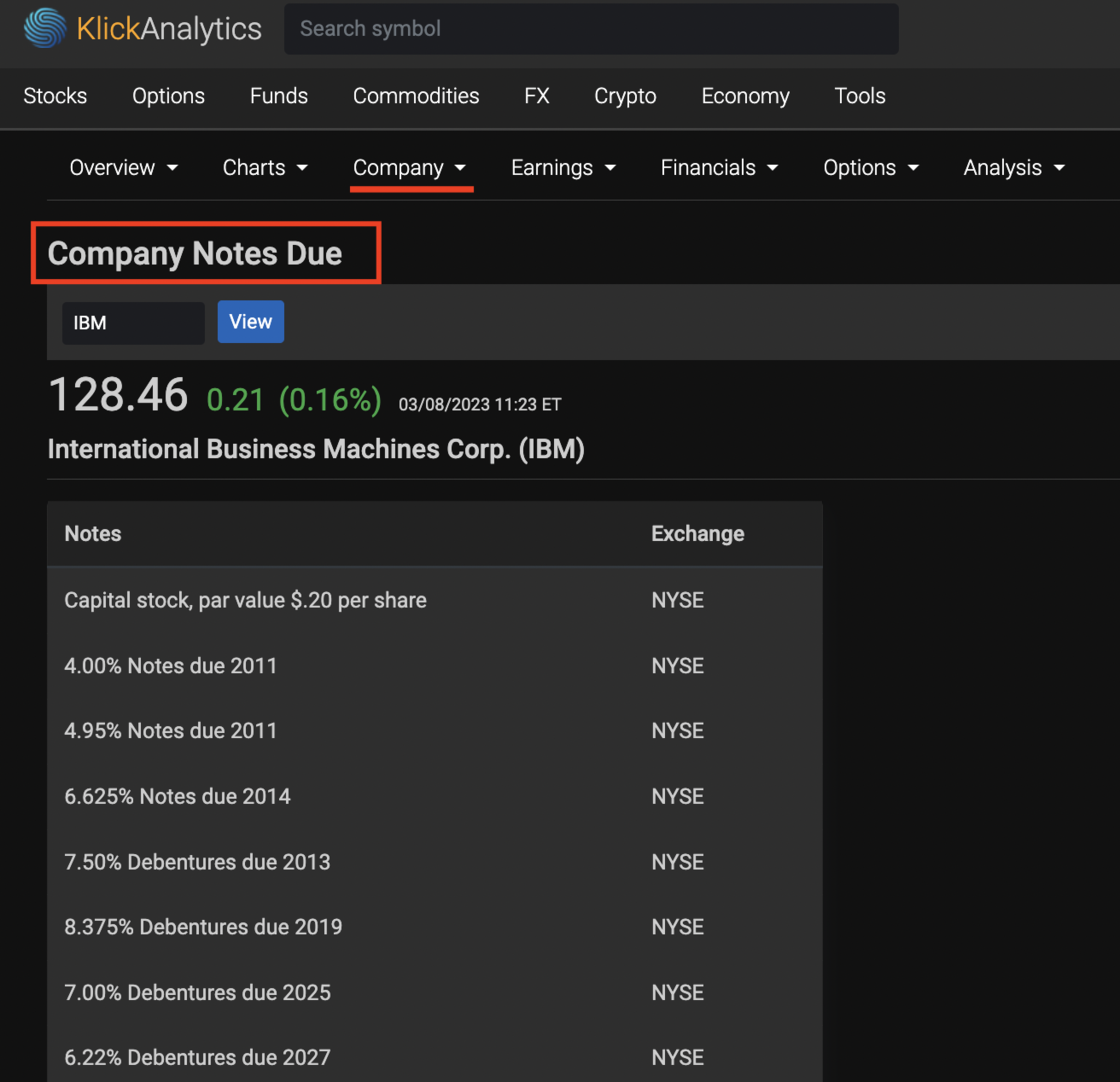
To access: Search any listed company say IBM, then from the symbol menu, select company > Notes Due
View normalized sector performances
We've enhanced our sector performance application, where our users can view historical normalized sector performances for all major US sectors.
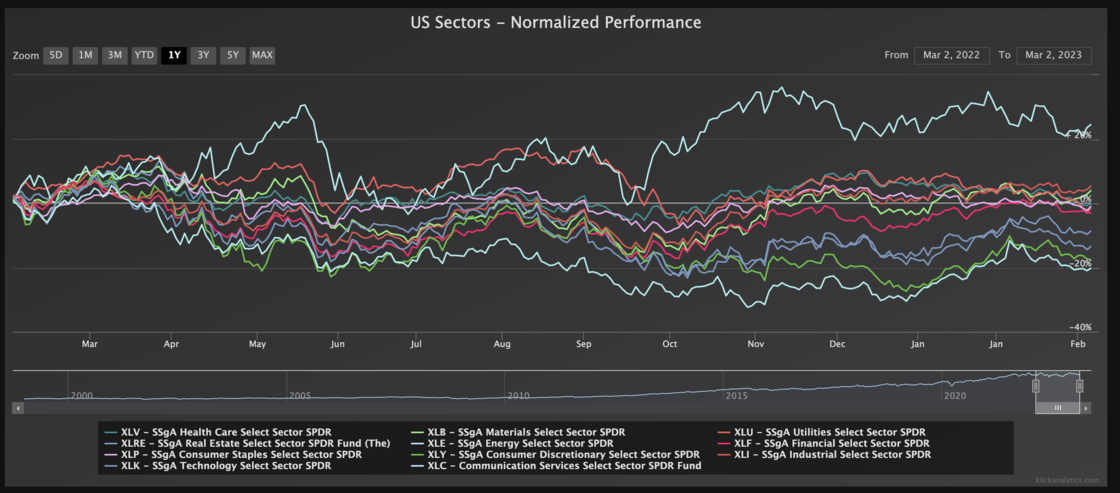
This will allow our users to quickly compare sectors together, and also how different sectors are trending across time as well.
To view: From the top menu, click on Stocks > Indices > Sectors
Access all financial calendars at one place
Now you can access all the financial calendars in one place via our 'Calendar' app. The calendar app will allow you to view;
- Dividends
- Splits _ Earnings
- Analyst Recommendations
- Price Targets
- Insider Trades
- SEC Filings
- IPOs
- ESG
- Threshold List
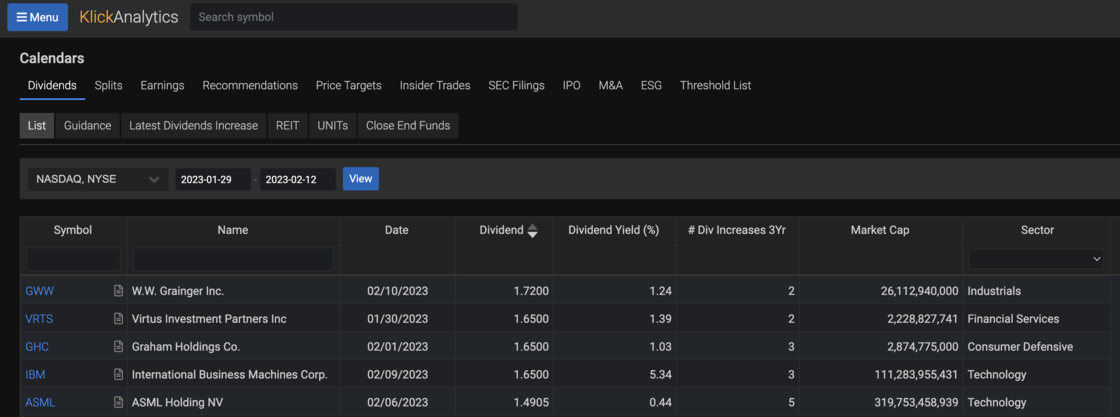
To access: From the top menu, click on 'Calendar'
Access Markets via Chart Browser
Chart Browser will allow you to view historical chart performance on global symbols. You can access the symbols from;
- Major Market Groups like SPDR Sectors, Major Commmodities etc
- Symbols from your watchlist and more
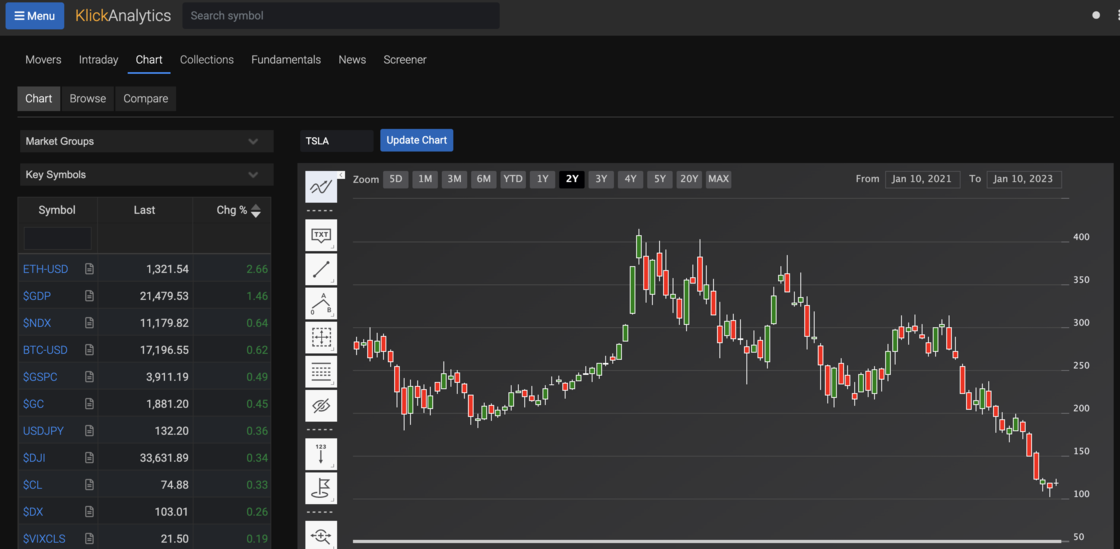
This way our users can analyze global symbols performance at a glance, all from a single app called 'Chart Browser'
To access: From the 'Menu' button, click on Movers > Chart
Ask the market a question. Get a calculated answer.
The AI is not a chatbot bolted onto a document store. It calls the same analytics engine that powers every screen on this platform — so what comes back is a number it computed from raw history, with the command that produced it.
86,000+ instruments
Global equities, ETFs, funds, options, FX, commodities, crypto, economics, filings, transcripts and news — one normalised symbol universe with adjusted history.
A real analytics engine
Screening, backtesting, technicals, options analytics, correlations, seasonality and factor models — computed on demand from raw prices, never a stale cache.
It shows its working
Answers arrive with the charts, tables and tool calls behind them, so you can check the number instead of trusting a paraphrase.
Your own documents
Upload filings, decks and research. Ask across them and the answer cites the page it came from.
Agents and workflows
Multi-step research that runs the platform's tools for you — screen, pull the history, compute, compare, then write it up.
MCP, CLI and API
The same command catalogue from Claude, your own agent, a shell or your pipeline. The answer on screen is the answer your job gets at 4am.
You ask
“How does NVDA usually trade through earnings?”
It calls
→ ka.options_expected_move(NVDA)
It answers
NVDA has averaged a 9.2% absolute move on the day after earnings and closed higher 67% of the time. Two in three reactions land between −4.2% and +16.3% — the distribution is skewed right, not symmetric.
Every figure computed live from our own history — not scraped, not summarised.
Or start with