What's New
Product updates, improvements and fixes across the KlickAnalytics platform.
Historical Seasonality by Years/Months
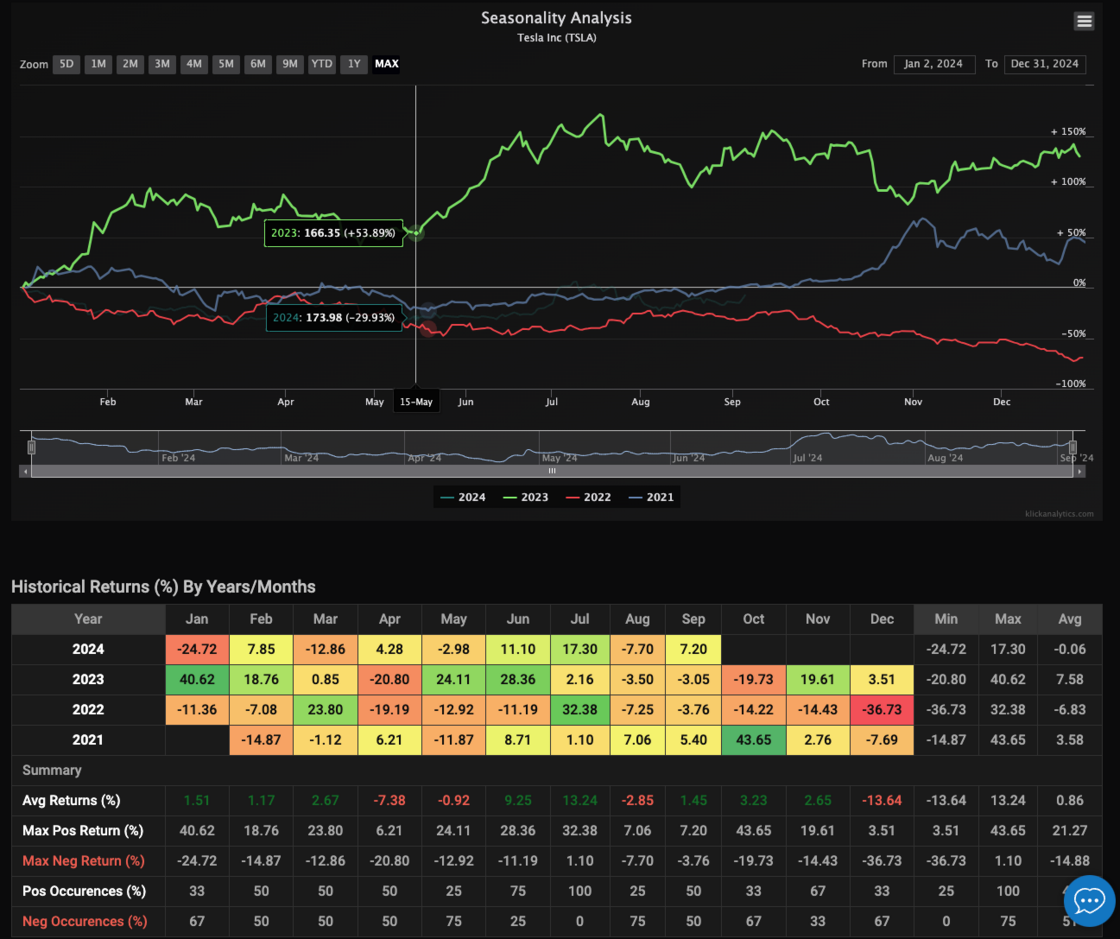
To enhance your experience and make data analysis more intuitive, we’re introducing several exciting product updates based on the historical returns table. First, we’re transforming the returns table into an interactive heatmap. This new feature will allow you to visually assess performance trends at a glance. By simply hovering over any month, you’ll gain immediate access to exact return values and year-on-year comparisons for that period, providing deeper insights without navigating through multiple screens.
Additionally, we’re introducing a new comparison tool where you can highlight or pin specific years, such as 2021, 2022, or 2023, for direct side-by-side analysis. This will make it easier for you to identify seasonal trends or significant performance shifts between years, helping you focus on the data that matters most to you. These updates are designed to make your workflow smoother and more efficient, empowering you to make well-informed decisions based on historical data trends.
To access: Search for any symbol say TSLA, from the top menu, select Analysis > Seasonality
"Today" Screen: Your Global Market Snapshot at a Glance
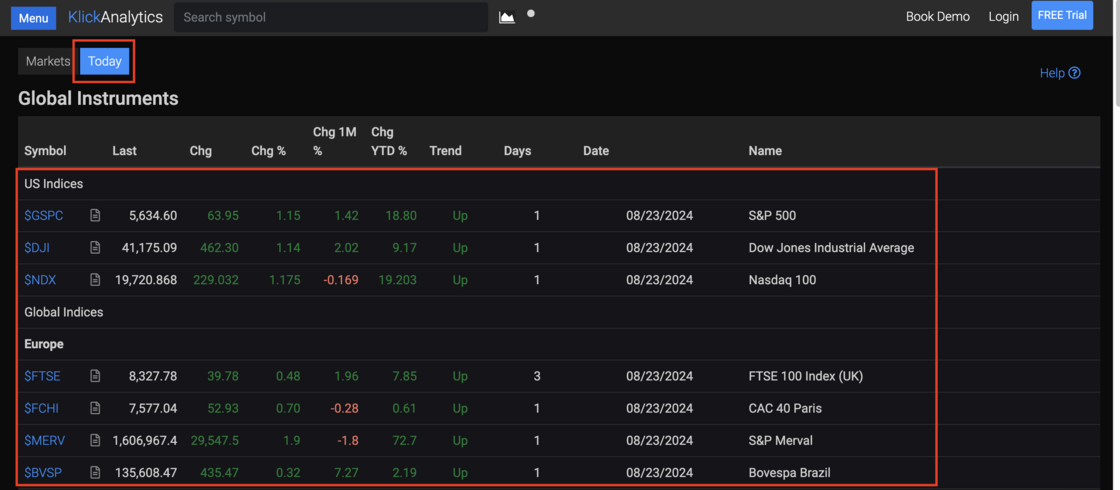
🚀 New Feature Release: "Today" Screen
We are excited to announce the launch of our new "Today" screen, now available on the main page of your home dashboard! This new feature provides a comprehensive, real-time overview of major global instruments, including indices, cryptocurrencies, currencies, major ETFs, and much more.
With the "Today" screen, you can effortlessly stay informed with a quick glance at the world's most important financial instruments, all in one place. This enhancement is designed to help you make informed decisions faster and with greater ease.
Stay ahead of the markets with our latest update!
To access: Click Menu > Home > Today
Quick Chart Access
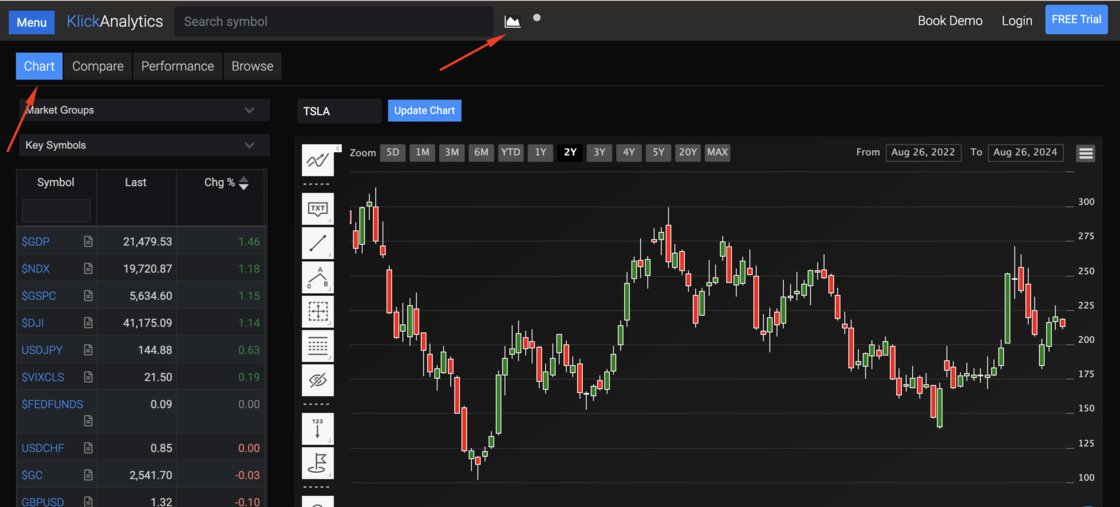
We are thrilled to introduce a powerful new feature designed to enhance your trading experience! You can now instantly access our comprehensive charting tool with just a single click of the chart icon located on the top menu. This streamlined access allows you to quickly dive into market movers, explore key instruments, or even browse through your personalized watchlist—all in one place! Whether you're analyzing trends or tracking your favorite assets, this new feature puts the tools you need right at your fingertips, making your market analysis faster and more efficient than ever before!
Filters movers by marketcap
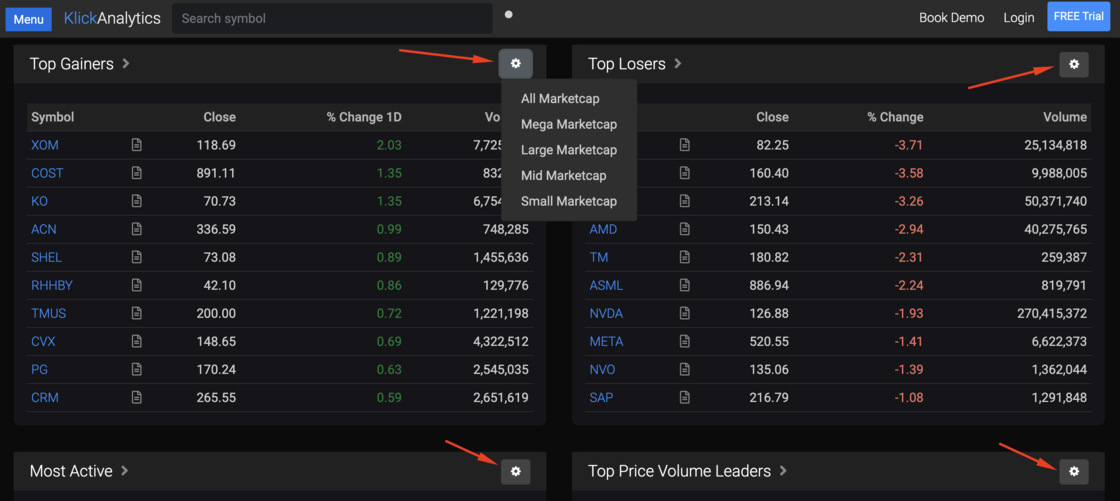
We've enhanced our main page to provide users with the ability to filter top gainers, losers, most active stocks, and top price volume leaders by market capitalization. The available market cap filters include:
- All Market Cap
- Mega Market Cap
- Large Market Cap
- Small Market Cap
This enhancement enables users to view overall market movers based on specific market cap categories.
Introducing Enhanced Economic Calendar with Advanced Filtering and Visual Highlights
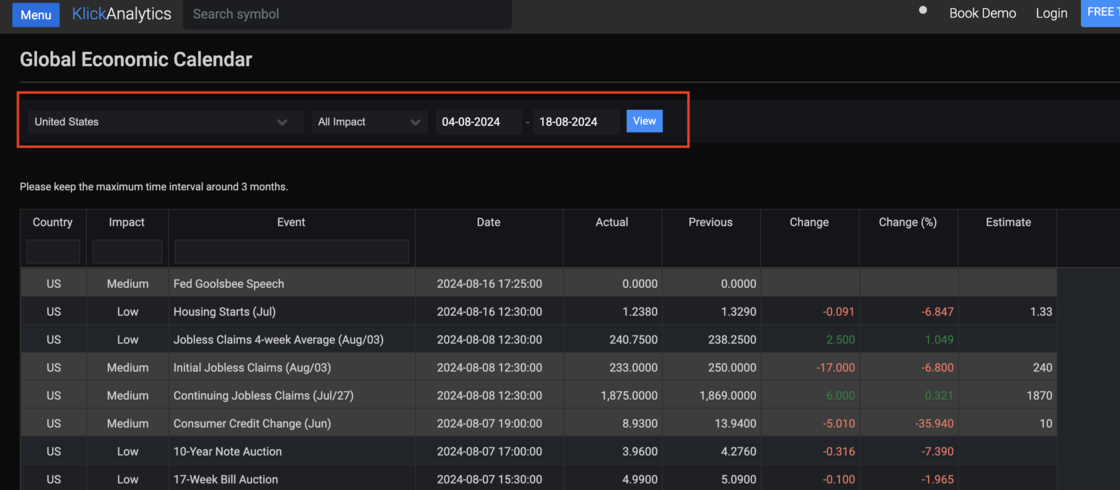
We are excited to announce enhancements to our Economic Calendar, designed to provide you with a more powerful and intuitive experience. With these updates, you can now:
Filter by Country: Easily narrow down economic indicators to specific countries. Also the drop down filter will place all the popular countries at first for an easy pickup.
Impact Type Filtering: Sort events by their impact level—High, Medium, or Low.
Date Range Filtering: Focus on events occurring within a specific timeframe.
Visual Distinction: Instantly recognize high-impact events with rows highlighted in orange, while medium and low-impact events remain distinct.
Additionally, we've introduced a robust search feature, allowing you to quickly find any country, impact level, or event name. These improvements make it easier than ever to stay on top of all the key economic events at a glance.
To access: Click "Menu" on the top left right hand side corner, then select Economy > Calendar
New "Menu" icon
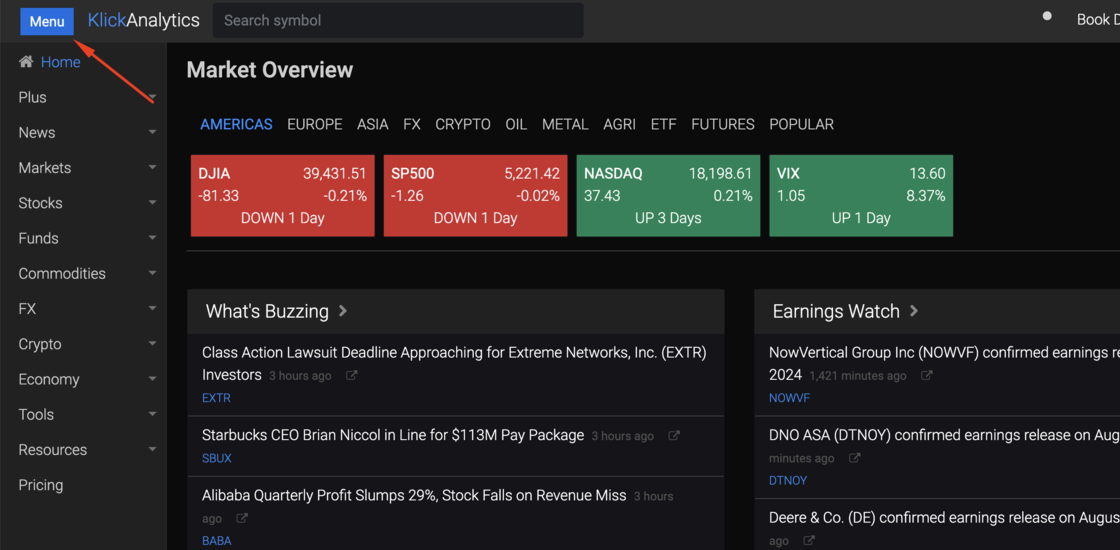
To enhance your navigation experience, we've introduced a convenient "Menu" button located at the upper left corner of the screen. This button allows you to easily show or hide the menu, giving you quick access to all the applications and research tools we offer.
Access Historical Stock Prices by Week, Quarter, and Year!
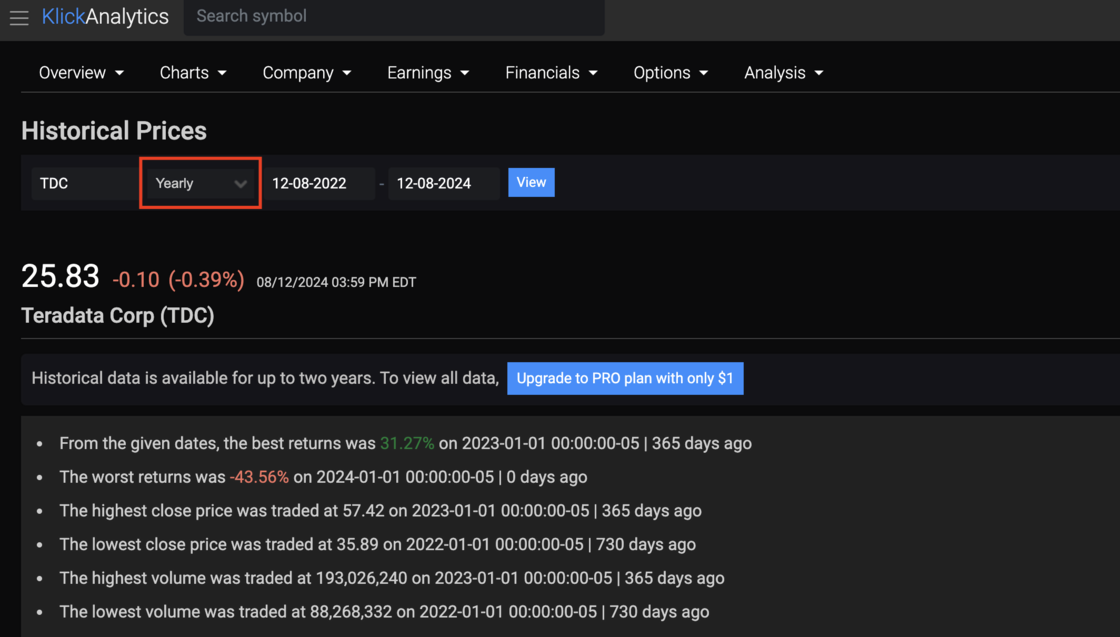
We’re thrilled to introduce a new feature that allows you to view historical stock prices with greater flexibility and detail. Starting today, you can access price data for any stock on a weekly, quarterly, and yearly basis.
Here’s what you can do with this feature:
Weekly Data: Track short-term price movements and market trends on a weekly basis to fine-tune your trading strategies.
Quarterly Data: Analyze stock performance across each fiscal quarter to assess seasonal trends and company performance.
Yearly Data: Review long-term price trends and annual performance to better understand the stock’s overall trajectory.
Benefits:
Informed Decision-Making: Use detailed historical data to make well-informed investment decisions based on various timeframes.
Trend Analysis: Identify and analyze price trends over different periods to forecast future movements more accurately.
Improved Strategy: Adjust your investment strategies with a clearer understanding of how stocks perform over different intervals.
To access: search for any symbol say TSLA, and then from the top menu, select Overview > Prices
Improved Earnings Call Transcript display
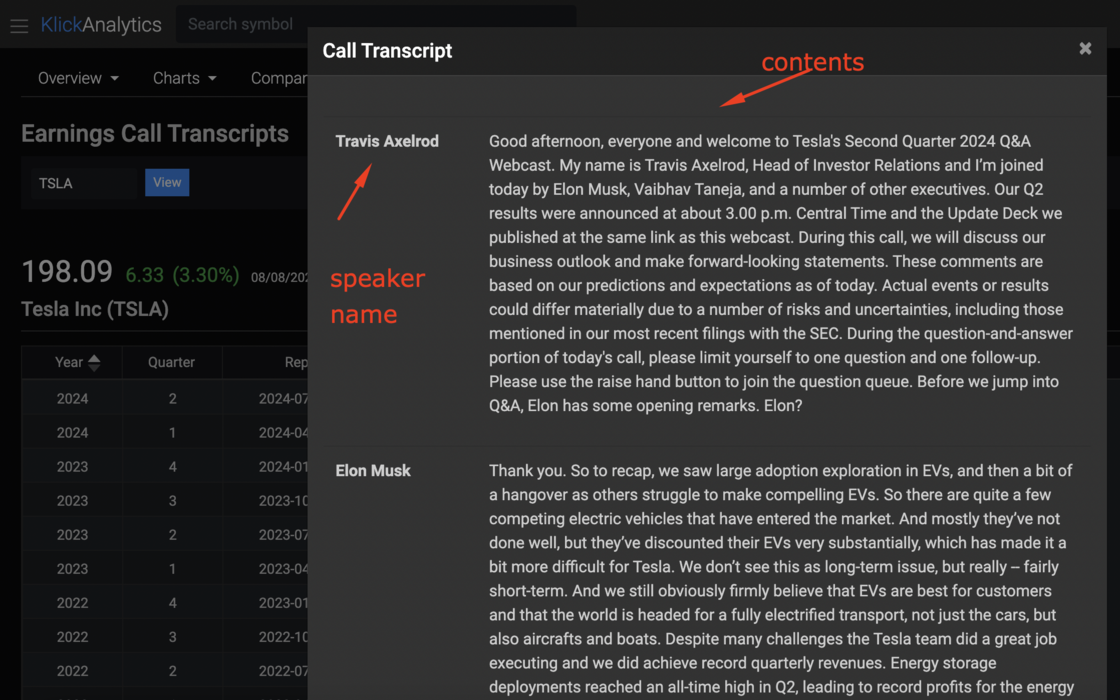
Introducing our enhanced call transcript display—designed to elevate your experience! Now, you can easily see each speaker's name alongside their exact words, all in a clear, side-by-side format. This improvement not only boosts readability but also allows you to follow conversations more effortlessly. Whether you're analyzing market insights or just staying informed, our upgraded feature ensures you never miss a beat. Try it now and experience the difference!
To access: Search for any company say 'TSLA' then click on top menu > Earnings > Call Transcripts
Review Key Financial Metrics for companies!
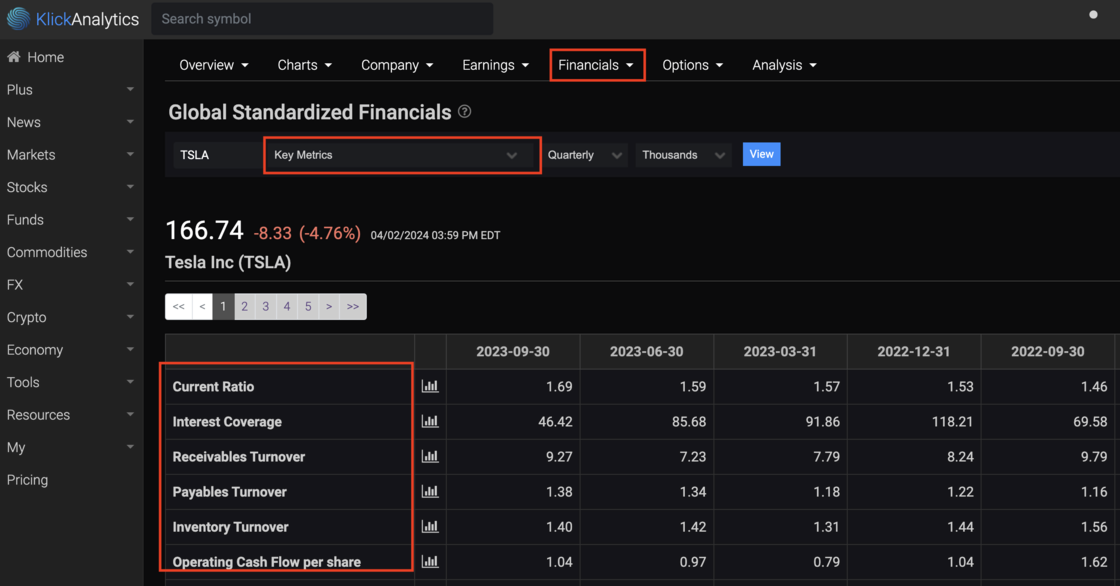
We have added the enhancements to our financial statement analysis tool, where a used can view and analyze key financial metrics like cash ratios, inventory turnover, capex numbers, and other data tags based on quarterly and annual data, along with the ability to draw them in charts and review historical time series.
To access: Search for any company, say TSLA, and then from the symbol menu, select Financials > Fundamentals > Select Key Metrics from the drop down list.
Explore companies financial key metrics and trends!
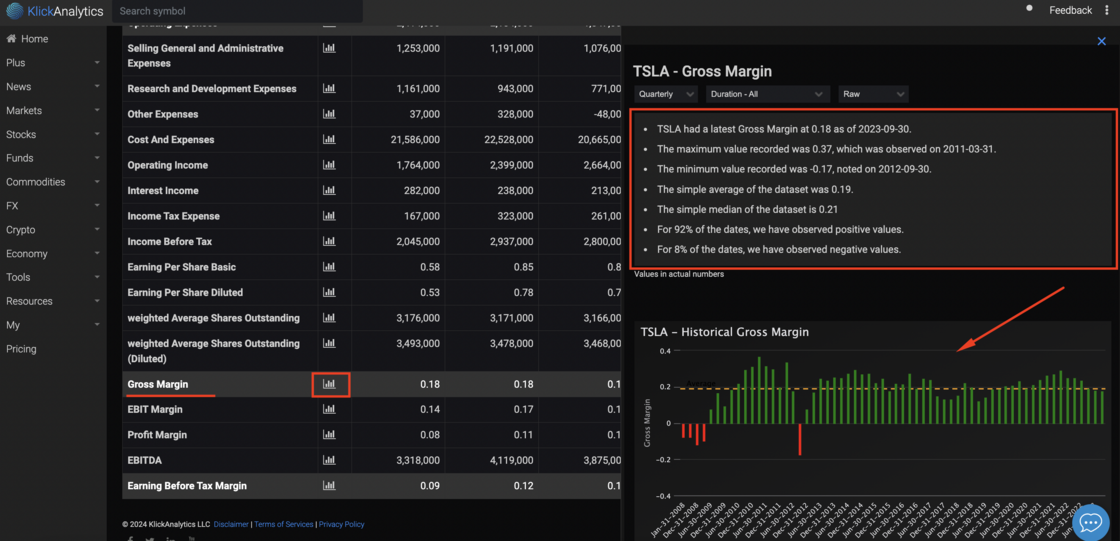
In response to user feedback and evolving industry standards, we're excited to introduce new features and enhancements to our financial statement analysis application. These updates are designed to provide users with more comprehensive insights, improved usability, and enhanced visualization capabilities.
1. Expanded Line Item Analysis:
Users can now view a wide range of financial statement line items such as gross margins, operating expenses, net income, and more. This expanded coverage allows for a deeper understanding of key financial metrics crucial for decision-making.
2. Historical Trends:
Our application now offers historical trend analysis, enabling users to track the performance of selected line items over time. From quarterly to annual views, users can identify trends, spot anomalies, and make informed projections based on past performance.
3. Flexible Observation Filters:
To cater to diverse analytical needs, users can filter observations based on customizable timeframes ranging from the last 3 months to the last 12 months or view all available data. This flexibility allows for focused analysis and quick comparisons across different periods.
4. Key Statistics:
We've introduced a new feature that provides users with key statistics for selected line items. From mean and median values to standard deviations and percentiles, users can gain deeper insights into the distribution and variability of financial data.
5. Enhanced Visualization:
A new historical bar chart visualization has been added to the application, allowing users to visualize positive and negative values over time. This dynamic visualization helps users identify trends, patterns, and outliers at a glance, enhancing the interpretability of financial data.
Conclusion:
With these updates, our financial statement analysis application empowers users to conduct comprehensive analyses, uncover valuable insights, and make well-informed decisions. We remain committed to continuously improving our platform to meet the evolving needs of our users and provide them with the tools they need to succeed in financial analysis.
To access: Search for a company say TSLA, then from the symbol menu, select Financials > Fundamentals > and then click on any of the chart icon against any line item like Gross Margin to view the analysis.
Ask the market a question. Get a calculated answer.
The AI is not a chatbot bolted onto a document store. It calls the same analytics engine that powers every screen on this platform — so what comes back is a number it computed from raw history, with the command that produced it.
86,000+ instruments
Global equities, ETFs, funds, options, FX, commodities, crypto, economics, filings, transcripts and news — one normalised symbol universe with adjusted history.
A real analytics engine
Screening, backtesting, technicals, options analytics, correlations, seasonality and factor models — computed on demand from raw prices, never a stale cache.
It shows its working
Answers arrive with the charts, tables and tool calls behind them, so you can check the number instead of trusting a paraphrase.
Your own documents
Upload filings, decks and research. Ask across them and the answer cites the page it came from.
Agents and workflows
Multi-step research that runs the platform's tools for you — screen, pull the history, compute, compare, then write it up.
MCP, CLI and API
The same command catalogue from Claude, your own agent, a shell or your pipeline. The answer on screen is the answer your job gets at 4am.
You ask
“How does NVDA usually trade through earnings?”
It calls
→ ka.options_expected_move(NVDA)
It answers
NVDA has averaged a 9.2% absolute move on the day after earnings and closed higher 67% of the time. Two in three reactions land between −4.2% and +16.3% — the distribution is skewed right, not symmetric.
Every figure computed live from our own history — not scraped, not summarised.
Or start with