What's New
Product updates, improvements and fixes across the KlickAnalytics platform.
View volume bands, min/max/averages and more...
We've enhanced our 'Unusual Volume' app to now include the following;
- User can view historical volume statistics
- The stats are displayed by Years and Month basis
- Stats includes, average price, min/max/average volume, standard deviations
- Volume bands to showcase values for 25%, 50% and 75% percentile of the volume distribution
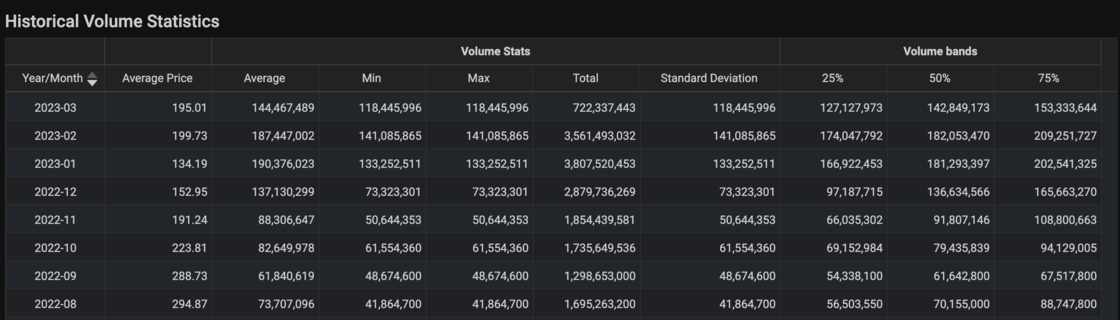
To access: Search for any global symbols say TSLA. From the symbol menu, select Analysis > Unusual Volume
View normalized sector performances
We've enhanced our sector performance application, where our users can view historical normalized sector performances for all major US sectors.
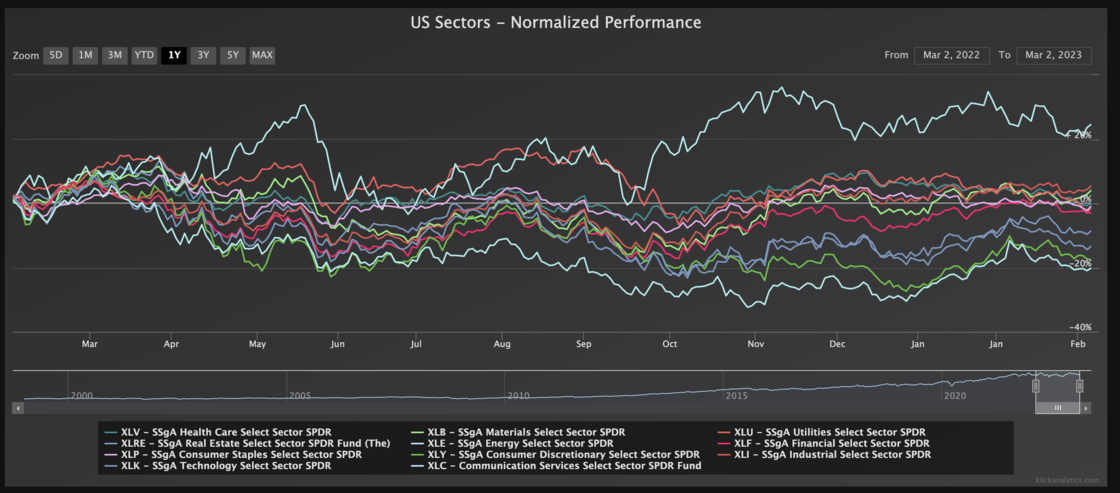
This will allow our users to quickly compare sectors together, and also how different sectors are trending across time as well.
To view: From the top menu, click on Stocks > Indices > Sectors
View historical volatility trends by month/year
We have enhanced our volatility application which now display;
- Historical volatility by months/years
- Provide full summary based on average, positive/negative returns by each month and dates
- Min/Max and average values by each year
The above will help our users to view the volatility trends across a time period for trade opportunities and more.
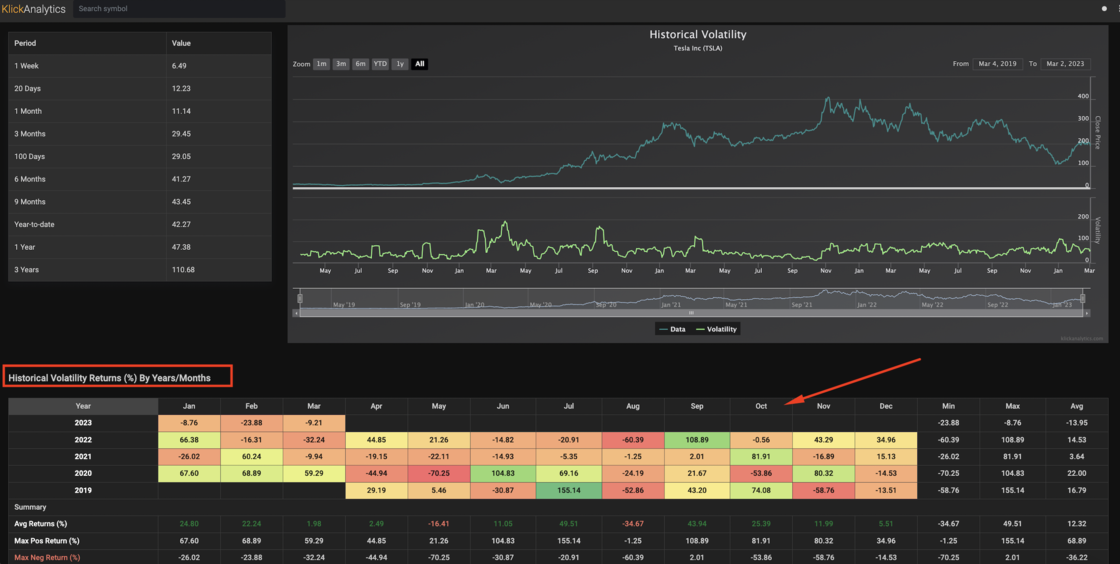
To view: Search for any global symbol, and then from the symbol drop down menu select Analytics > Volatility
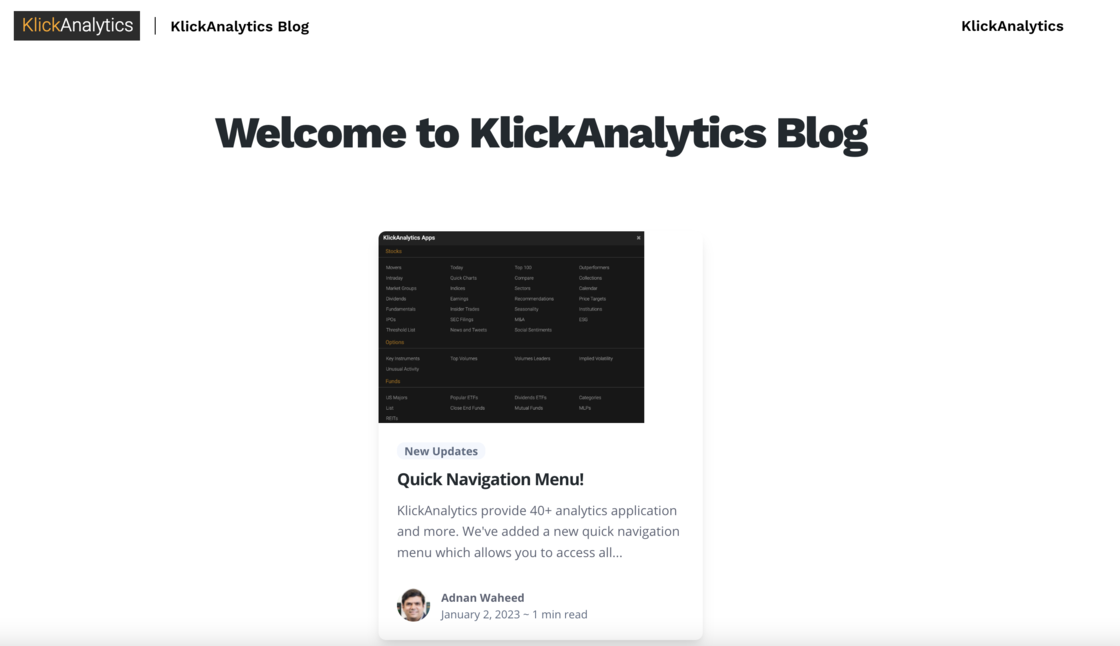
New Navigation!
KlickAnalytics is always updating new data, applications and much more. We've enhanced our product 'Navigation' system with the idea that our users;
- Can access all applications in an easy way
- You can access all multi-asset class application from the top menu bar
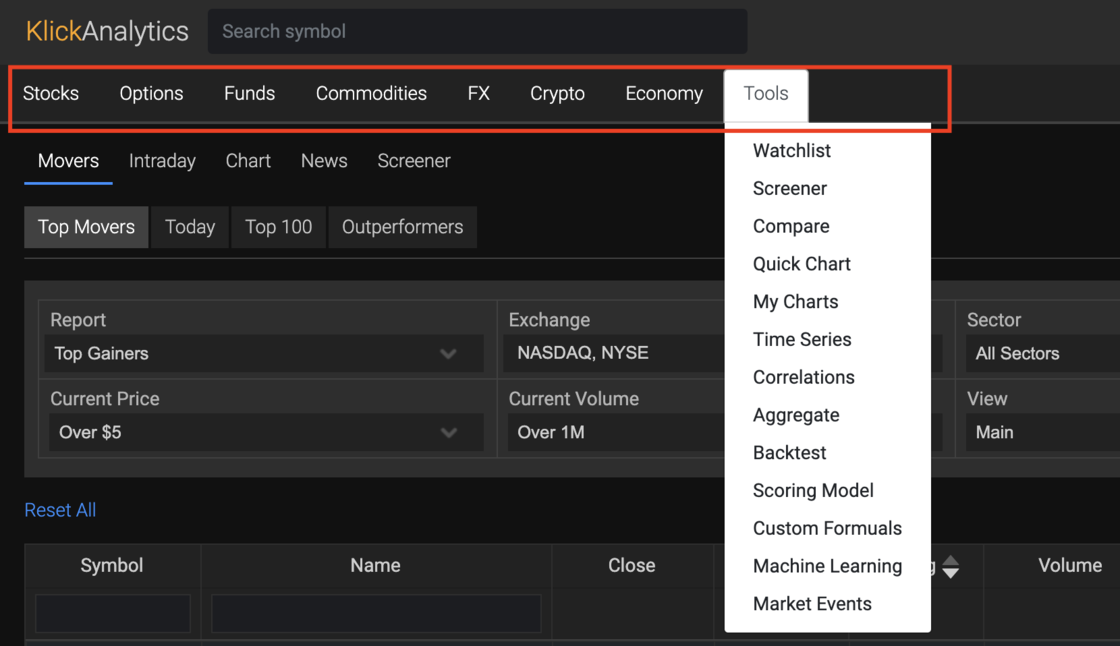
Just simply click on the top menu bar and access your application at once!
Access all financial calendars at one place
Now you can access all the financial calendars in one place via our 'Calendar' app. The calendar app will allow you to view;
- Dividends
- Splits _ Earnings
- Analyst Recommendations
- Price Targets
- Insider Trades
- SEC Filings
- IPOs
- ESG
- Threshold List
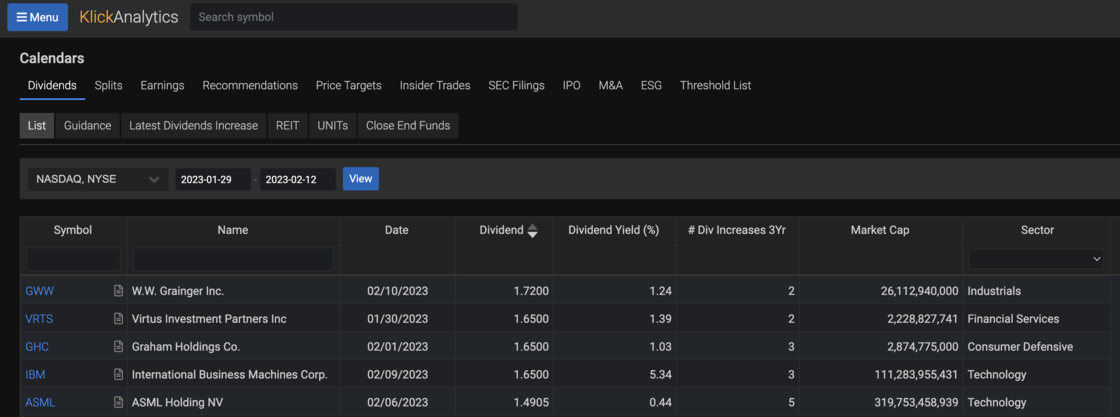
To access: From the top menu, click on 'Calendar'
Access Markets via Chart Browser
Chart Browser will allow you to view historical chart performance on global symbols. You can access the symbols from;
- Major Market Groups like SPDR Sectors, Major Commmodities etc
- Symbols from your watchlist and more
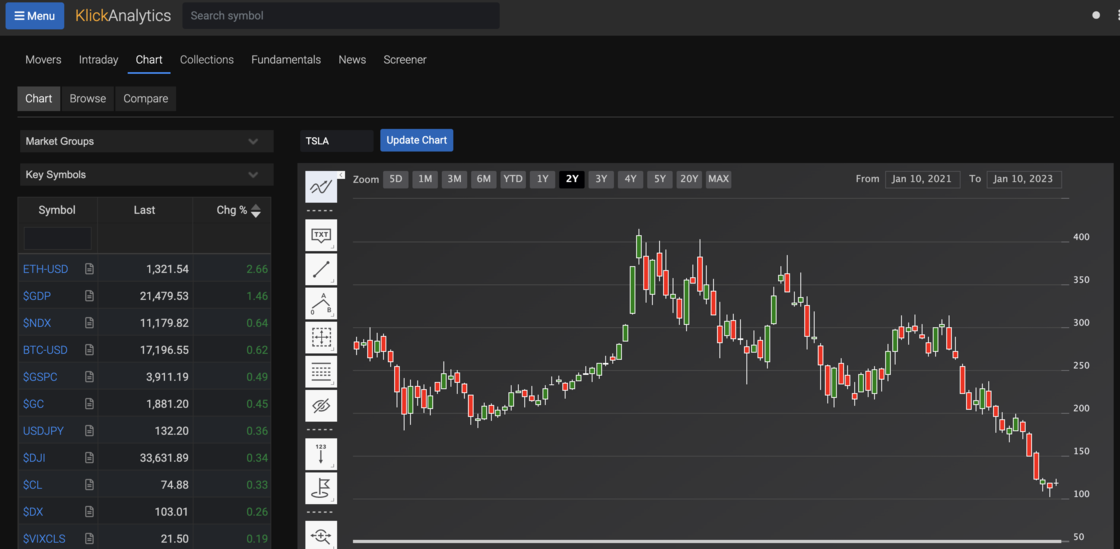
This way our users can analyze global symbols performance at a glance, all from a single app called 'Chart Browser'
To access: From the 'Menu' button, click on Movers > Chart
Quick support navigation menu
Our aim to to provide a simple, and dynamic interface to our users. With that in mind, we've updated our top menu with a simple drop down support menu.
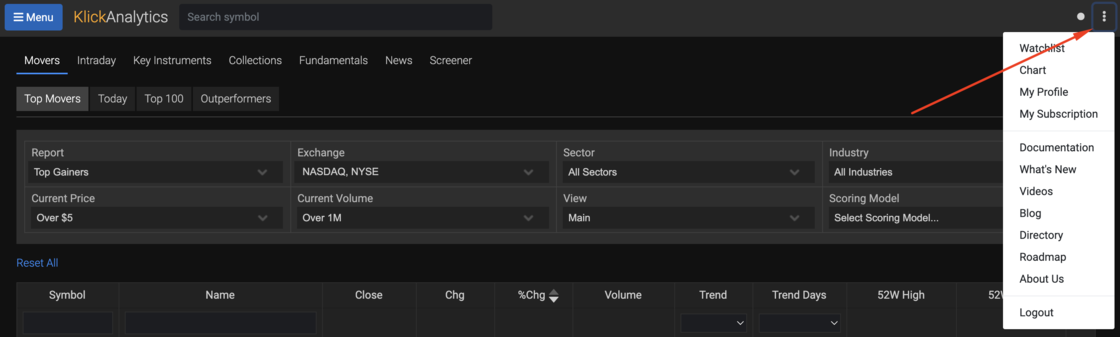
Once you logged-in to KlickAnalytics platform, you can access this menu, by going to the upper top right hand side corner and click on vertical ellipsis icon.
This single menu will allow you to quickly access to;
- Watchlist
- Chart
- Your profile
- Your Subscription
and in addition to above, provide important support documentation like;
- Main documentation
- What's New
- Blog
- Directory of all symbols
- Our Roadmap
- About Us
- and logout
Quickly view all major key stats for a company
We've updated the main symbol quotes page to now include the following key stats on the following categories;
- Trading
- Fundamentals
- Revenues
- Dividends
- Shares
and more.
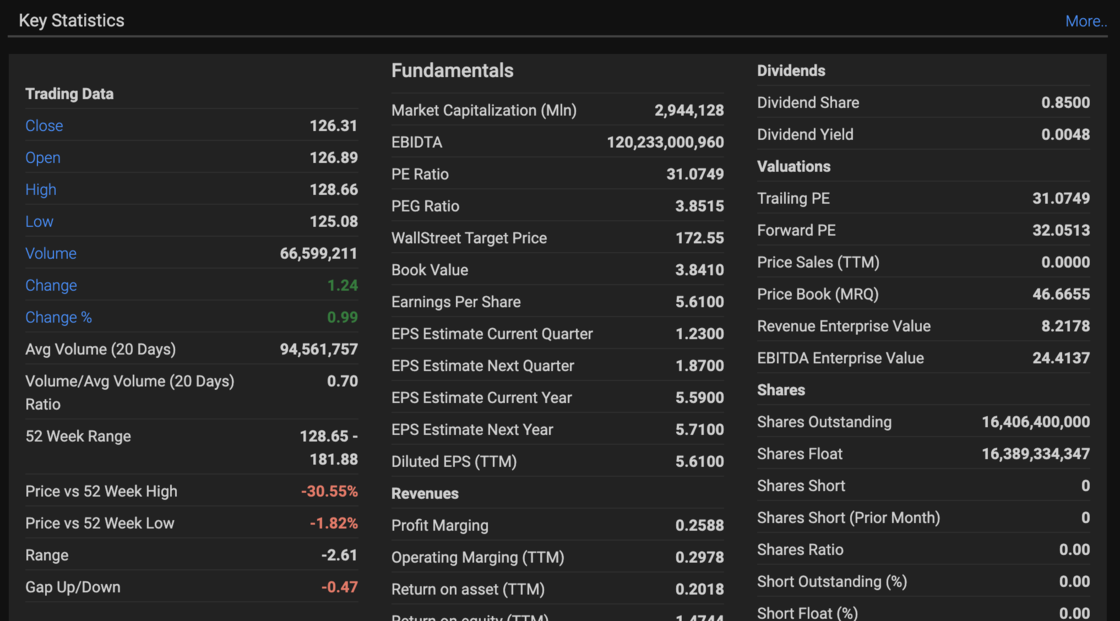
In total, we have around 30+ key stats available for you. This will allow our users to quickly view all the main key stats of any global symbol at a glance.
To view: Search any symbol say TSLA and then click on Overview > Quotes
Realtime data timestamp on symbol
KlickAnalytics provide realtime prices for US stocks via our broker feed. We update the symbol information with the date and timestamp which reflects the last updated price of the symbol in Eastern Standard Time (ET)

Welcome to KlickAnalytics Blog!
We have created a new blog. This blog will help our customer by keeping them
- Updated on all the latest updates
- How To's on using various apps on our platform
- Market Commentaries and much more.
Our goal is to keep our custom informed with all the platform and market updates.
Ask the market a question. Get a calculated answer.
The AI is not a chatbot bolted onto a document store. It calls the same analytics engine that powers every screen on this platform — so what comes back is a number it computed from raw history, with the command that produced it.
86,000+ instruments
Global equities, ETFs, funds, options, FX, commodities, crypto, economics, filings, transcripts and news — one normalised symbol universe with adjusted history.
A real analytics engine
Screening, backtesting, technicals, options analytics, correlations, seasonality and factor models — computed on demand from raw prices, never a stale cache.
It shows its working
Answers arrive with the charts, tables and tool calls behind them, so you can check the number instead of trusting a paraphrase.
Your own documents
Upload filings, decks and research. Ask across them and the answer cites the page it came from.
Agents and workflows
Multi-step research that runs the platform's tools for you — screen, pull the history, compute, compare, then write it up.
MCP, CLI and API
The same command catalogue from Claude, your own agent, a shell or your pipeline. The answer on screen is the answer your job gets at 4am.
You ask
“How does NVDA usually trade through earnings?”
It calls
→ ka.options_expected_move(NVDA)
It answers
NVDA has averaged a 9.2% absolute move on the day after earnings and closed higher 67% of the time. Two in three reactions land between −4.2% and +16.3% — the distribution is skewed right, not symmetric.
Every figure computed live from our own history — not scraped, not summarised.
Or start with