What's New
Product updates, improvements and fixes across the KlickAnalytics platform.
View Advancers and Decliners distributions
We've had enhanced our 'sectors' app with the following;
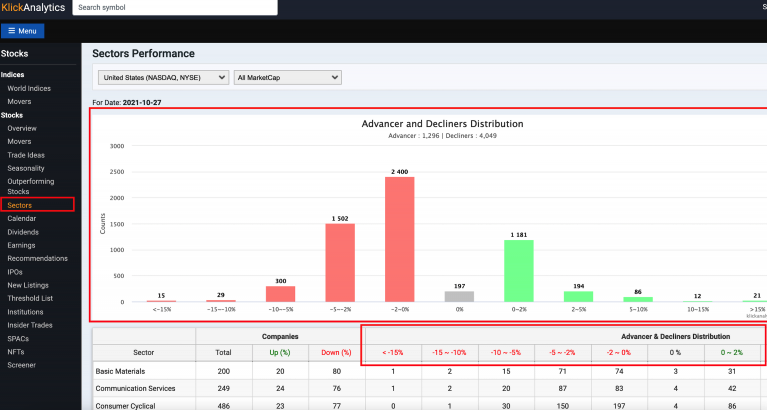
Added a column bar which shows;
Total number of companies Advanced and Declines within the range of <-15% to > 15%
All decliners are shown in red color
All advancers are shown in green color
Users can visually see the Advancers and Decliners distribution by a chart
Added additional columns to our table, which shows data for each sector. i.e.
Advancers and Decliners by 1 day return range from <-15% to >15%
To access: Click on Menu > Sector Performance
View Historical Standard Deviations for global symbols
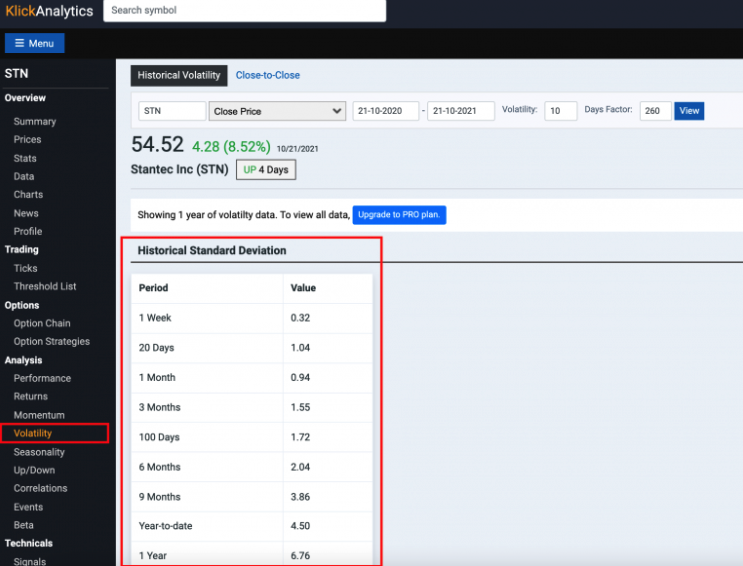
KlickAnalytics calculates a lot of derived data from market data. We just updated our volatility app to include historical standard deviations with the following periods;
1 Week
20 Days
1 Month
3 Months
100 Days
6 Months
9 Months
Year-to-date
1 Year
3 Years
and 5 Years
Defining price movement in terms of standard deviations is preferable to using percentage change because using standard deviations puts all the stocks on a level playing field. There are categories of stocks that are typically more volatile and have larger percentage price changes than other stocks. For example, low-priced small-cap stocks or high-tech stocks are typically much more volatile than lower volatility stocks such as utility stocks. If we used percentage change to define price movement, then high-volatility stocks would always dominate the list and we would miss lower-volatility stocks that might have an unusually large movement on a particular day.
This will allow our users to view price movements of any global symbol in terms of historical standard deviations and much more.
Ask the market a question. Get a calculated answer.
The AI is not a chatbot bolted onto a document store. It calls the same analytics engine that powers every screen on this platform — so what comes back is a number it computed from raw history, with the command that produced it.
86,000+ instruments
Global equities, ETFs, funds, options, FX, commodities, crypto, economics, filings, transcripts and news — one normalised symbol universe with adjusted history.
A real analytics engine
Screening, backtesting, technicals, options analytics, correlations, seasonality and factor models — computed on demand from raw prices, never a stale cache.
It shows its working
Answers arrive with the charts, tables and tool calls behind them, so you can check the number instead of trusting a paraphrase.
Your own documents
Upload filings, decks and research. Ask across them and the answer cites the page it came from.
Agents and workflows
Multi-step research that runs the platform's tools for you — screen, pull the history, compute, compare, then write it up.
MCP, CLI and API
The same command catalogue from Claude, your own agent, a shell or your pipeline. The answer on screen is the answer your job gets at 4am.
You ask
“How does NVDA usually trade through earnings?”
It calls
→ ka.options_expected_move(NVDA)
It answers
NVDA has averaged a 9.2% absolute move on the day after earnings and closed higher 67% of the time. Two in three reactions land between −4.2% and +16.3% — the distribution is skewed right, not symmetric.
Every figure computed live from our own history — not scraped, not summarised.
Or start with