What's New
Product updates, improvements and fixes across the KlickAnalytics platform.
A Complete View of Every Symbol
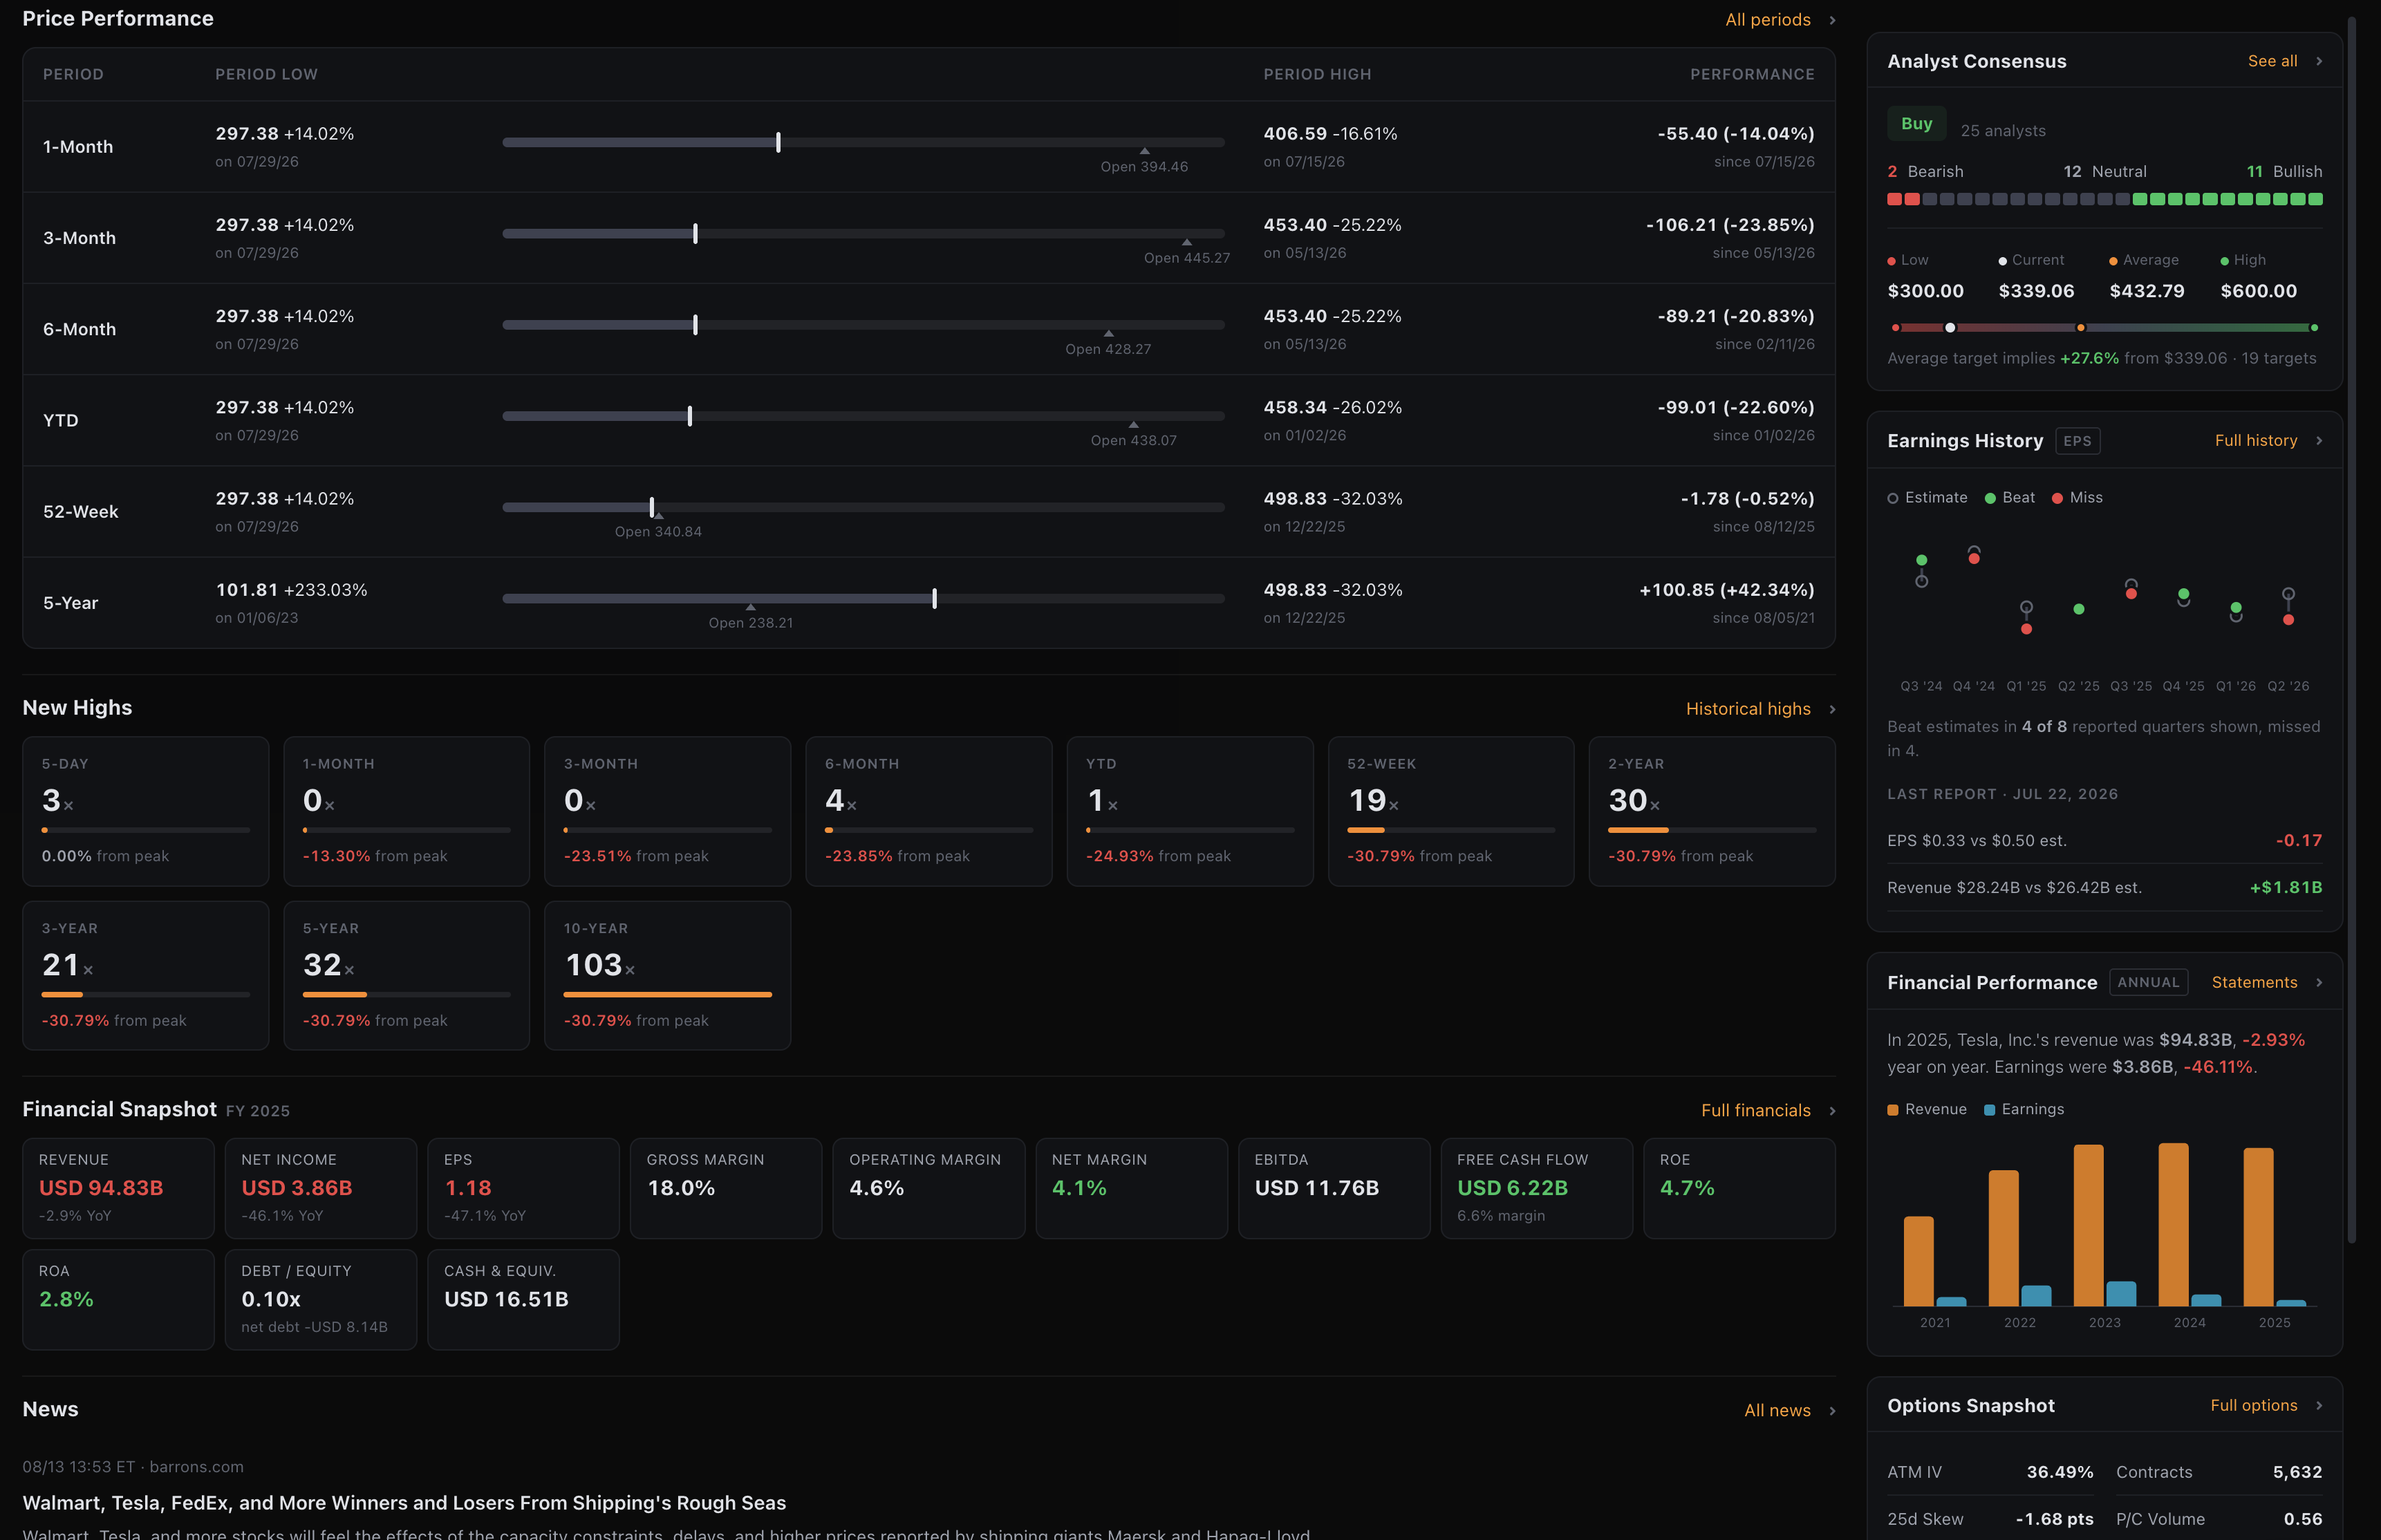
KlickAnalytics now brings price performance, analyst expectations, earnings results, financial health, options data, and the latest news together in one streamlined view.
Quickly explore:
- Price performance across multiple periods, from one month to five years and beyond
- Period highs, lows, opening levels, total returns, and the current position within each range
- New-high frequency and distance from peak across multiple timeframes
- Analyst recommendations, including bullish, neutral, and bearish ratings
- Analyst price targets, including low, average, and high estimates with implied upside or downside
- Earnings history, including EPS and revenue beats or misses
- A financial snapshot covering revenue, net income, EPS, margins, EBITDA, free cash flow, ROE, ROA, debt, and cash
- Annual financial performance trends
- Key options-market metrics and activity
- The latest company news and market developments
With the new information sidebar, essential intelligence is always visible alongside price performance—helping you understand how a symbol has performed, what analysts expect, how the company is executing, and what the market may be pricing in.
One symbol. One view. A more complete investment picture.
To access: Search for any symbol say TSLA, and you will see the information on the symbol overview page.
Ask the market a question. Get a calculated answer.
The AI is not a chatbot bolted onto a document store. It calls the same analytics engine that powers every screen on this platform — so what comes back is a number it computed from raw history, with the command that produced it.
86,000+ instruments
Global equities, ETFs, funds, options, FX, commodities, crypto, economics, filings, transcripts and news — one normalised symbol universe with adjusted history.
A real analytics engine
Screening, backtesting, technicals, options analytics, correlations, seasonality and factor models — computed on demand from raw prices, never a stale cache.
It shows its working
Answers arrive with the charts, tables and tool calls behind them, so you can check the number instead of trusting a paraphrase.
Your own documents
Upload filings, decks and research. Ask across them and the answer cites the page it came from.
Agents and workflows
Multi-step research that runs the platform's tools for you — screen, pull the history, compute, compare, then write it up.
MCP, CLI and API
The same command catalogue from Claude, your own agent, a shell or your pipeline. The answer on screen is the answer your job gets at 4am.
You ask
“How does NVDA usually trade through earnings?”
It calls
→ ka.options_expected_move(NVDA)
It answers
NVDA has averaged a 9.2% absolute move on the day after earnings and closed higher 67% of the time. Two in three reactions land between −4.2% and +16.3% — the distribution is skewed right, not symmetric.
Every figure computed live from our own history — not scraped, not summarised.
Or start with