What's New
Product updates, improvements and fixes across the KlickAnalytics platform.
Added - Price Target Summary & Forecast
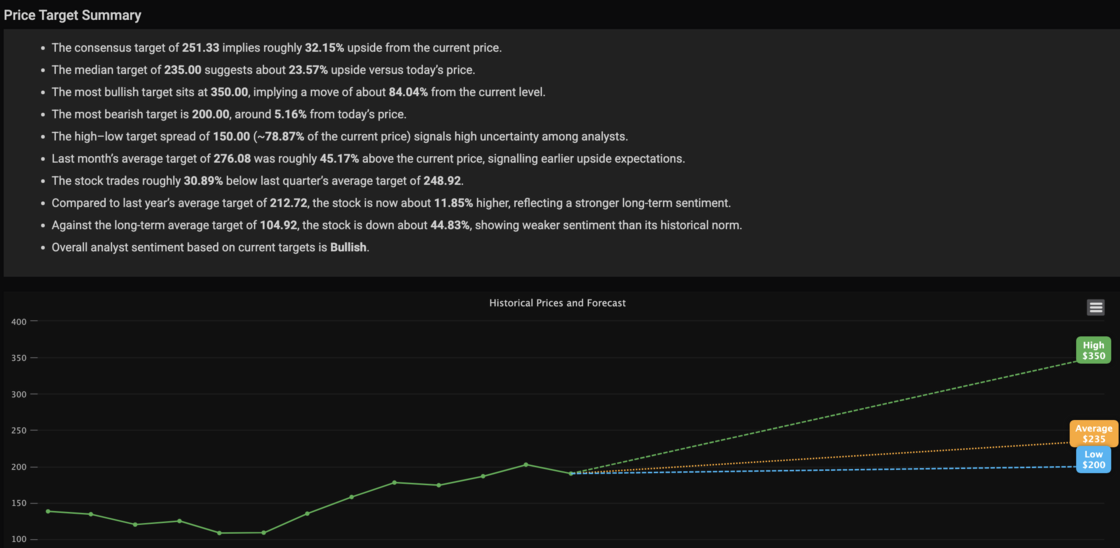
We’re excited to introduce a brand-new, powerful enhancement to your symbol research workflow — the Price Target Summary & Forecast Visualization.
This update brings analyst expectations to life with clear insights and an intuitive, interactive chart.
🔹 Smart Analyst Summary
For every symbol, you now get an instant, data-driven narrative summarizing:
Consensus, median, bullish, and bearish targets
Upside/downside percentages vs current price
Last month, last quarter, and last year target comparisons
Long-term sentiment vs historical norms
High–low target spread (market uncertainty indicator)
Overall analyst sentiment rating (Bullish / Neutral / Bearish)
All insights are computed dynamically based on the latest analyst data.
📈 Historical Prices + Forward Forecast Chart
The new chart overlays:
Historical monthly close prices
High analyst target
Average/consensus target
Low analyst target
Each forecast line includes a colored label box for quick identification (High, Average, Low).
The visual makes it effortless to understand:
How analysts see the stock moving
The range of expectations
Where the stock sits relative to its historical trend
These features will helps you:
Quickly assess analyst expectations
Spot shifts in sentiment
Compare short-term and long-term outlooks
Visualize risk/reward in one glance
Strengthen trading and investment decisions using cleaner intelligence
Whether you're researching a single stock or scanning multiple, this tool gives you an instant edge.
To access: Search for a symbol say NVDA and then go to Company > Price Target
Ask the market a question. Get a calculated answer.
The AI is not a chatbot bolted onto a document store. It calls the same analytics engine that powers every screen on this platform — so what comes back is a number it computed from raw history, with the command that produced it.
86,000+ instruments
Global equities, ETFs, funds, options, FX, commodities, crypto, economics, filings, transcripts and news — one normalised symbol universe with adjusted history.
A real analytics engine
Screening, backtesting, technicals, options analytics, correlations, seasonality and factor models — computed on demand from raw prices, never a stale cache.
It shows its working
Answers arrive with the charts, tables and tool calls behind them, so you can check the number instead of trusting a paraphrase.
Your own documents
Upload filings, decks and research. Ask across them and the answer cites the page it came from.
Agents and workflows
Multi-step research that runs the platform's tools for you — screen, pull the history, compute, compare, then write it up.
MCP, CLI and API
The same command catalogue from Claude, your own agent, a shell or your pipeline. The answer on screen is the answer your job gets at 4am.
You ask
“How does NVDA usually trade through earnings?”
It calls
→ ka.options_expected_move(NVDA)
It answers
NVDA has averaged a 9.2% absolute move on the day after earnings and closed higher 67% of the time. Two in three reactions land between −4.2% and +16.3% — the distribution is skewed right, not symmetric.
Every figure computed live from our own history — not scraped, not summarised.
Or start with