What's New
Product updates, improvements and fixes across the KlickAnalytics platform.
Advanced Seasonality—Go Beyond Simple Historical Averages
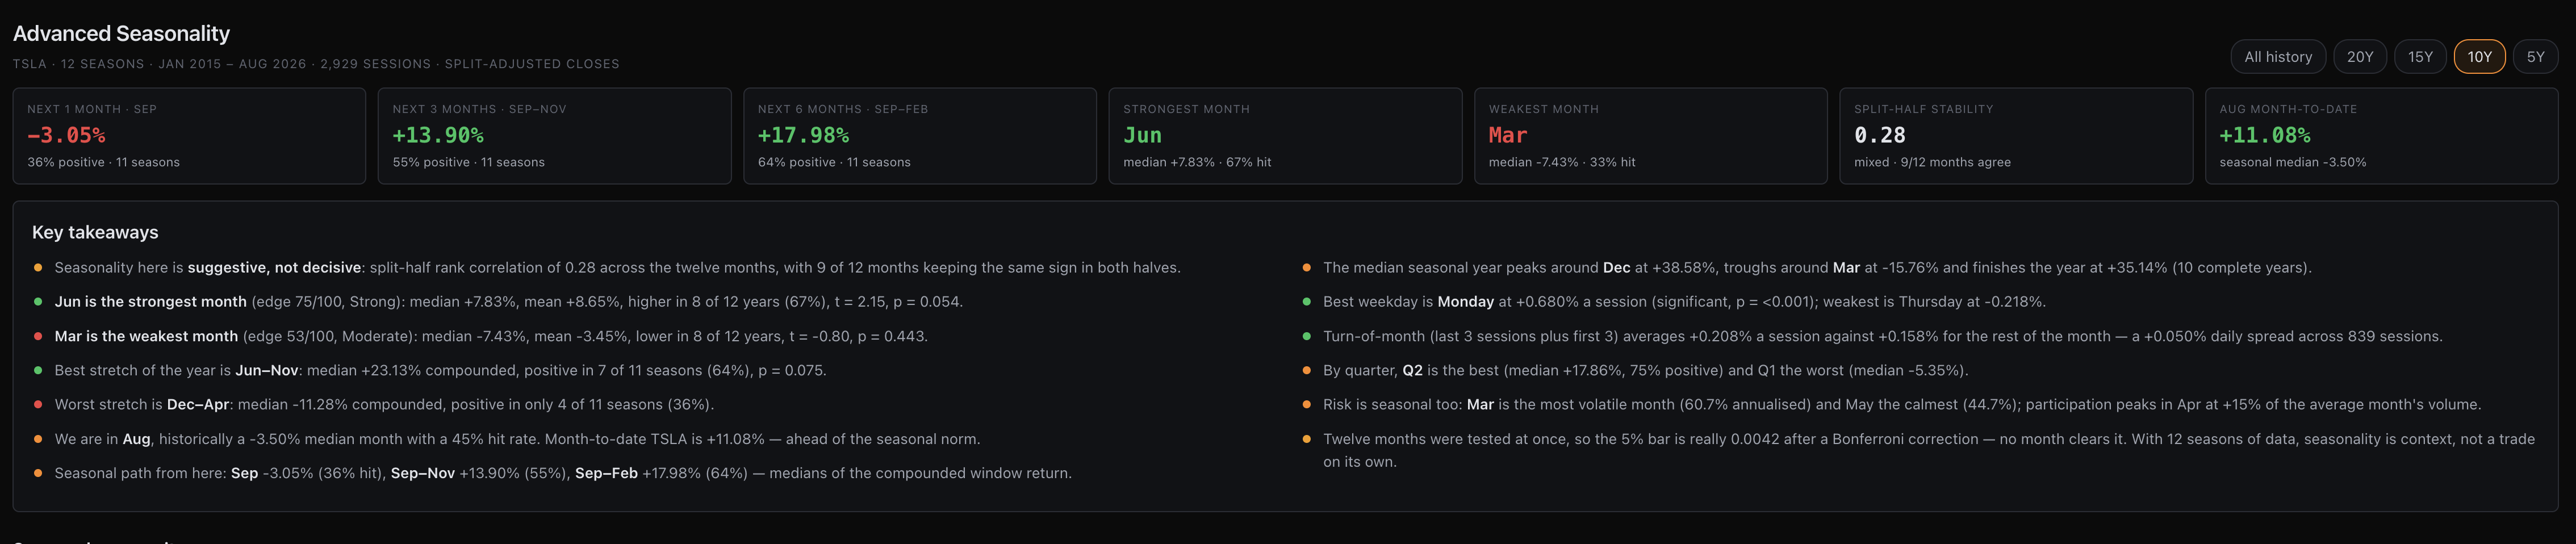
KlickAnalytics has significantly expanded its seasonality analysis, giving users a deeper and more statistically grounded view of how any symbol has historically performed across months, quarters, weekdays, and multi-month periods.
With Advanced Seasonality, you can now:
-
View expected performance for the next one, three, and six months
-
Identify the historically strongest and weakest months
-
Compare median and average returns, positive-year hit rates, and best and worst outcomes
-
Measure whether seasonal patterns remained stable between the first and second halves of history
-
Review statistical significance, volatility, risk-adjusted returns, and seasonal-edge scores
-
Discover the strongest and weakest contiguous seasonal windows
-
Compare quarterly and weekday performance
-
Analyze turn-of-the-month behavior
-
See which months historically experienced the greatest volatility and trading activity
-
Compare the current month’s performance with its historical seasonal pattern
-
Switch between five, 10, 15, 20 years, or all available history
-
Read automatically generated key takeaways explaining the most important seasonal findings
The new Seasonal Edge rating also helps distinguish potentially meaningful patterns from weak or noisy historical relationships—making it easier to understand both the opportunity and the reliability behind each result.
Seasonality is no longer just a monthly chart. It is now a complete statistical view of when a symbol has historically performed best, when it has struggled, and how much confidence you should place in the pattern.
Find the pattern. Test its strength. Prepare for what comes next.
To access: Search for any global symbol, and then from the menu select Analysis > Seasonality
Ask the market a question. Get a calculated answer.
The AI is not a chatbot bolted onto a document store. It calls the same analytics engine that powers every screen on this platform — so what comes back is a number it computed from raw history, with the command that produced it.
86,000+ instruments
Global equities, ETFs, funds, options, FX, commodities, crypto, economics, filings, transcripts and news — one normalised symbol universe with adjusted history.
A real analytics engine
Screening, backtesting, technicals, options analytics, correlations, seasonality and factor models — computed on demand from raw prices, never a stale cache.
It shows its working
Answers arrive with the charts, tables and tool calls behind them, so you can check the number instead of trusting a paraphrase.
Your own documents
Upload filings, decks and research. Ask across them and the answer cites the page it came from.
Agents and workflows
Multi-step research that runs the platform's tools for you — screen, pull the history, compute, compare, then write it up.
MCP, CLI and API
The same command catalogue from Claude, your own agent, a shell or your pipeline. The answer on screen is the answer your job gets at 4am.
You ask
“How does NVDA usually trade through earnings?”
It calls
→ ka.options_expected_move(NVDA)
It answers
NVDA has averaged a 9.2% absolute move on the day after earnings and closed higher 67% of the time. Two in three reactions land between −4.2% and +16.3% — the distribution is skewed right, not symmetric.
Every figure computed live from our own history — not scraped, not summarised.
Or start with