What's New
Product updates, improvements and fixes across the KlickAnalytics platform.
Candlestick Patterns Analysis
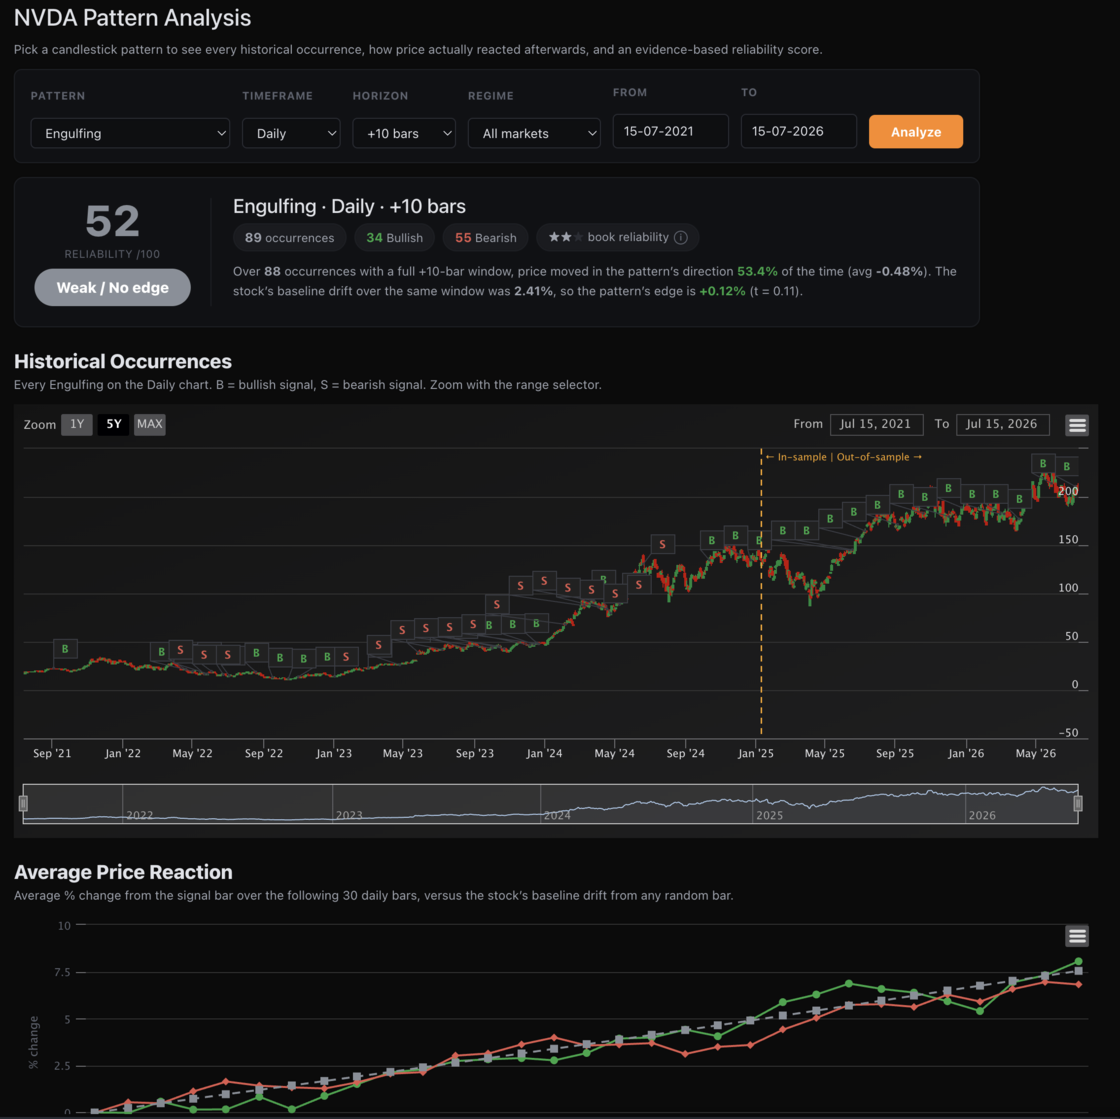
Every charting platform will tell you a Morning Star is a bullish reversal. None of them will tell you whether it has ever actually worked on the stock you're looking at.
Today we're shipping a rebuilt Technicals section — including Pattern Analysis, an evidence engine that back-tests all 24 candlestick patterns against a symbol's own price history and scores them on what really happened next.
Technicals → Overview
- Summary, Technical Indicators and Moving Averages gauge meters at a glance
- 12 indicators — RSI, STOCH, STOCHRSI, MACD, ADX, Williams %R, CCI, ATR, Highs/Lows, Ultimate Oscillator, ROC, Bull/Bear Power — each with a Buy/Sell/Neutral call
- Moving Averages (SMA + EMA, 5 through 200) and Pivot Points across five methods: Classic, Fibonacci, Camarilla, Woodie's and DeMark's
- Daily, Weekly and Monthly timeframes
Technicals → Candle Patterns
- Interactive candlestick chart with every pattern flagged directly on the bars
- 24 patterns detected across Daily, Weekly and Monthly, split into Emerging and Completed
- Filter instantly by timeframe, pattern indication, type and reliability — chart and table update together, with no page reload
Technicals → Pattern Analysis — the new engine
- Pick any pattern and see every historical occurrence marked on the chart
- Average Price Reaction — how price actually moved over the following bars, plotted against the stock's own baseline drift
- Forward Return Statistics at any horizon from +1 to +30 bars: win rate, average and median return, baseline, edge, MFE/MAE and t-statistic
- Occurrence Detail — every signal, its real forward returns, and whether it worked or failed
- Pattern Leaderboard — all 24 patterns ranked for your symbol, answering "which of these actually work here?"
- Market-regime filter — test a pattern only in uptrends or only in downtrends. Many patterns behave completely differently depending on the trend they appear in
- Custom date range — analyse any window you like
What makes this different
Most pattern tools show you a win rate and stop. A win rate is easy to fake:
- We measure edge, not just wins. A 57% win rate sounds great until you learn the stock rose 56% of the time anyway. We subtract the symbol's own baseline drift, so you see what the pattern contributed — not what the market gave you for free.
- We don't trust small samples. A pattern that went 2-for-2 isn't a 100% pattern. Scores are shrunk by sample size, and anything under 10 occurrences is flagged as untrustworthy rather than celebrated.
- We validate out-of-sample. Every pattern is fitted on the first 70% of history and re-tested on the 30% it has never seen. An edge that only exists in the data it was found in isn't an edge.
- We show you the odds of fooling yourself. Test 24 patterns and roughly one will look significant by pure chance. We print that number next to the survivor count, so you know what "significant" is actually worth.
The honest part
We ran this on TSLA. Zero of 24 patterns survived out-of-sample. One that looked outstanding in-sample — a 68% win rate and a t-statistic above 3 — collapsed the moment it met unseen data.
We could have hidden that. Instead it's the whole point. Pattern Analysis is built to tell you when a pattern is real, and — far more often — when it isn't. That's worth more than another green arrow.
Available now on any global symbol under Technicals → Pattern Analysis. Gauges, charts and pattern detection are open to all users; reliability scores, edge figures and out-of-sample validation are part of Terminal.
To view: Search for any symbol say NVDA, and then click on Overview > Technical > Chart Patterns
Ask the market a question. Get a calculated answer.
The AI is not a chatbot bolted onto a document store. It calls the same analytics engine that powers every screen on this platform — so what comes back is a number it computed from raw history, with the command that produced it.
86,000+ instruments
Global equities, ETFs, funds, options, FX, commodities, crypto, economics, filings, transcripts and news — one normalised symbol universe with adjusted history.
A real analytics engine
Screening, backtesting, technicals, options analytics, correlations, seasonality and factor models — computed on demand from raw prices, never a stale cache.
It shows its working
Answers arrive with the charts, tables and tool calls behind them, so you can check the number instead of trusting a paraphrase.
Your own documents
Upload filings, decks and research. Ask across them and the answer cites the page it came from.
Agents and workflows
Multi-step research that runs the platform's tools for you — screen, pull the history, compute, compare, then write it up.
MCP, CLI and API
The same command catalogue from Claude, your own agent, a shell or your pipeline. The answer on screen is the answer your job gets at 4am.
You ask
“How does NVDA usually trade through earnings?”
It calls
→ ka.options_expected_move(NVDA)
It answers
NVDA has averaged a 9.2% absolute move on the day after earnings and closed higher 67% of the time. Two in three reactions land between −4.2% and +16.3% — the distribution is skewed right, not symmetric.
Every figure computed live from our own history — not scraped, not summarised.
Or start with