What's New
Product updates, improvements and fixes across the KlickAnalytics platform.
Introducing Matrix: A New Way to Conduct Financial Research
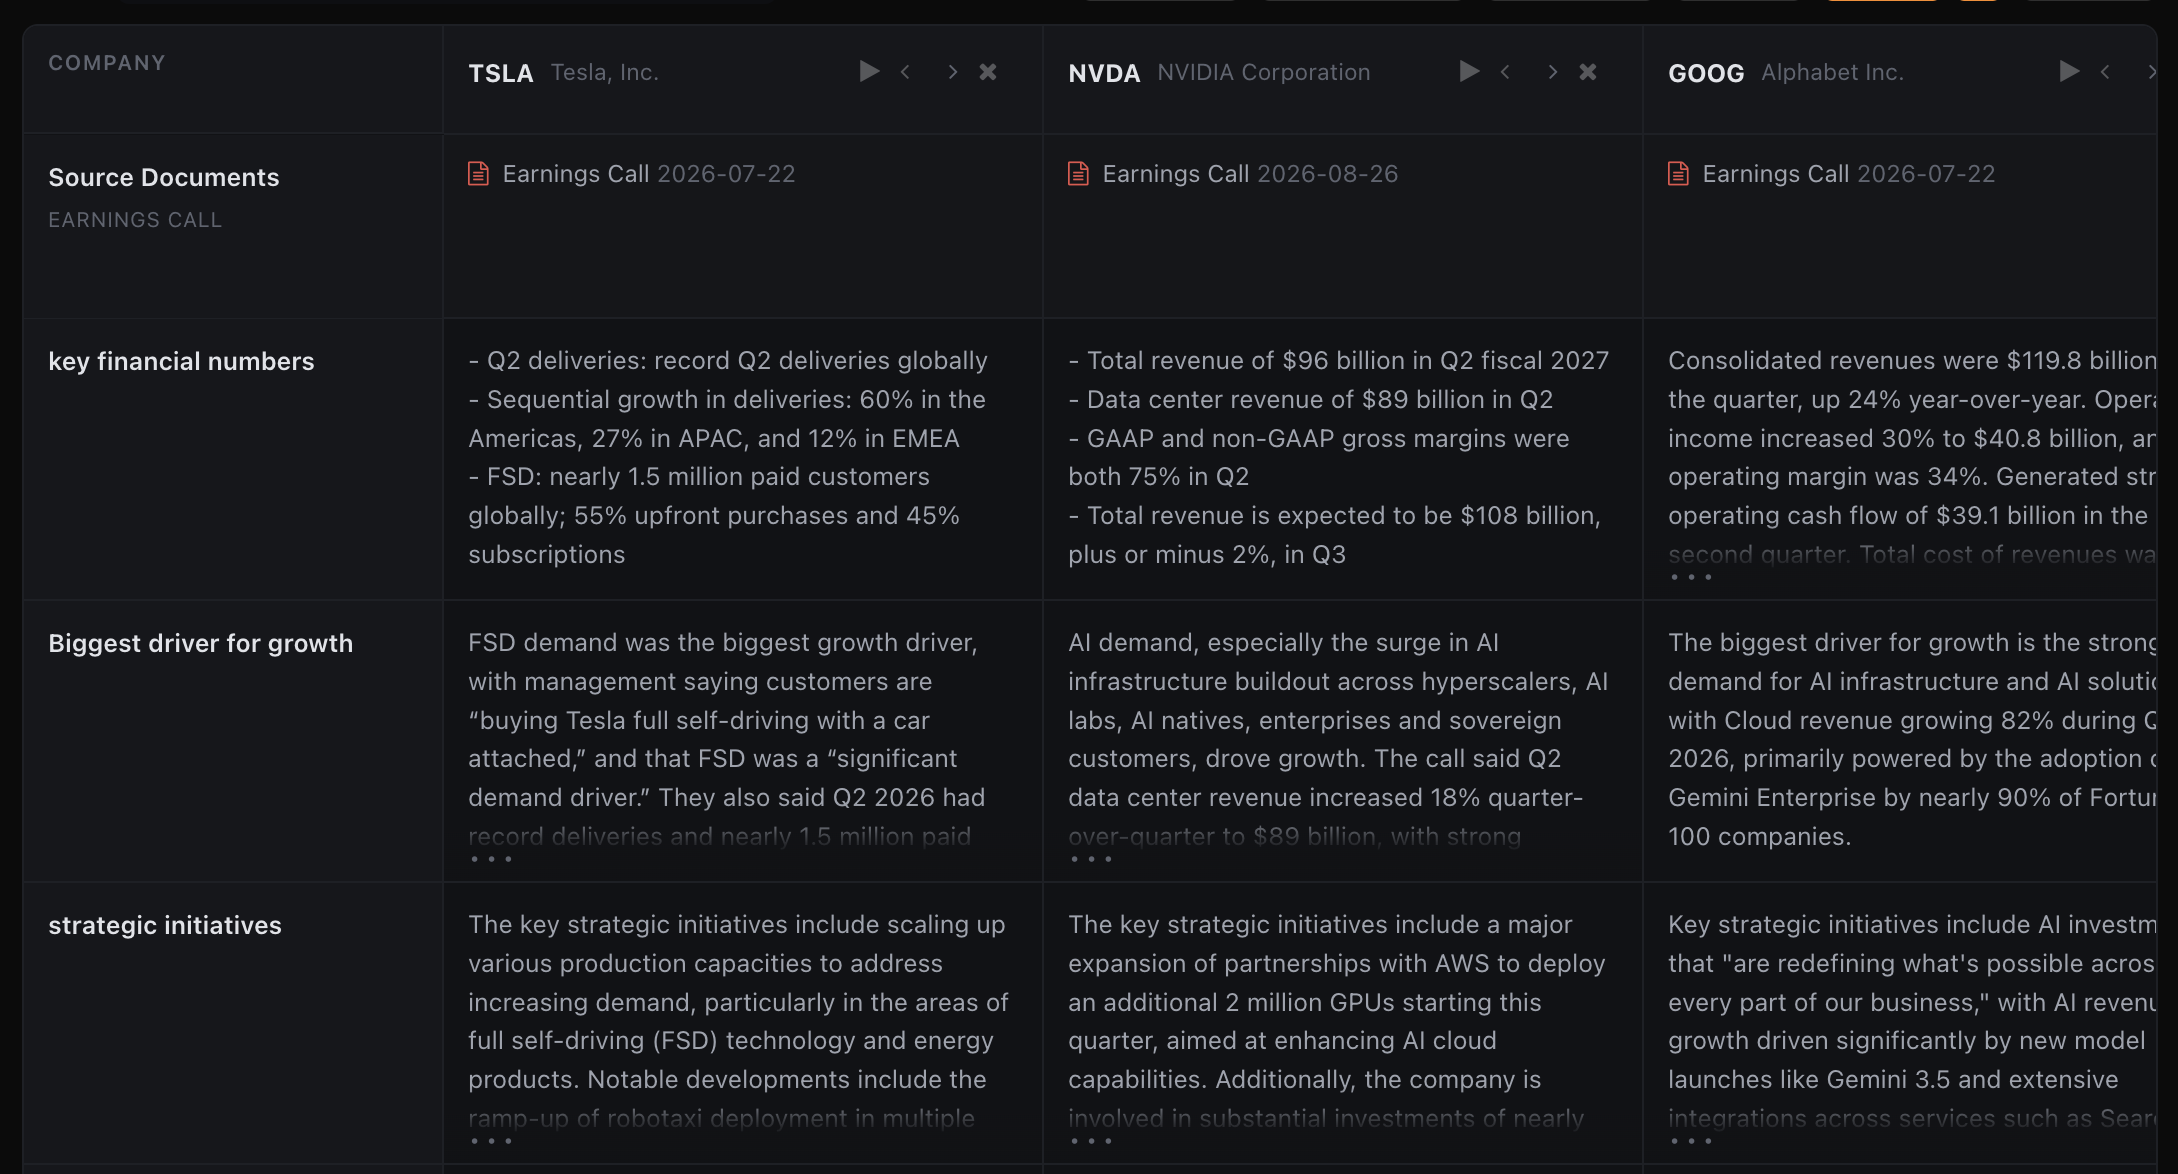
This is one of the most significant updates we have introduced to KlickAnalytics.
Matrix transforms complex, multi-company research into a structured, source-grounded comparison workspace.
Place companies across the columns. Add research questions down the rows. Matrix then analyzes each company using its own filings, earnings calls, financial data, and selected source documents—producing consistent answers that can be compared side by side.
Instead of opening documents individually, repeating the same questions, and manually assembling findings, you can now build an entire research framework once and run it across every company.
With Matrix, you can:
-
Compare multiple companies side by side
-
Add your own research questions and analysis criteria
-
Analyze earnings calls, filings, and selected documents
-
Incorporate financial and market data
-
Run individual cells, selected sections, or the complete Matrix
-
Compare key financial numbers, growth drivers, strategic initiatives, risks, guidance, management commentary, and more
-
Apply the same question consistently across every company
-
Expand the Matrix by adding companies, documents, analysis, and data
-
Chat with the completed research to investigate findings further
-
Save work as a draft or publish and share it with others
-
Reopen and update a Matrix as new information becomes available
Each row becomes a like-for-like comparison. Each column becomes a structured company research profile. Each cell connects a precise question with evidence from the relevant company’s own materials.
Matrix can support powerful workflows such as:
-
Earnings-call reviews
-
Peer and competitor analysis
-
Investment screening and due diligence
-
Portfolio-company monitoring
-
Industry landscape research
-
Management and guidance comparisons
-
Risk-factor analysis
-
Strategic initiative tracking
-
Financial KPI benchmarking
-
Investment committee preparation
Inspired by the emerging generation of AI research systems such as Hebbia Matrix, the KlickAnalytics Matrix is built specifically around financial-market intelligence—connecting company documents, structured data, analysis tools, and collaborative research in one environment.
This is more than another research feature. It is a new operating layer for financial analysis.
Companies across the top. Questions down the side. Evidence inside every answer.
One Matrix. An entire research process.
To access: From the menu, click AI > Matrix
Ask the market a question. Get a calculated answer.
The AI is not a chatbot bolted onto a document store. It calls the same analytics engine that powers every screen on this platform — so what comes back is a number it computed from raw history, with the command that produced it.
86,000+ instruments
Global equities, ETFs, funds, options, FX, commodities, crypto, economics, filings, transcripts and news — one normalised symbol universe with adjusted history.
A real analytics engine
Screening, backtesting, technicals, options analytics, correlations, seasonality and factor models — computed on demand from raw prices, never a stale cache.
It shows its working
Answers arrive with the charts, tables and tool calls behind them, so you can check the number instead of trusting a paraphrase.
Your own documents
Upload filings, decks and research. Ask across them and the answer cites the page it came from.
Agents and workflows
Multi-step research that runs the platform's tools for you — screen, pull the history, compute, compare, then write it up.
MCP, CLI and API
The same command catalogue from Claude, your own agent, a shell or your pipeline. The answer on screen is the answer your job gets at 4am.
You ask
“How does NVDA usually trade through earnings?”
It calls
→ ka.options_expected_move(NVDA)
It answers
NVDA has averaged a 9.2% absolute move on the day after earnings and closed higher 67% of the time. Two in three reactions land between −4.2% and +16.3% — the distribution is skewed right, not symmetric.
Every figure computed live from our own history — not scraped, not summarised.
Or start with