What's New
Product updates, improvements and fixes across the KlickAnalytics platform.
🔔 Introducing the Notification Center
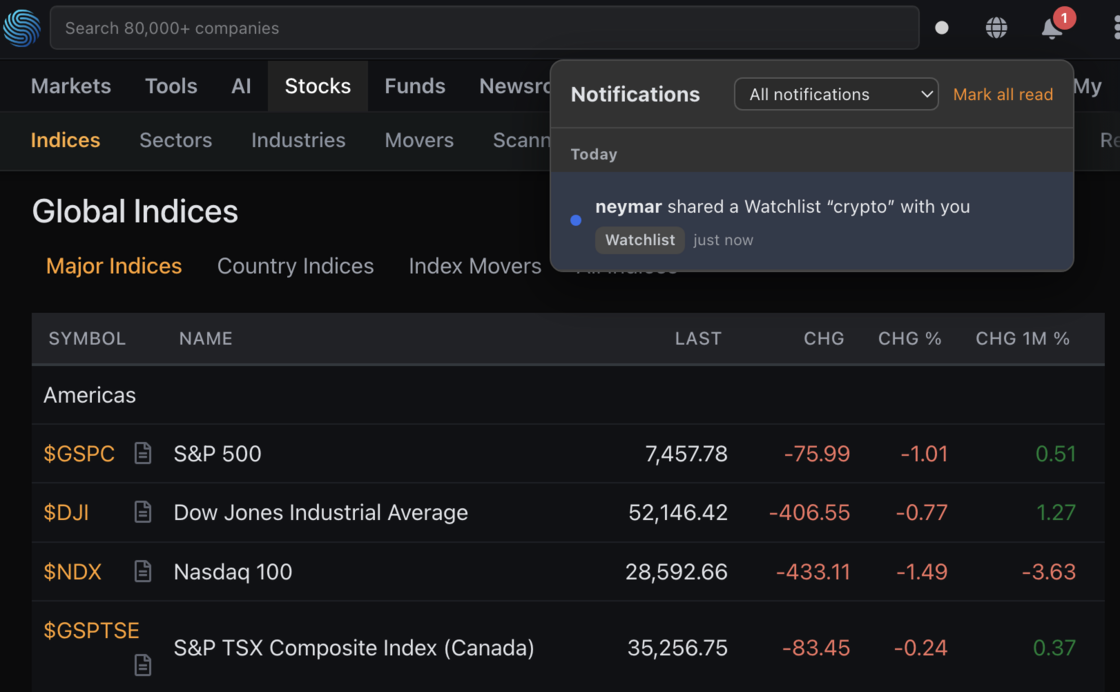
Stay in the loop the moment your team shares work with you — without ever leaving your workflow.
We've added a Notification Center to the KlickAnalytics header. Whenever a teammate shares a resource with you, a bell notification appears in real time — so nothing your team builds slips through the cracks.
What's New
- Header bell with live unread count — a badge shows how many notifications you haven't seen yet, updating instantly.
- Real-time delivery — the moment someone shares a Watchlist, Screener, Chart, or any resource with you, it pops up. No refresh needed.
- One click to the source — open a notification and jump straight to the shared resource.
- Filter by type — narrow the list to just Watchlists, Screeners, Charts, and more.
- Read / unread at a glance — a blue dot marks what's new; it turns gray once you've seen it. Clear everything with Mark all read.
- Always accurate — if a share is later revoked, its notification disappears automatically.
Why It Matters
- Never miss shared work — team collaboration surfaces immediately, right where you already are.
- Stay in the platform — no more pinging on Slack or email to say "I shared it with you."
- Less noise, more signal — filters and read-state keep your inbox focused on what's relevant.
Look for the 🔔 in the top navigation — it's live now.
To access: On top header, click on the notification icon to display all your notifications.
Ask the market a question. Get a calculated answer.
The AI is not a chatbot bolted onto a document store. It calls the same analytics engine that powers every screen on this platform — so what comes back is a number it computed from raw history, with the command that produced it.
86,000+ instruments
Global equities, ETFs, funds, options, FX, commodities, crypto, economics, filings, transcripts and news — one normalised symbol universe with adjusted history.
A real analytics engine
Screening, backtesting, technicals, options analytics, correlations, seasonality and factor models — computed on demand from raw prices, never a stale cache.
It shows its working
Answers arrive with the charts, tables and tool calls behind them, so you can check the number instead of trusting a paraphrase.
Your own documents
Upload filings, decks and research. Ask across them and the answer cites the page it came from.
Agents and workflows
Multi-step research that runs the platform's tools for you — screen, pull the history, compute, compare, then write it up.
MCP, CLI and API
The same command catalogue from Claude, your own agent, a shell or your pipeline. The answer on screen is the answer your job gets at 4am.
You ask
“How does NVDA usually trade through earnings?”
It calls
→ ka.options_expected_move(NVDA)
It answers
NVDA has averaged a 9.2% absolute move on the day after earnings and closed higher 67% of the time. Two in three reactions land between −4.2% and +16.3% — the distribution is skewed right, not symmetric.
Every figure computed live from our own history — not scraped, not summarised.
Or start with