What's New
Product updates, improvements and fixes across the KlickAnalytics platform.
Introducing the Option Calculator
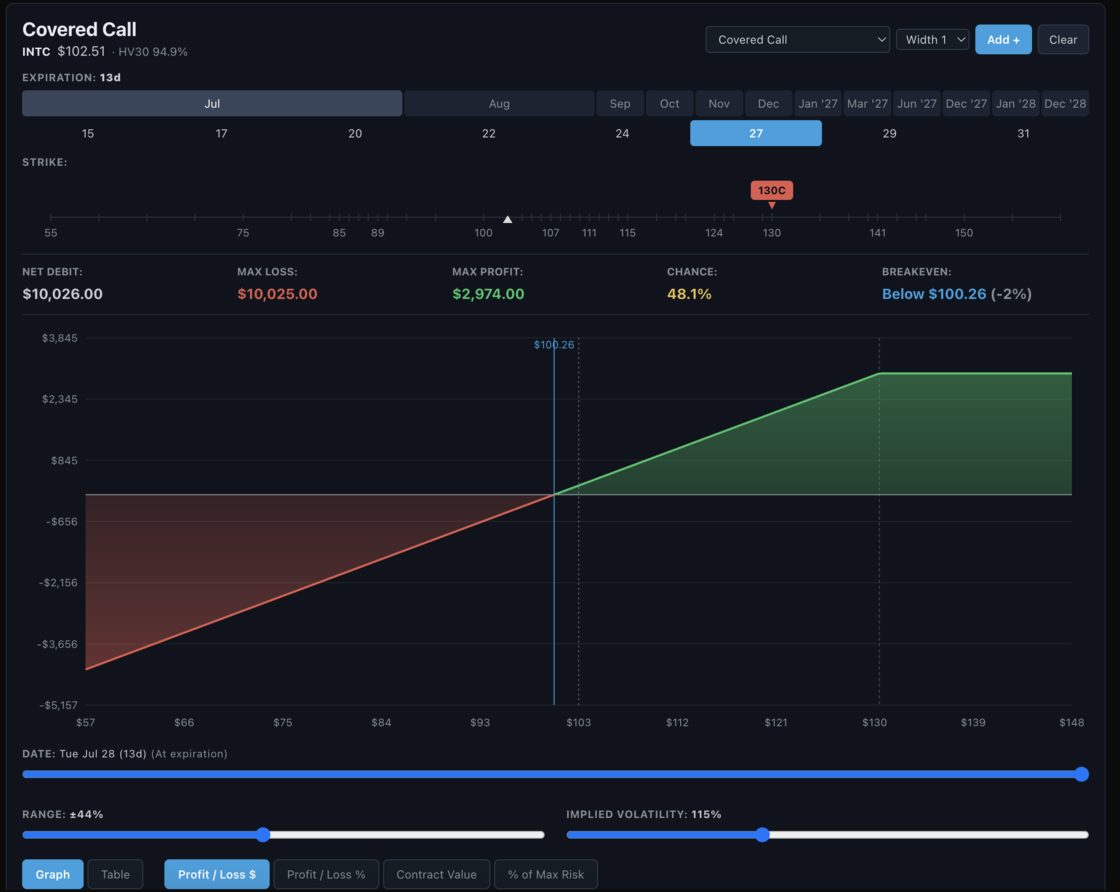
Fifty-eight strategies. One canvas. Every payoff, breakeven, Greek and probability — live, and yours to bend.
FIFTY-EIGHT STRATEGIES, FROM FIRST TRADE TO MASTER CLASS From the humble Long Call to the Double Diagonal, arranged across four tiers — Novice, Intermediate, Advanced, Expert. Choose one and it assembles itself from the live chain, priced to the real bid and ask.
BUILD IT LEG BY LEG
Buy or sell calls, puts, or the underlying itself. Add a leg, drop a leg, flip a side, change the size. The position is yours to shape — there is no strategy we can name that you cannot build by hand.
DRAG A STRIKE. WATCH THE WORLD MOVE.
Take hold of any strike and slide it along the ruler. The payoff curve, the breakevens, the Greeks and the odds all redraw beneath your finger, instantly.
THE DIAGRAM THAT TELLS THE WHOLE TRUTH
Profit in green, loss in red, breakevens marked, every strike traced. Hover anywhere along it to read your exact profit or loss at any price.
TRAVEL THROUGH TIME
The date slider prices your position on any day between today and expiration — carrying full Black-Scholes time value, not merely the hockey stick you get at the end. Watch theta do its quiet work.
BEND VOLATILITY TO YOUR WILL
Drive implied volatility from a quarter to triple. See precisely what a volatility crush — or an earnings shock — would do to your position, before it ever does it.
THE NUMBERS THAT DECIDE EVERYTHING
Net debit or credit. Maximum profit. Maximum loss. Breakeven. Probability of profit. And on the line beneath: net delta, gamma, theta and vega. No hunting. No guessing.
FOUR LENSES ON THE SAME TRADE
Profit and loss in dollars, or in percent. Contract value. Percent of maximum risk. As a graph, or as a table. Look at it however you think.
HONEST MATH
A covered call cannot lose more than its cost basis. A long put cannot profit beyond its strike. A calendar cannot lose more than its debit.
We compute what is true — not what is convenient.
To access: Search for any symbol say TSLA and then click on Analysis > Options > Calculator
Ask the market a question. Get a calculated answer.
The AI is not a chatbot bolted onto a document store. It calls the same analytics engine that powers every screen on this platform — so what comes back is a number it computed from raw history, with the command that produced it.
86,000+ instruments
Global equities, ETFs, funds, options, FX, commodities, crypto, economics, filings, transcripts and news — one normalised symbol universe with adjusted history.
A real analytics engine
Screening, backtesting, technicals, options analytics, correlations, seasonality and factor models — computed on demand from raw prices, never a stale cache.
It shows its working
Answers arrive with the charts, tables and tool calls behind them, so you can check the number instead of trusting a paraphrase.
Your own documents
Upload filings, decks and research. Ask across them and the answer cites the page it came from.
Agents and workflows
Multi-step research that runs the platform's tools for you — screen, pull the history, compute, compare, then write it up.
MCP, CLI and API
The same command catalogue from Claude, your own agent, a shell or your pipeline. The answer on screen is the answer your job gets at 4am.
You ask
“How does NVDA usually trade through earnings?”
It calls
→ ka.options_expected_move(NVDA)
It answers
NVDA has averaged a 9.2% absolute move on the day after earnings and closed higher 67% of the time. Two in three reactions land between −4.2% and +16.3% — the distribution is skewed right, not symmetric.
Every figure computed live from our own history — not scraped, not summarised.
Or start with