What's New
Product updates, improvements and fixes across the KlickAnalytics platform.
🗒️ Introducing Your New To-Do List!
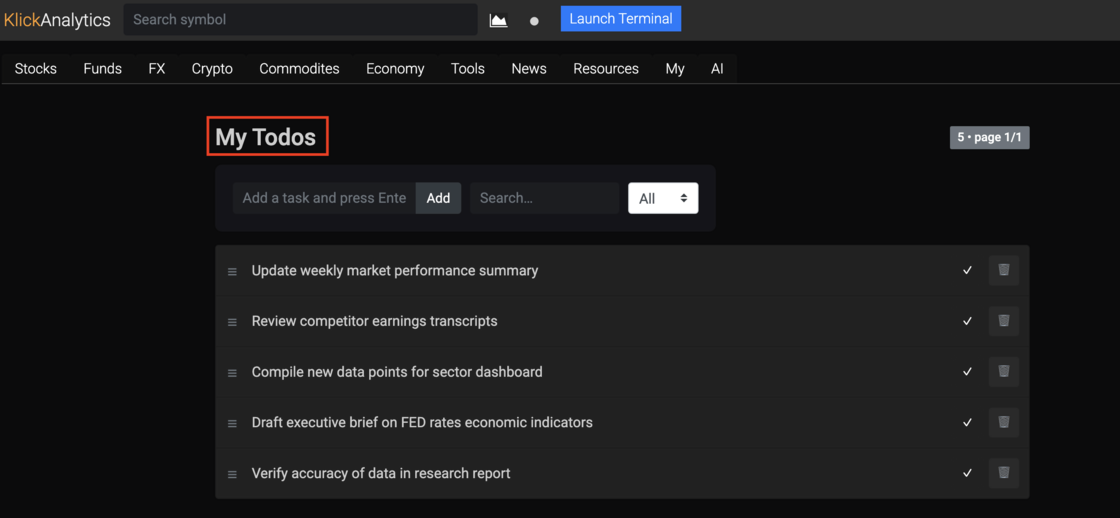
Stay organized and focused with our built-in task manager — designed to help our users manage daily priorities effortlessly.
✨ Key Features:
Quick Add & Edit: Create tasks instantly and edit inline — no page reloads needed.
Mark as Done: One-click checkmark to complete and archive tasks.
Smart Search & Filter: Instantly find open or completed tasks with real-time search.
Drag-and-Drop Sorting: Rearrange tasks by priority with a simple drag.
Pagination for Performance: Automatically organizes long lists for smooth navigation.
Mobile Friendly: Clean, responsive interface that works perfectly on any device.
💡 Why You’ll Love It:
Keep track of your research, meetings, and follow-ups in one place.
Replace sticky notes and spreadsheets with a sleek, centralized view.
Boost productivity by focusing on what matters most each day.
Start using your new To-Do List today and bring structure to your workflow — simple, smart, and fast.
To access: From the top menu > Tools > Todos
Ask the market a question. Get a calculated answer.
The AI is not a chatbot bolted onto a document store. It calls the same analytics engine that powers every screen on this platform — so what comes back is a number it computed from raw history, with the command that produced it.
86,000+ instruments
Global equities, ETFs, funds, options, FX, commodities, crypto, economics, filings, transcripts and news — one normalised symbol universe with adjusted history.
A real analytics engine
Screening, backtesting, technicals, options analytics, correlations, seasonality and factor models — computed on demand from raw prices, never a stale cache.
It shows its working
Answers arrive with the charts, tables and tool calls behind them, so you can check the number instead of trusting a paraphrase.
Your own documents
Upload filings, decks and research. Ask across them and the answer cites the page it came from.
Agents and workflows
Multi-step research that runs the platform's tools for you — screen, pull the history, compute, compare, then write it up.
MCP, CLI and API
The same command catalogue from Claude, your own agent, a shell or your pipeline. The answer on screen is the answer your job gets at 4am.
You ask
“How does NVDA usually trade through earnings?”
It calls
→ ka.options_expected_move(NVDA)
It answers
NVDA has averaged a 9.2% absolute move on the day after earnings and closed higher 67% of the time. Two in three reactions land between −4.2% and +16.3% — the distribution is skewed right, not symmetric.
Every figure computed live from our own history — not scraped, not summarised.
Or start with