What's New
Product updates, improvements and fixes across the KlickAnalytics platform.
Market Spreads & Ratios
See how one market stands against another—instantly.
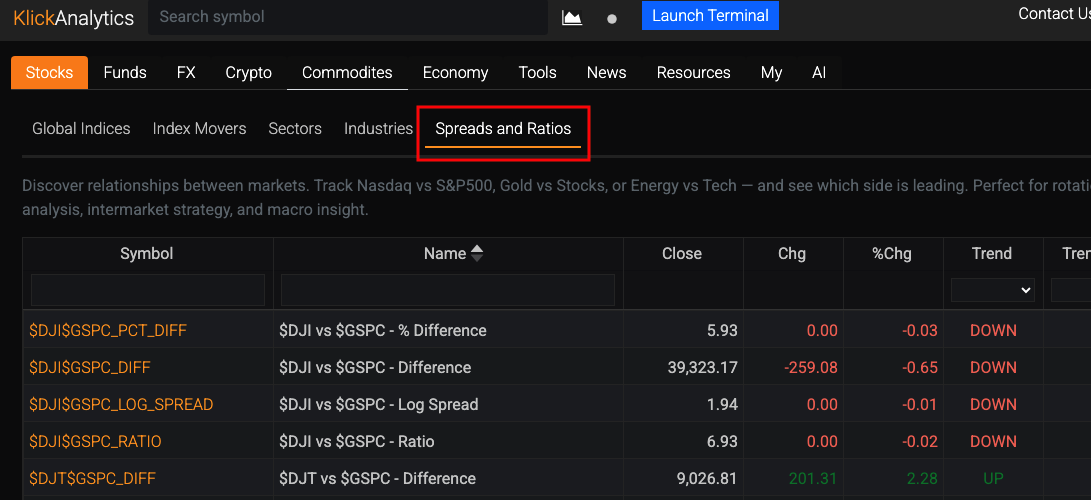
You can now chart synthetic pairs across major U.S. indices, sectors, factors, bonds, commodities, FX, and crypto—using metrics like DIFF, RATIO, PCTDIFF, and LOGSPREAD. Track classic relationships (e.g., XLY/XLP, IWM/SPY, SOXX/SPY, TLT/SPY, BTCUSD/QQQ) to spot leadership, rotation, and macro inflection points.
Why it matters
Find relative strength: See what’s leading vs lagging—across indices, sectors, and themes.
Time macro turns: Bonds vs stocks, USD vs gold, oil vs transports—view the spread, not just price.
Idea generation: Surface pairs breaking out or mean-reverting for faster trade discovery.
One click, clean math: No spreadsheets—metrics are computed and charted for you.
What you can do
Choose two symbols (we support $ prefixes if your symbol uses it).
Pick a metric: DIFF, RATIO, PCTDIFF, LOGSPREAD.
Plot as a time series, compare regimes, and add to your watchlists.
Example presets
Risk Appetite: XLY / XLP (consumer discretionary vs staples)
Size Rotation: IWM / SPY (small vs large)
Tech Heat: SOXX / SPY, XLK / SPY
Bond-Equity Pulse: TLT / SPY, IEF / TLT
Commodities vs Stocks: GLD / SPY, USO / SPY, GDX / GLD
Transports & Fuel: IYT / USO, DAL / USO, ODFL / UGA
Crypto Risk Proxy: BTCUSD / QQQ, ETHUSD / QQQ
Who it’s for
Traders: Rotation, spread setups, mean-reversion, and breakout scans.
Analysts/Economists: Intermarket confirmation (rates, FX, commodities vs equities).
Investors: Simple, visual context for portfolio tilts (value vs growth, defensives vs cyclicals).
Notes & conventions
Symbols are preserved exactly as you store them (including $ when applicable).
PCTDIFF = (A − B) / B and LOGSPREAD = ln(A / B).
You’ll see curated U.S. pairs out of the box; you can add your own anytime.
To access: From the top menu, click on Stocks > Indices > Spreads and Ratios
Ask the market a question. Get a calculated answer.
The AI is not a chatbot bolted onto a document store. It calls the same analytics engine that powers every screen on this platform — so what comes back is a number it computed from raw history, with the command that produced it.
86,000+ instruments
Global equities, ETFs, funds, options, FX, commodities, crypto, economics, filings, transcripts and news — one normalised symbol universe with adjusted history.
A real analytics engine
Screening, backtesting, technicals, options analytics, correlations, seasonality and factor models — computed on demand from raw prices, never a stale cache.
It shows its working
Answers arrive with the charts, tables and tool calls behind them, so you can check the number instead of trusting a paraphrase.
Your own documents
Upload filings, decks and research. Ask across them and the answer cites the page it came from.
Agents and workflows
Multi-step research that runs the platform's tools for you — screen, pull the history, compute, compare, then write it up.
MCP, CLI and API
The same command catalogue from Claude, your own agent, a shell or your pipeline. The answer on screen is the answer your job gets at 4am.
You ask
“How does NVDA usually trade through earnings?”
It calls
→ ka.options_expected_move(NVDA)
It answers
NVDA has averaged a 9.2% absolute move on the day after earnings and closed higher 67% of the time. Two in three reactions land between −4.2% and +16.3% — the distribution is skewed right, not symmetric.
Every figure computed live from our own history — not scraped, not summarised.
Or start with