What's New
Product updates, improvements and fixes across the KlickAnalytics platform.
News of the Hour
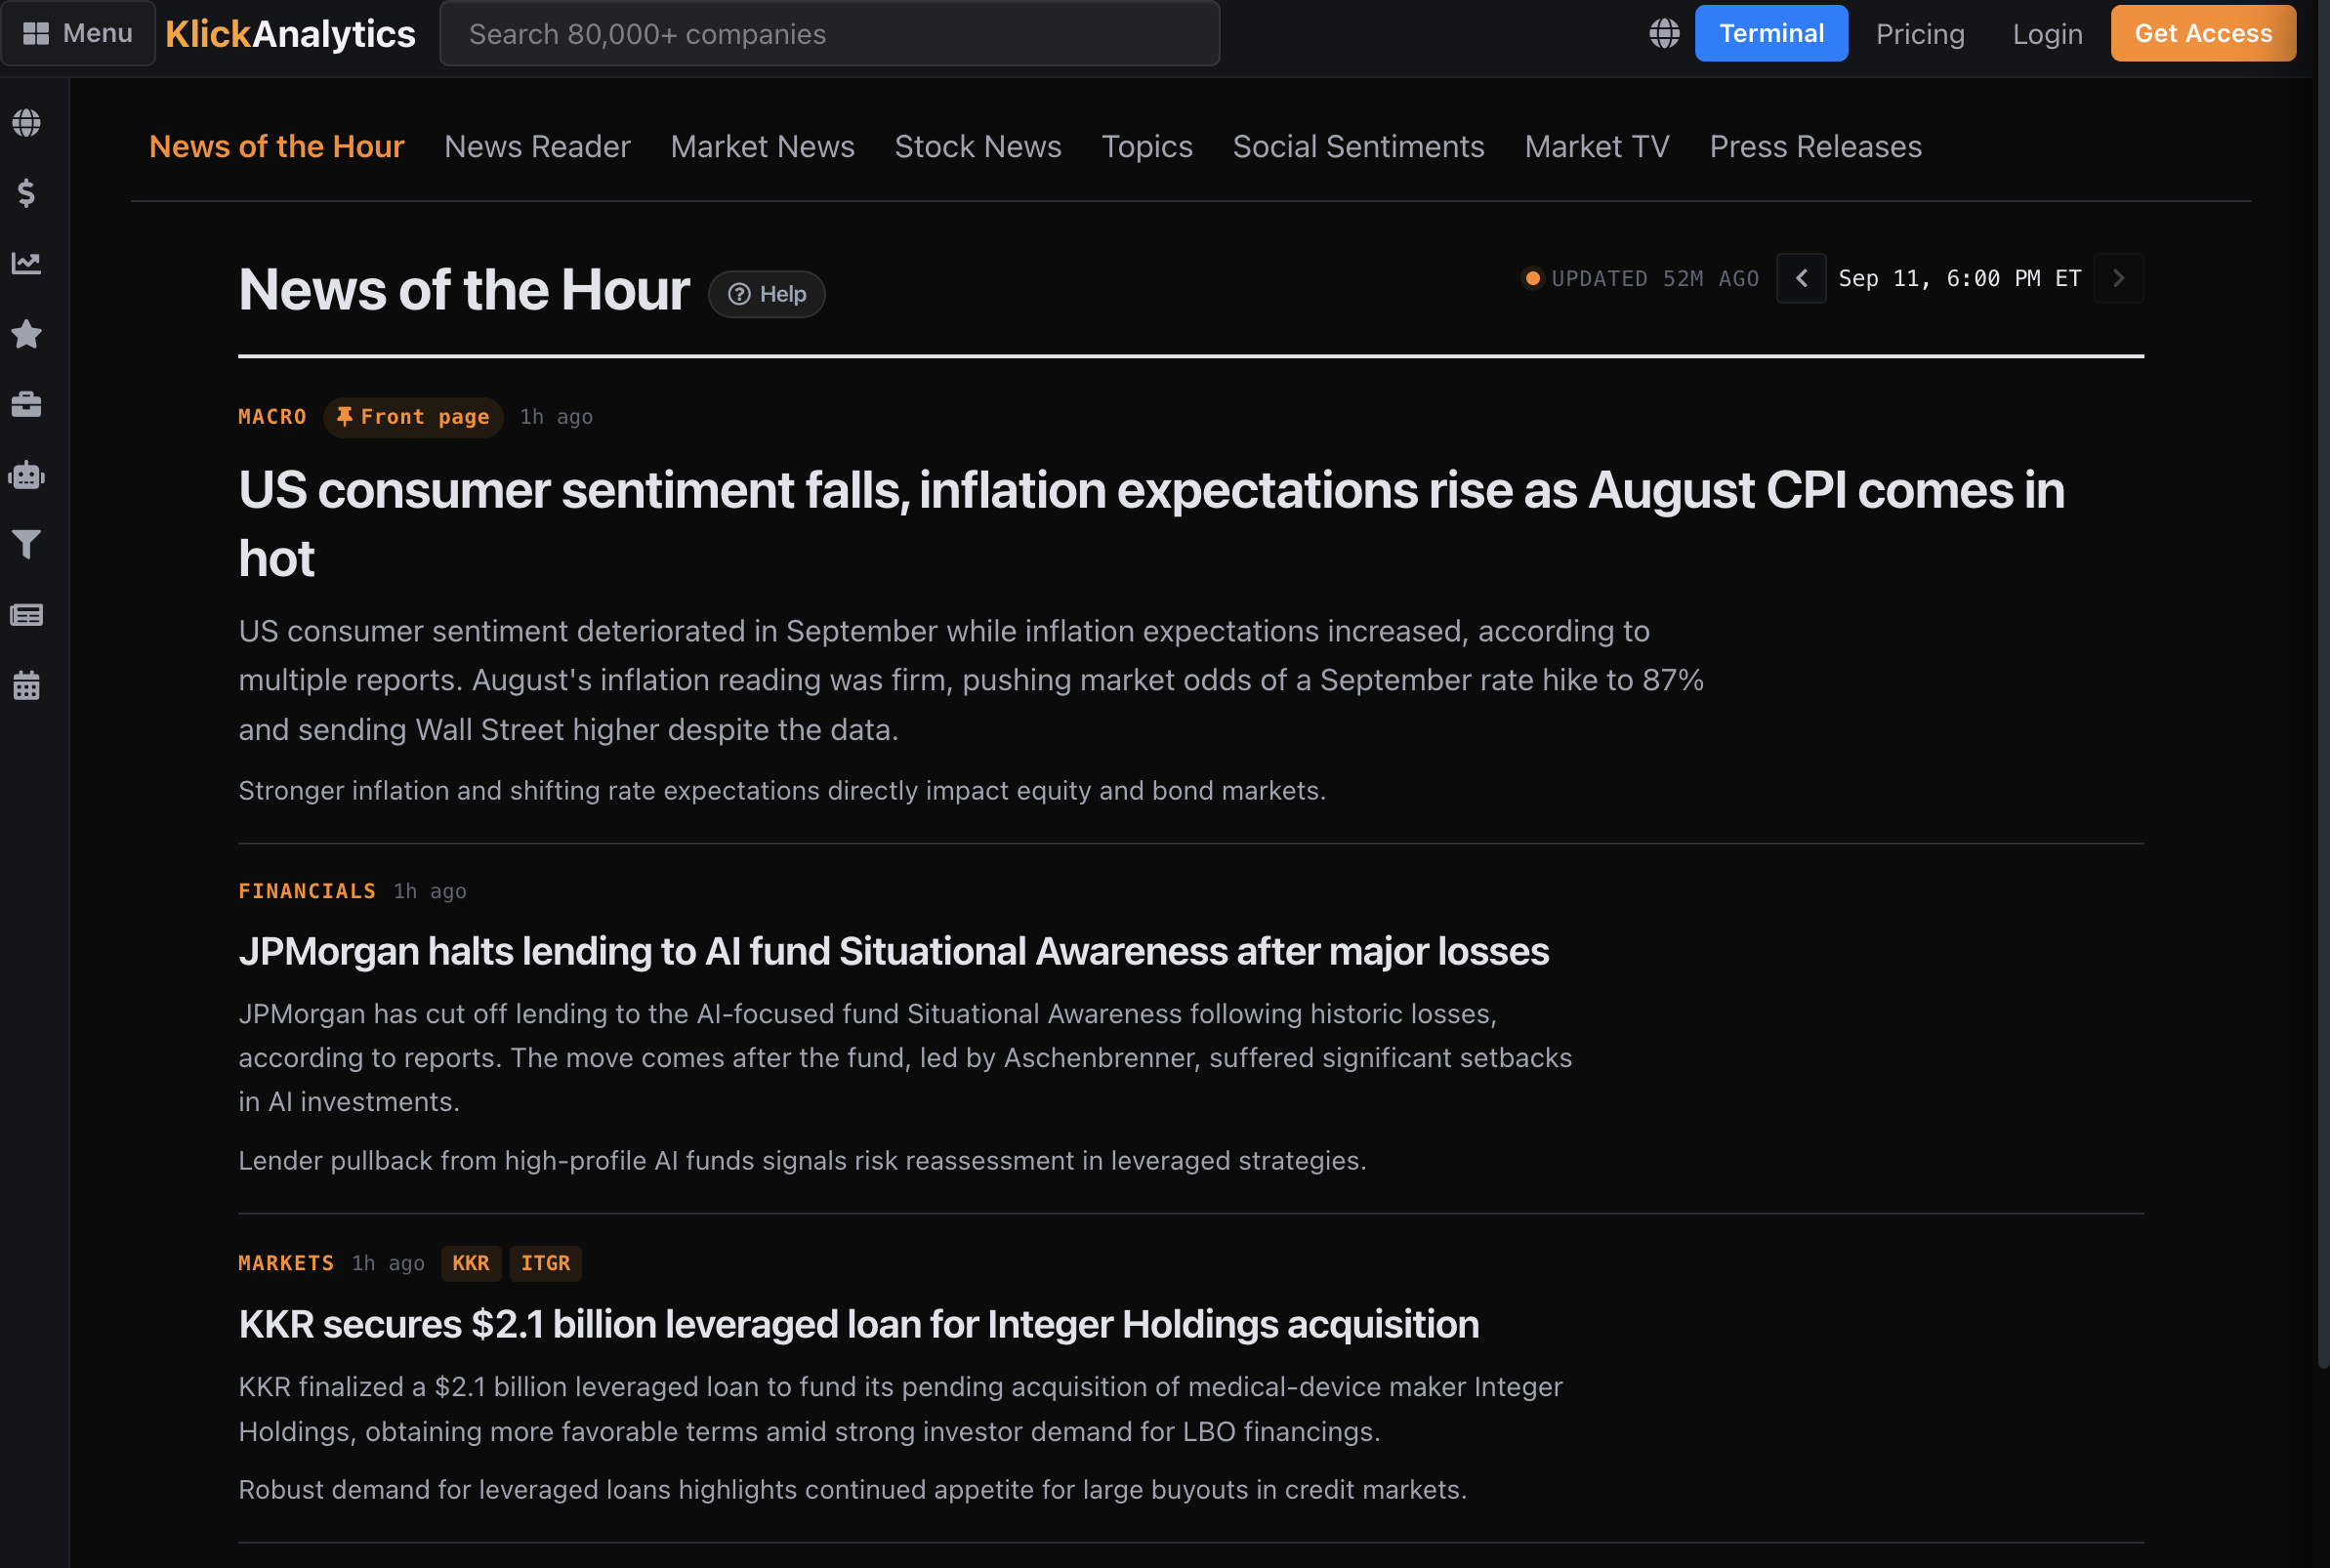
Markets move quickly, but not every headline deserves your attention.
KlickAnalytics’ new News of the Hour identifies and organizes the most important market developments from each hour—giving you a concise view of what happened, why it matters, and which companies or markets may be affected.
With News of the Hour, you can:
-
Review the most important stories from the latest hour
-
See a concise summary beneath every headline
-
Understand why each development matters to the market
-
Browse stories organized by macro, markets, financials, technology, and other major categories
-
Identify related companies through symbol tags
-
See which story has been selected for the front page
-
Move backward and forward through previous hourly editions
-
Check exactly when each edition was generated and updated
-
Quickly move into deeper news coverage across KlickAnalytics
Instead of scrolling through thousands of headlines, users receive a focused, continuously updated briefing built around market significance.
One hour. The stories that mattered. The context behind them.
To access: From the Menu > Newsroom > News of the hour
Ask the market a question. Get a calculated answer.
The AI is not a chatbot bolted onto a document store. It calls the same analytics engine that powers every screen on this platform — so what comes back is a number it computed from raw history, with the command that produced it.
86,000+ instruments
Global equities, ETFs, funds, options, FX, commodities, crypto, economics, filings, transcripts and news — one normalised symbol universe with adjusted history.
A real analytics engine
Screening, backtesting, technicals, options analytics, correlations, seasonality and factor models — computed on demand from raw prices, never a stale cache.
It shows its working
Answers arrive with the charts, tables and tool calls behind them, so you can check the number instead of trusting a paraphrase.
Your own documents
Upload filings, decks and research. Ask across them and the answer cites the page it came from.
Agents and workflows
Multi-step research that runs the platform's tools for you — screen, pull the history, compute, compare, then write it up.
MCP, CLI and API
The same command catalogue from Claude, your own agent, a shell or your pipeline. The answer on screen is the answer your job gets at 4am.
You ask
“How does NVDA usually trade through earnings?”
It calls
→ ka.options_expected_move(NVDA)
It answers
NVDA has averaged a 9.2% absolute move on the day after earnings and closed higher 67% of the time. Two in three reactions land between −4.2% and +16.3% — the distribution is skewed right, not symmetric.
Every figure computed live from our own history — not scraped, not summarised.
Or start with