What's New
Product updates, improvements and fixes across the KlickAnalytics platform.
Our Portfolio tool will tell you a story...
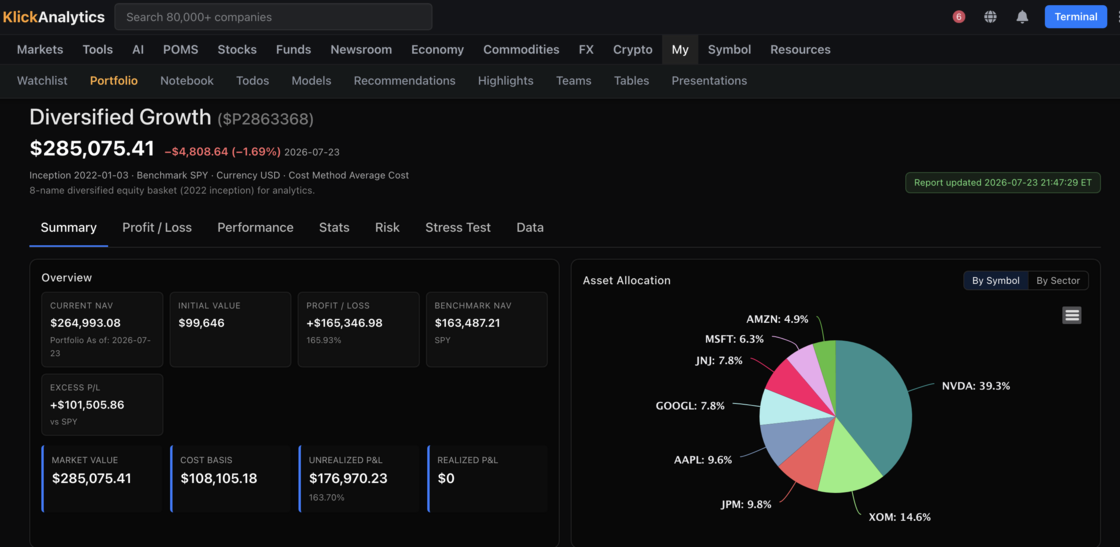
We didn't build a portfolio tracker. We built a portfolio analyst that never sleeps.
Most "portfolio dashboards" show you a number that goes up and down. Ours tells you why — and whether you actually earned it.
We just shipped a full institutional-grade portfolio suite inside KlickAnalytics 🚀 — and here's what's under the hood:
📊 Every portfolio becomes a ticker. Your holdings compound into a private performance series ($P…) you can chart, compare, and benchmark like any stock — with a proper Time-Weighted Return engine that strips out your deposits and withdrawals. No more "I added $10k and it looks like I'm up 90%." Real performance, not cash-flow illusions.
💹 Profit/Loss that reads your transactions. Net positions built straight from your trades, with expandable FIFO lots, grouping by sector / industry / country / account, weighted-average summary rows, dividend income (LTM) + yield, and a frozen-column grid you can slice like a pro terminal.
📈 Performance, the way analysts actually look at it. Total-return vs benchmark, rolling beta / volatility / Sharpe / Sortino, periodic + annual returns, upside/downside capture, worst-5 drawdowns, underwater plots, and return-quantile boxplots.
🧮 60+ risk & return metrics — Sharpe, Sortino, Calmar, Omega, Smart Sharpe, Probabilistic Sharpe, Serenity, VaR/CVaR, tail ratio, Kelly, and more — with a configurable risk-free rate and a Monte-Carlo projection of where you might land.
🌍 Stress-test against history. Drop your portfolio into the 2022 inflation shock, COVID, the GFC, the 2025 tariff turmoil — or any window you define — and see how it would've held up vs any symbol you choose.
🔎 A full Data tab — every level, return, and drawdown point, charted + tabled, comparable, and exportable.
All of it benchmark-aware, mobile-ready, private by default, and shareable with your team.
The punchline: Your broker shows you a balance. We show you a thesis. 🎯
If your portfolio can't tell you its Sortino, its capture ratio, and how it survives a 2008 — it's not a portfolio, it's a guess.
To access: From the menu, click on My > Portfolios
Ask the market a question. Get a calculated answer.
The AI is not a chatbot bolted onto a document store. It calls the same analytics engine that powers every screen on this platform — so what comes back is a number it computed from raw history, with the command that produced it.
86,000+ instruments
Global equities, ETFs, funds, options, FX, commodities, crypto, economics, filings, transcripts and news — one normalised symbol universe with adjusted history.
A real analytics engine
Screening, backtesting, technicals, options analytics, correlations, seasonality and factor models — computed on demand from raw prices, never a stale cache.
It shows its working
Answers arrive with the charts, tables and tool calls behind them, so you can check the number instead of trusting a paraphrase.
Your own documents
Upload filings, decks and research. Ask across them and the answer cites the page it came from.
Agents and workflows
Multi-step research that runs the platform's tools for you — screen, pull the history, compute, compare, then write it up.
MCP, CLI and API
The same command catalogue from Claude, your own agent, a shell or your pipeline. The answer on screen is the answer your job gets at 4am.
You ask
“How does NVDA usually trade through earnings?”
It calls
→ ka.options_expected_move(NVDA)
It answers
NVDA has averaged a 9.2% absolute move on the day after earnings and closed higher 67% of the time. Two in three reactions land between −4.2% and +16.3% — the distribution is skewed right, not symmetric.
Every figure computed live from our own history — not scraped, not summarised.
Or start with