What's New
Product updates, improvements and fixes across the KlickAnalytics platform.
Post Earning Drift
We are very excited to showcase our new app called 'Post Earning Drift'. The app allows a users to;
- View Post Earning Price Analysis
- Showcase a visual chart on all historical earning price drifts
- The current price drift
- All the main statistics per each earning dates like Min/Max, Averages, Standard Deviations and much more.
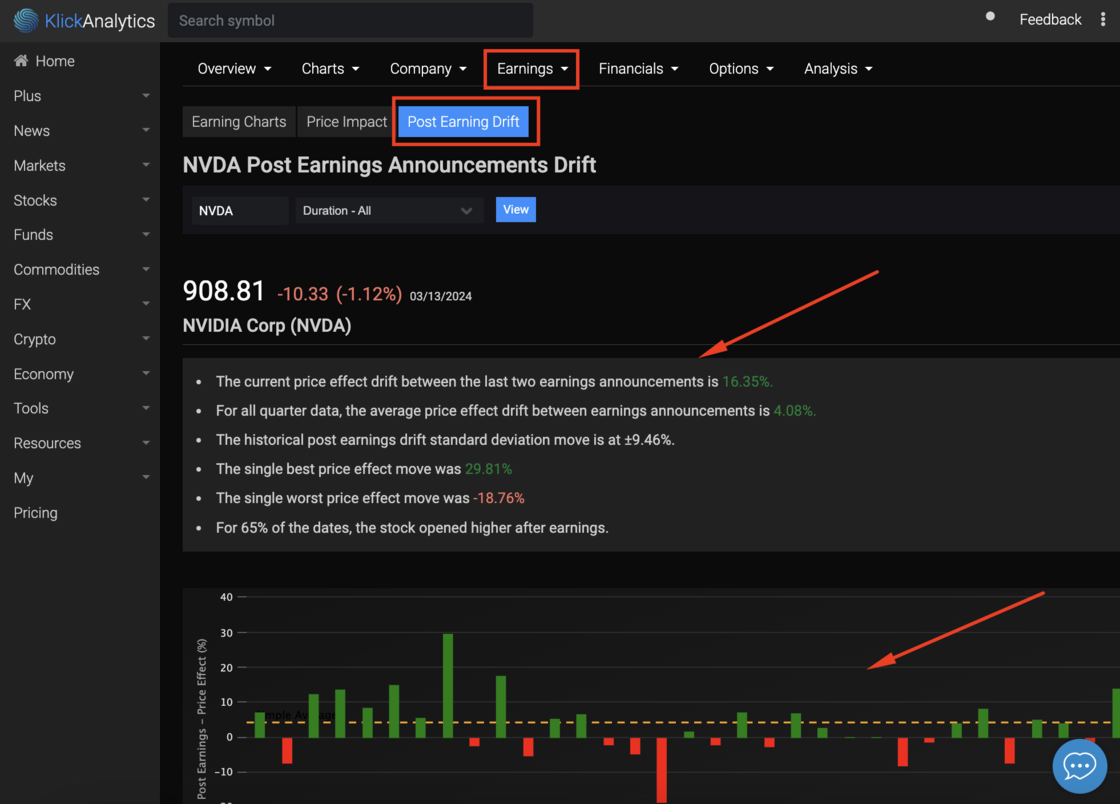
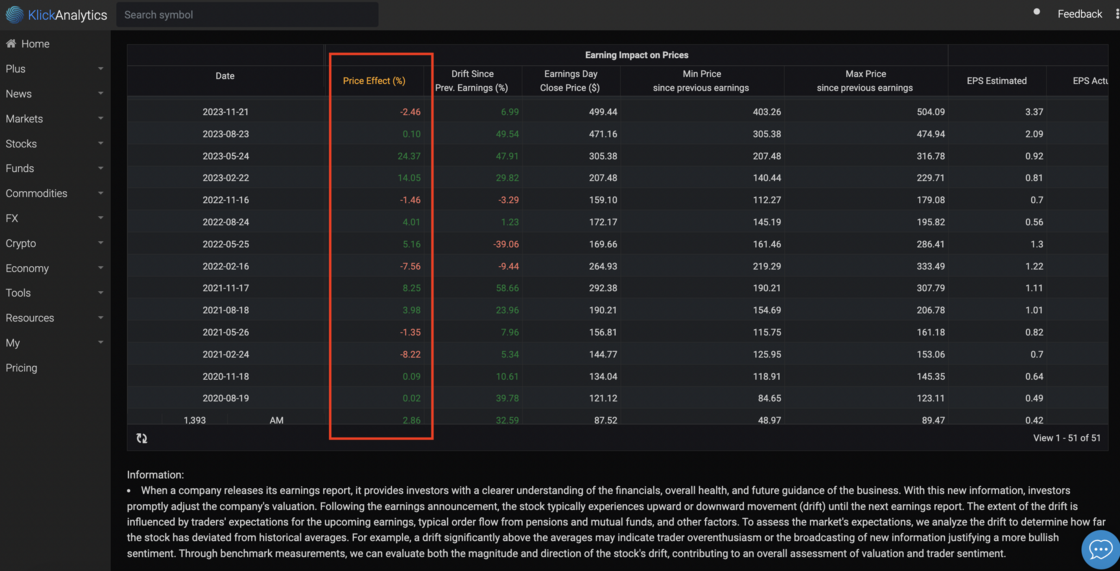
When a company reports earnings it gives investors more clarity into the financials, overall health, and forward guidance of the business. Given the new information, investors can quickly reprice the company's value. After earnings, the shares typically move up or down (drift) until the next earnings announcement. The magnitude of the drift will be based on traders' expectations of the next earnings, typical order flow from pensions and mutual funds, etc. In order to gauge the market's expectations, we measure the drift to determine how far away the stock has moved from historical averages. For instance, if the drift is way above the averages, it can indicate trader over enthusiasm or that new information has been telecast to warrant a more bullish sentiment. By measuring benchmarks, we can assess the magnitude and direction of the stock's drift as part of the overall valuation and trader sentiment.
To access: Search for any company say NVDA, and then from the top symbol menu, select Earnings > Price Impact > Post Earning Drift
Ask the market a question. Get a calculated answer.
The AI is not a chatbot bolted onto a document store. It calls the same analytics engine that powers every screen on this platform — so what comes back is a number it computed from raw history, with the command that produced it.
86,000+ instruments
Global equities, ETFs, funds, options, FX, commodities, crypto, economics, filings, transcripts and news — one normalised symbol universe with adjusted history.
A real analytics engine
Screening, backtesting, technicals, options analytics, correlations, seasonality and factor models — computed on demand from raw prices, never a stale cache.
It shows its working
Answers arrive with the charts, tables and tool calls behind them, so you can check the number instead of trusting a paraphrase.
Your own documents
Upload filings, decks and research. Ask across them and the answer cites the page it came from.
Agents and workflows
Multi-step research that runs the platform's tools for you — screen, pull the history, compute, compare, then write it up.
MCP, CLI and API
The same command catalogue from Claude, your own agent, a shell or your pipeline. The answer on screen is the answer your job gets at 4am.
You ask
“How does NVDA usually trade through earnings?”
It calls
→ ka.options_expected_move(NVDA)
It answers
NVDA has averaged a 9.2% absolute move on the day after earnings and closed higher 67% of the time. Two in three reactions land between −4.2% and +16.3% — the distribution is skewed right, not symmetric.
Every figure computed live from our own history — not scraped, not summarised.
Or start with