What's New
Product updates, improvements and fixes across the KlickAnalytics platform.
Reimagined Earning Calendar
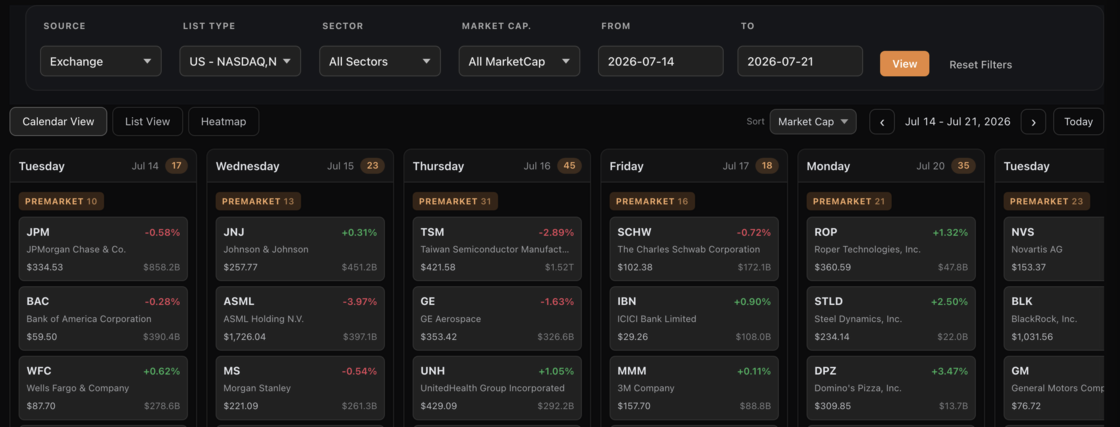
📊 New on KlickAnalytics: a completely reimagined Earnings Calendar
Knowing who reports when shouldn't take more than a glance. So we rebuilt our Earnings Calendar from the ground up — faster, smarter, and built for how traders actually work.
Here's what's new:
🗓️ Three ways to view earnings
- Calendar view — companies laid out day by day, grouped by Premarket / After Hours, sorted by market cap, % change, or volume
- List view — a fully filterable data grid
- Heatmap — an 8-week outlook that shows exactly where earnings season heats up
🎯 Filter to what matters to you
Slice the calendar by Exchange, Index, Market Groups, Collections — or your own Watchlist. Layer in Sector, Market Cap, and a custom date range to get precisely the names you care about.
🔍 Zoom into any stock
Click any company to open an instant snapshot — live quote, day / week / month / year performance, market cap, and a historical EPS chart showing beats vs. misses at a glance. Flip through companies without ever leaving the view.
⚡ Quick, clean, and fast
Jump week to week, hide the noise (parent tickers only), and get a clear read on the week ahead in seconds.
Earnings season just got a whole lot easier to navigate.
👉 To view: Click on Stocks > Earnings
Ask the market a question. Get a calculated answer.
The AI is not a chatbot bolted onto a document store. It calls the same analytics engine that powers every screen on this platform — so what comes back is a number it computed from raw history, with the command that produced it.
86,000+ instruments
Global equities, ETFs, funds, options, FX, commodities, crypto, economics, filings, transcripts and news — one normalised symbol universe with adjusted history.
A real analytics engine
Screening, backtesting, technicals, options analytics, correlations, seasonality and factor models — computed on demand from raw prices, never a stale cache.
It shows its working
Answers arrive with the charts, tables and tool calls behind them, so you can check the number instead of trusting a paraphrase.
Your own documents
Upload filings, decks and research. Ask across them and the answer cites the page it came from.
Agents and workflows
Multi-step research that runs the platform's tools for you — screen, pull the history, compute, compare, then write it up.
MCP, CLI and API
The same command catalogue from Claude, your own agent, a shell or your pipeline. The answer on screen is the answer your job gets at 4am.
You ask
“How does NVDA usually trade through earnings?”
It calls
→ ka.options_expected_move(NVDA)
It answers
NVDA has averaged a 9.2% absolute move on the day after earnings and closed higher 67% of the time. Two in three reactions land between −4.2% and +16.3% — the distribution is skewed right, not symmetric.
Every figure computed live from our own history — not scraped, not summarised.
Or start with