What's New
Product updates, improvements and fixes across the KlickAnalytics platform.
View all the main traders stats!
🚀 Introducing Trader Stats - Your Ultimate Trading Companion! 📈
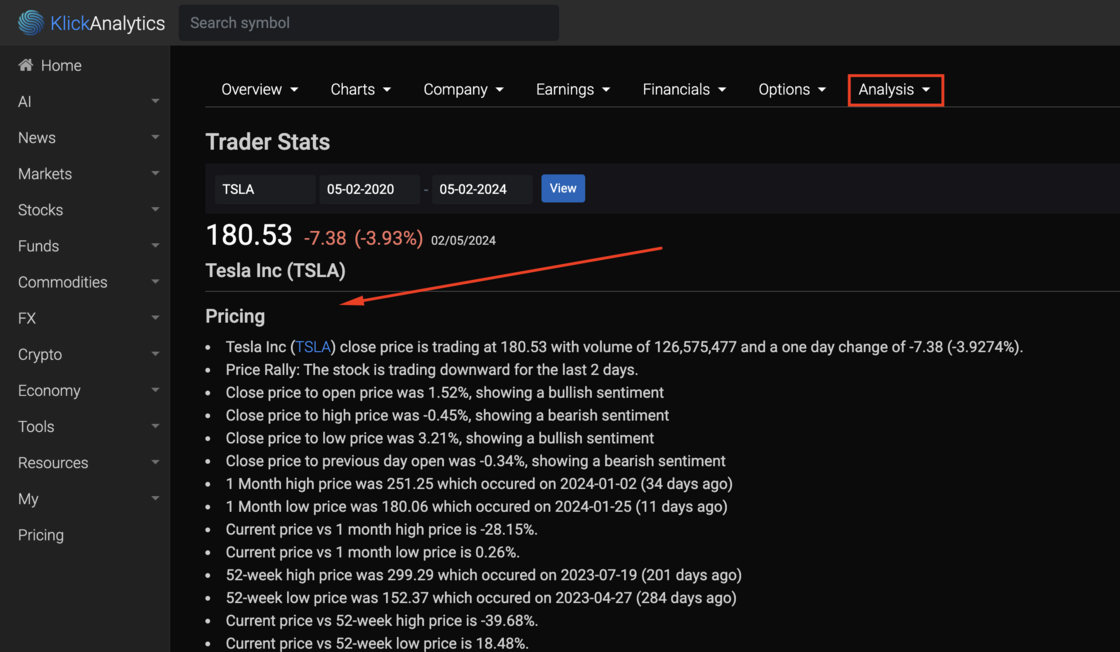
Exciting news! We're thrilled to introduce our latest app, Market Insights, designed to provide investors with a robust set of tools for analyzing market trends across various securities. Here's a glimpse of what our app offers:
Pricing Overview: Explore real-time pricing data for your chosen security, including close price, trading volume, and one-day percentage change. Gain valuable insights into price movements and sentiments with indicators like price rally, close price to open, high, low, and previous day open.
Historical Performance: Track the security's historical journey over different timeframes, including one month and 52 weeks. Evaluate the current price against highs and lows, and delve into historical returns and relative volume for a comprehensive understanding of its performance.
Technical Indicators: Analyze short-term, medium-term, and long-term moving averages to identify potential trends. The app provides SMA signals, close price comparisons, and technical indicators to aid in making well-informed trading decisions.
Volatility and Volume Analysis: Dive into volatility trends over various durations and explore volume statistics. Whether it's the highest or lowest volume in the last 7, 30, 60, 90, 180, or 365 days, Market Insights keeps you informed about market dynamics.
Market Indicators and Analysis: Discover trend insights based on SMA 50/200, RSI, Bollinger Bands, MACD, ADX, CCI, and more. Uncover potential buy or sell signals, trend strength, and volatility metrics applicable to a wide range of securities.
Market Insights is your all-in-one tool for thorough market analysis, providing a wealth of information to enhance your trading decisions across various securities. Download the app now and elevate your investment strategy!
To access: Search for any symbol say TSLA, and then from the symbol menu, select Analysis > [Trader Stats](https://klickanalytics.com/symbol_trader_stats?s=TSLA)
Ask the market a question. Get a calculated answer.
The AI is not a chatbot bolted onto a document store. It calls the same analytics engine that powers every screen on this platform — so what comes back is a number it computed from raw history, with the command that produced it.
86,000+ instruments
Global equities, ETFs, funds, options, FX, commodities, crypto, economics, filings, transcripts and news — one normalised symbol universe with adjusted history.
A real analytics engine
Screening, backtesting, technicals, options analytics, correlations, seasonality and factor models — computed on demand from raw prices, never a stale cache.
It shows its working
Answers arrive with the charts, tables and tool calls behind them, so you can check the number instead of trusting a paraphrase.
Your own documents
Upload filings, decks and research. Ask across them and the answer cites the page it came from.
Agents and workflows
Multi-step research that runs the platform's tools for you — screen, pull the history, compute, compare, then write it up.
MCP, CLI and API
The same command catalogue from Claude, your own agent, a shell or your pipeline. The answer on screen is the answer your job gets at 4am.
You ask
“How does NVDA usually trade through earnings?”
It calls
→ ka.options_expected_move(NVDA)
It answers
NVDA has averaged a 9.2% absolute move on the day after earnings and closed higher 67% of the time. Two in three reactions land between −4.2% and +16.3% — the distribution is skewed right, not symmetric.
Every figure computed live from our own history — not scraped, not summarised.
Or start with