What's New
Product updates, improvements and fixes across the KlickAnalytics platform.
67 updates · clear
Full-history Financials (20+ yrs)
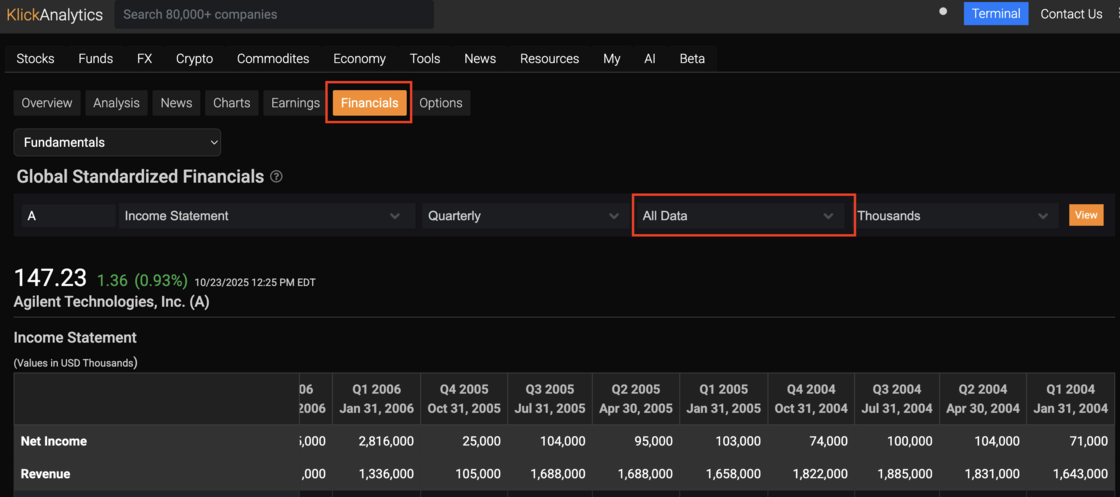
Deep-dive fundamentals for any global ticker—annual or quarterly—all at once.
Switch the range to “All Data” on the Financials tab and explore full-history Income Statement, Balance Sheet, and Cash Flow. Perfect for long-cycle analysis, valuation studies, and factor research for 20+ years and more.
To access: Search for a company say NVDA, and then from the symbol menu > Financials
Dividend Yield Metrics added
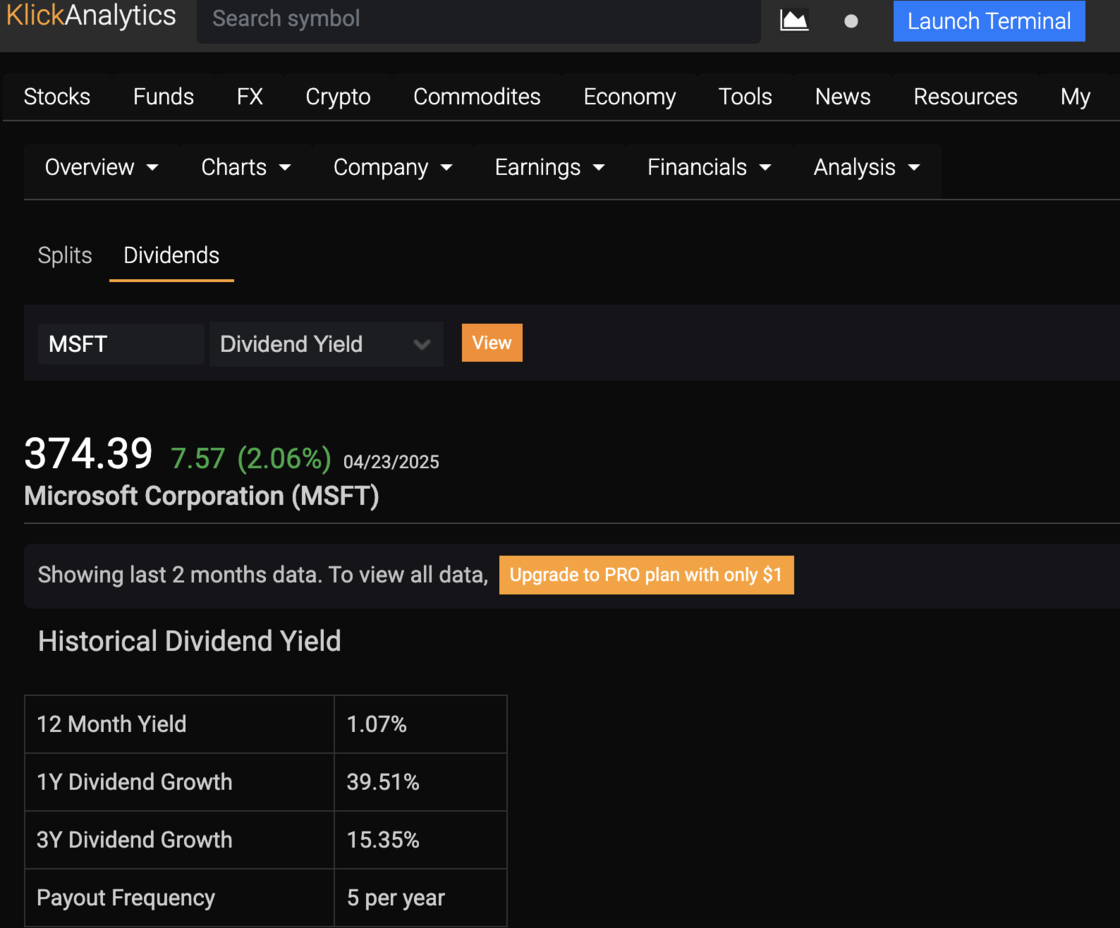
We've enhanced our company dividend yield module to include additional metrics like 12 Month Dividend Yield, 1 Year/3 Years Dividends Growth and Payout frequency.
To access: Search for any symbol say MSFT, and then click on Company > Dividends > Dividend Yield
Filter movers by equity, funds and ETFs
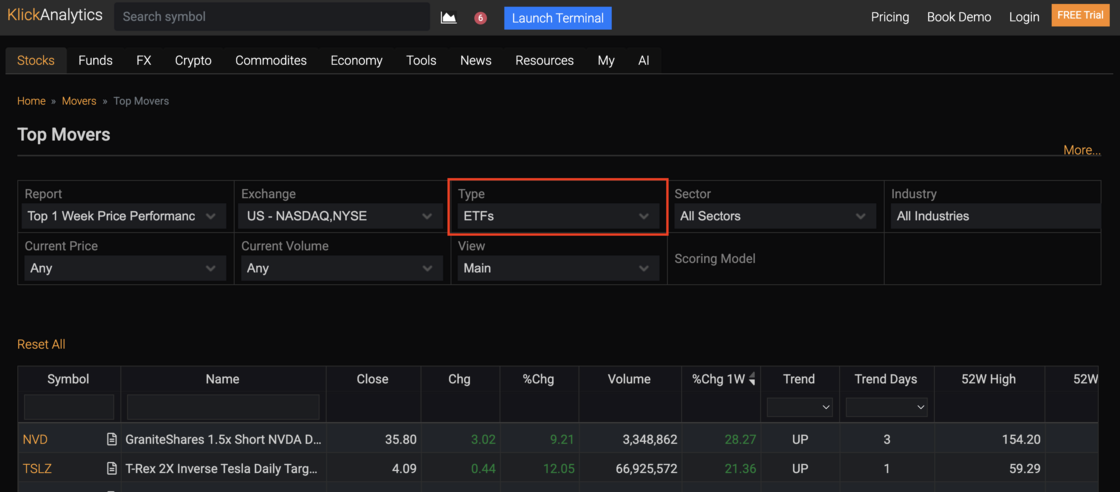
We’ve supercharged the Movers widget with an Instrument‑Type selecting!
Now you can instantly filter top movers across Equities, Mutual Funds, and ETFs in a single click. This lets you hone in on exactly the asset classes you care about, combine type filters with sectors or volume thresholds, and uncover the most relevant opportunities faster than ever.
To access: Click on Stocks > Movers
New Global Navigation System!
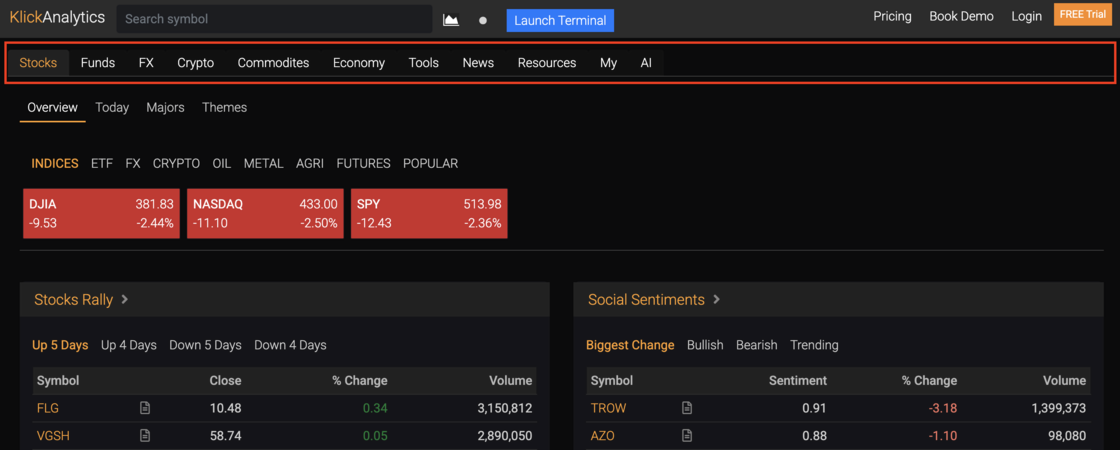
We've enhanced our Global Navigation System.
Our new top‑level navigation bar gives you instant, one‑click access to every global asset class—from Stocks and Funds to FX, Crypto, Commodities, Economy, and beyond, via a clean, hover‑activated dropdowns.
Simply click your category of choice to reveal all the related tools and mini‑apps (Movers, Screeners, Charts, Price Distributions, etc.) in a single, organized list. The result is a smooth browsing experience that puts all your analytics, news feeds, and trading utilities just a tap away—no digging through menus or multiple clicks required.
Multi‑Tab Terminal Dashboard
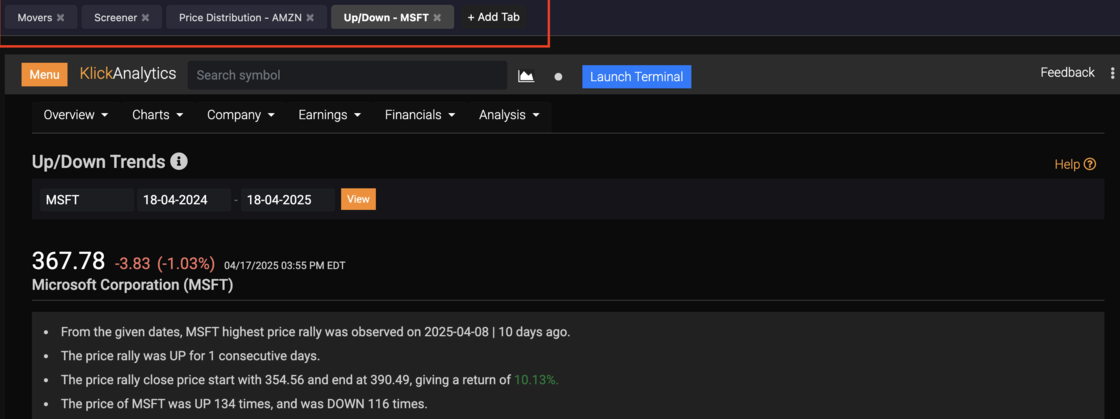
Our users can now view global information side by side within each "Tabs". i.e.
Multi‑Tab Terminal Mode
Enable users to spin up multiple, customizable “tabs”—each a mini‑terminal—that can be arranged side‑by‑side for rapid lookup, comparison, and workflow continuity.
Named & Pinned Tabs
Users can create, rename and pin tabs (e.g. “Up/Down Trends,” “Screener,” “News Feed”), so key views are always one click away.
We are provided an integrated global research platform where users can easily access, analyze, compare global markets information and much more.
Show/Hide filters on global screener
We've improved our global screener with a user-friendly filter toggle. Now, users can effortlessly display or hide filters by clicking "Show Filters" or "Hide Filters," ensuring immediate access to their results.
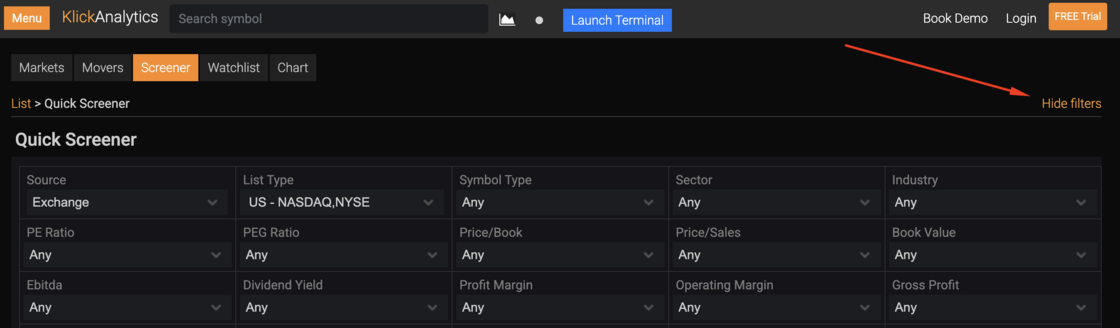
To view: Click Menu > Tools > Screeners
KlickAnalytics going Global!
KlickAnalytics Expands to Include Global Stock Exchanges!
KlickAnalytics is excited to announce the addition of a wide range of global stock exchanges to its platform. Users can now seamlessly track market data from exchanges around the world, including major ones like:
- Athens
- Australia
- Austria
- Brazil
- Budapest
- Buenos Aires
- Canada (CSE, NEO, TSX)
- Chile
- Denmark
- Finland
- France
- Germany
- Hong Kong
- India (BSE, NSE)
- Indonesia
- Japan
- South Africa
- South Korea
- United Kingdom
- Malaysia
- Mexico
- Italy
- Russia
- New Zealand
- Norway
- Poland
- Czech Republic
- Qatar
- Saudi Arabia
- China (Shanghai, Shenzhen)
- Singapore
- Spain
- Sweden
- Switzerland
- Taiwan
- Thailand
- Turkey
- United States (All Exchanges, NASDAQ, NYSE, AMEX, PNK Stocks)
- and more.
With these new exchanges added, KlickAnalytics continues to provide broader market coverage, helping users stay informed and make data-driven decisions globally.
Leverage Market Themes
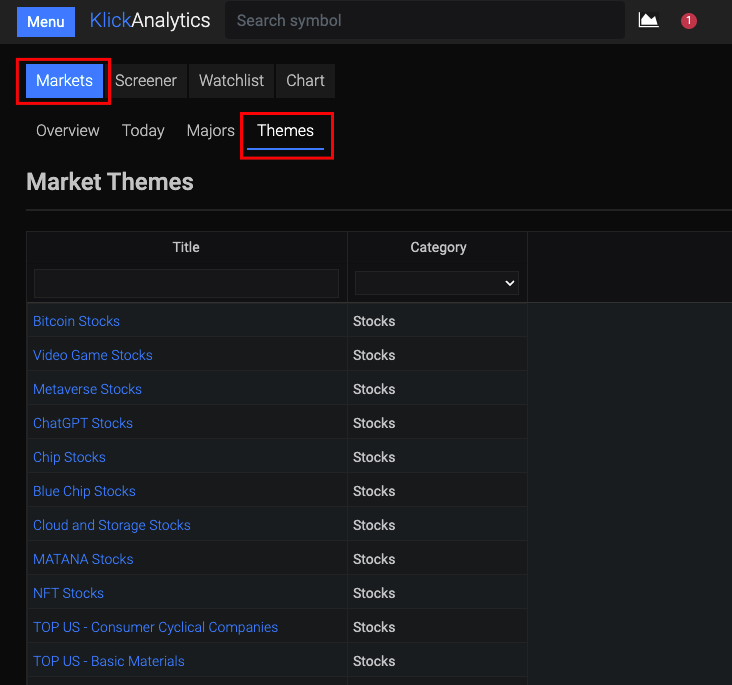
We are a data science company, where we look at various major groups and themes in the markets. These themes combine similar stocks together to form a theme. e.g. Access major ChatGPT Stocks, Blue Chip Stocks, Video Game stocks and more. As of now, we have around 154+ themes curated for you to help you look at a particular themes for investment opportunities and much more.
To access: Click 'Menu' > Markets > Themes
View key instruments performance
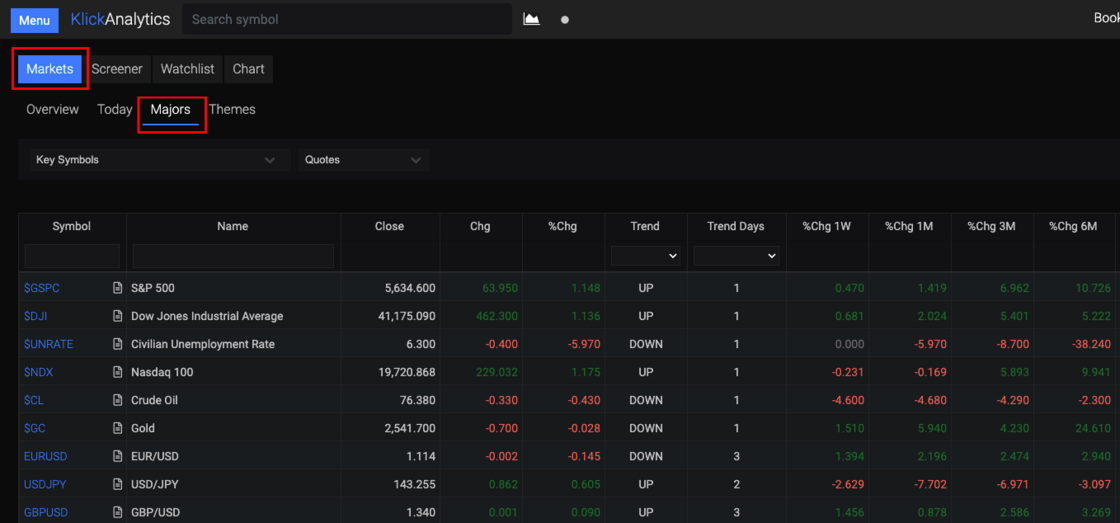
Our users can now quickly access all the major instruments performance in a single glance. Select major indices, ETFs, Factor Instruments and much more.
To access: Click Menu > Home > Markets > Majors
Pre/Post Market Movers
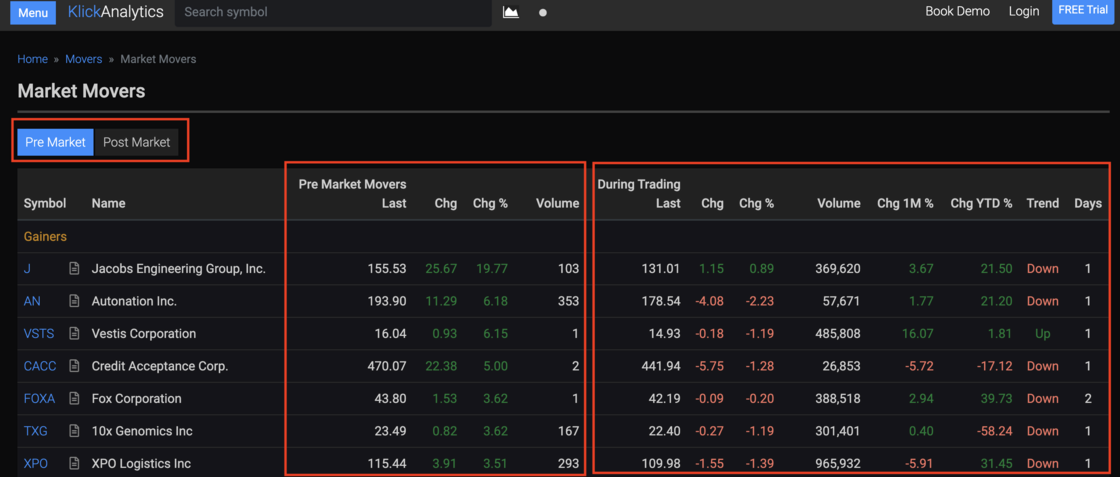
We have enhanced our pre/post market app, where our users now can;
- View the pre market movers with last, chg $, chg %, and volume information
- Also it display side-by-side 'During Trading' information like last, chg $, chg %, volume, change 1 month, change year-to-date, current trend up/down with number of days the instrument is rally.
- The pre/post and during trading market information side-by-side will allow the user to quickly view the overall changes from pre/post market to during trading e.g. how much the volume changes and much more.
To access: From the top menu, click on 'Menu' > Stocks > Movers > Pre Market
Ask the market a question. Get a calculated answer.
The AI is not a chatbot bolted onto a document store. It calls the same analytics engine that powers every screen on this platform — so what comes back is a number it computed from raw history, with the command that produced it.
86,000+ instruments
Global equities, ETFs, funds, options, FX, commodities, crypto, economics, filings, transcripts and news — one normalised symbol universe with adjusted history.
A real analytics engine
Screening, backtesting, technicals, options analytics, correlations, seasonality and factor models — computed on demand from raw prices, never a stale cache.
It shows its working
Answers arrive with the charts, tables and tool calls behind them, so you can check the number instead of trusting a paraphrase.
Your own documents
Upload filings, decks and research. Ask across them and the answer cites the page it came from.
Agents and workflows
Multi-step research that runs the platform's tools for you — screen, pull the history, compute, compare, then write it up.
MCP, CLI and API
The same command catalogue from Claude, your own agent, a shell or your pipeline. The answer on screen is the answer your job gets at 4am.
You ask
“How does NVDA usually trade through earnings?”
It calls
→ ka.options_expected_move(NVDA)
It answers
NVDA has averaged a 9.2% absolute move on the day after earnings and closed higher 67% of the time. Two in three reactions land between −4.2% and +16.3% — the distribution is skewed right, not symmetric.
Every figure computed live from our own history — not scraped, not summarised.
Or start with