What's New
Product updates, improvements and fixes across the KlickAnalytics platform.
142 updates · clear
Create market events and see their impact analysis
Study what happens to asset prices when an event occurred?
Market events like a sudden jump or drop in a major exchange, major stock prices volatility moves up or down and more impact asset prices movements. It is important to know and understand these events to help align trading strategies and more, but there is no custom tool to achieve that?
To solve this problem, we've enhanced a new app called "Market Events" app, which will allow our users to;
Define Event
View existing market events examples e.g. When Dow falls 5%
Ability to create your own market event
Ability to define your own formula
Define time range
Define trading strategies
When to buy or sell an asset say on
Market event date
Before/After Market event
Define asset class universe
Ability to define custom symbols
Ability to include symbols from
Collections
Markets groups or even
from your own watchlist
Run Analysis
View how many time your event occurred?
See event data distribution by month and year
See the best instruments in terms of best average returns
View historical buy/sell trades for further analysis
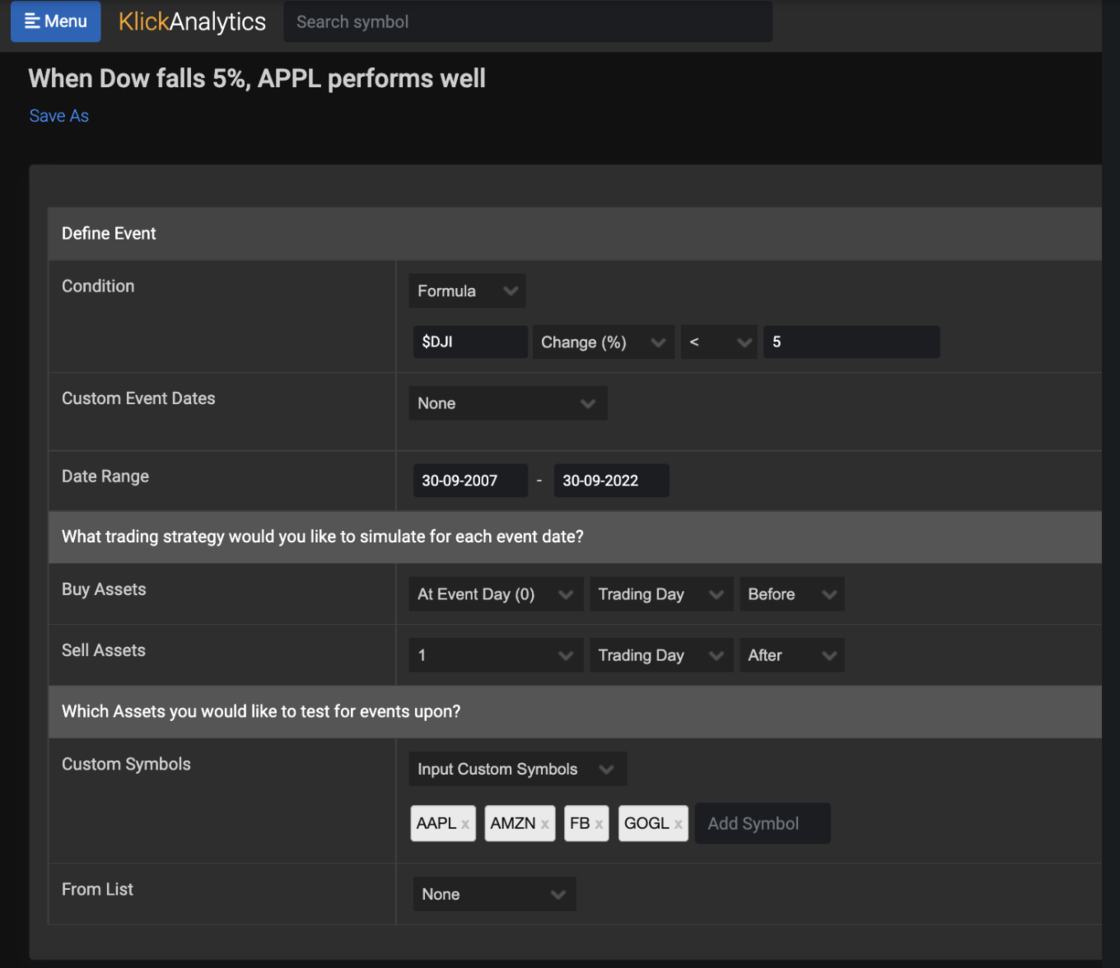
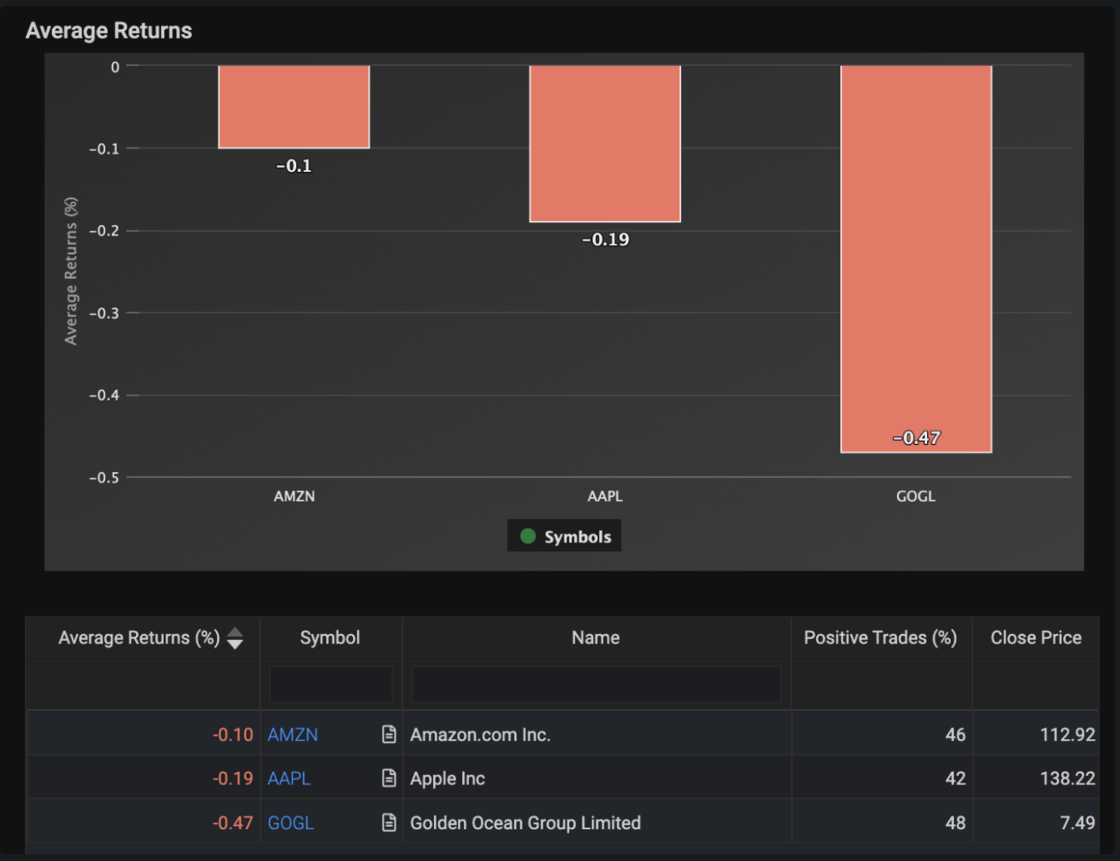
The above tool will allow you to define all sort of markets events so that you can run analysis on your own stocks, crypto, index, ETFs and more to see how they perform during those event.
To view: From the top menu, select Tools > Market Events
Find movers where today's price > previous day high price
Now you can view the movers where current price > previous day high price via our Movers app.
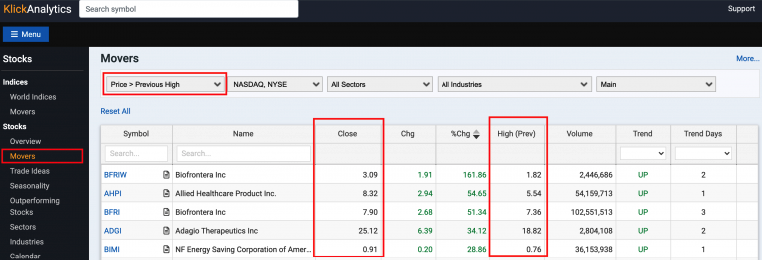
You can even filter more records by exchange, sectors, industries and more.
To access: Click on Menu > Movers. Select the drop down 'Price > Previous High'
View top gainers on high volume
Now you can view the top gainers on high volumes via our Movers app.
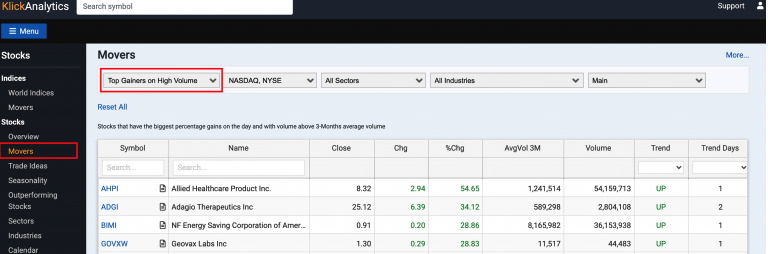
You can even filter more records by exchange, sectors, industries and more.
To access: Click on Menu > Movers. Select the drop down 'Top Gainers on High Volume'
Linear Regression via Machine Learning
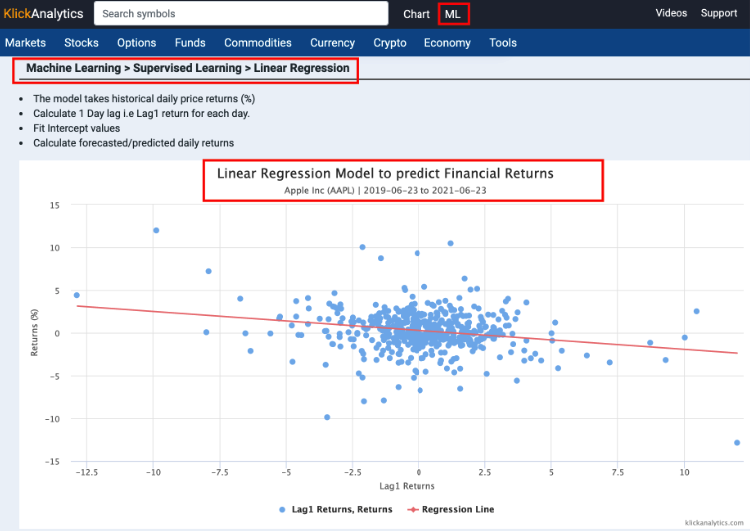
To leverage the advancements in machine learning and more, we've added a new module to calculate the Linear Regression via machine learning. The new app 'Linear Regression'. The app will use the machine learning i.e.
The user will be able to select any global instrument e.g. Stocks, ETFS, Funds, Index, Commodities, Currency, Crypto
Set the duration of dates
The app will then take daily historical returns for the said symbol
Calculate the daily LAG1 returns i.e. Return of 1-Day before for each day
Run machine learning model to predict returns on above data set
Calculate the linear regression model by apply the fit for
Daily LAG1 return
Daily return
Calculate the linear regression line
Calculate the predicted returns based on the linear model
Provide a scatter plot to visualize the daily LAG1 returns, returns and regression line
The time series chart also provide a way to view the returns vs predicted returns and to see how many times the predicted returns direction was correct i.e. If the predicted returns and daily returns directions are same, it is considered a good forecasted direction.
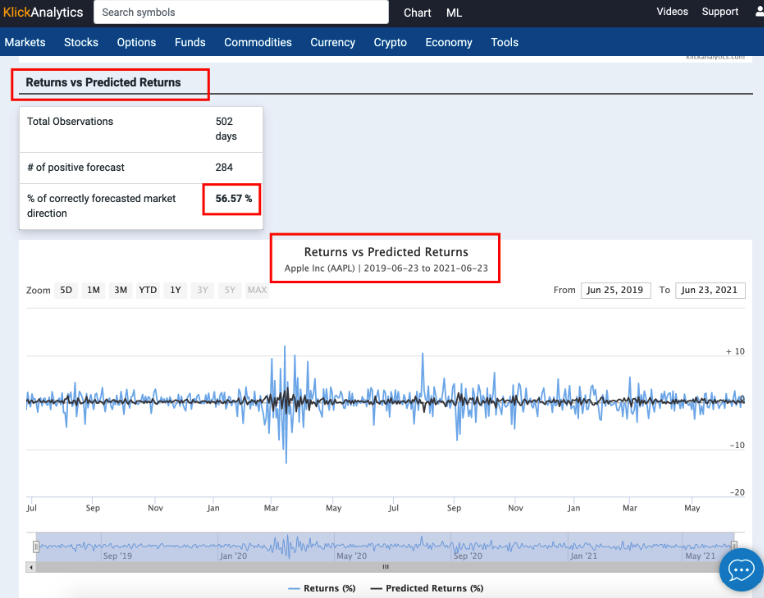
Also it provides stats like;
number of observations i.e Number of trading days,
of positive forecast
% of positive forecasted returns within the model
This is the very first Machine Learning model among the many more models to come at KlickAnalytics.com
To access: From the top bar, Click ML > Linear Regression
Automated data news for you!
KlickAnalytics is a data company. We always look at ways and means to help our users to uncover data insights and more. With that, we've added a new app called 'Data News'.
Data News is a internal robot that will scan current and historical market data and find all important event. The information are organized into various reports like;
Top Volume Leaders
Top Gainers ($)
Top Gainers (%)
Top Losers ($)
Top Losers (%)
Sector Performances
Top/Bottom - Open to Close Gaps
Top/Bottom - High to Close Gaps
Top/Bottom - Low to Close Gaps
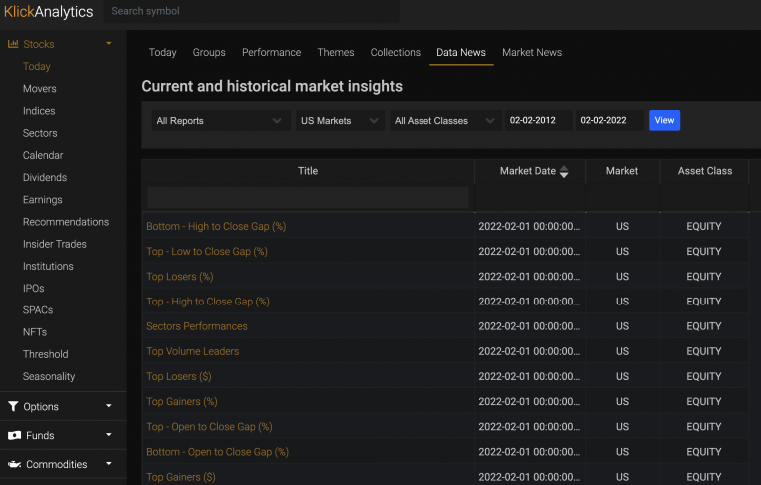
We are constantly adding more and more reports for our users. To access all these reports, we have provided a simple interface where our users can select a report type, market, asset class type and even defined a custom date range to view all reports for that date and more.
These reports are calculated at the end of the market. We have these reports compiled from year 2000 onwards. Currently we have around 55,000+ reports stored in our system and we are adding more and more.
To view: From the left menu, click Stocks > Today > Data News
Global symbol search with exchange information
KlickAnalytics provide global financial markets information with thousands of companies traded in multiple exchanges. We've enhanced our auto-complete search functionality so that when you search a symbol, it will display;
Symbol Name
Exchange/Country short name
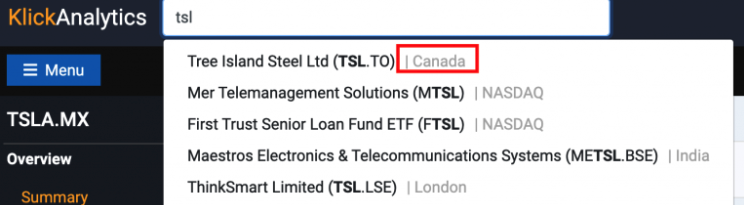
Now you can see both the symbol name and its associated exchange or country information within auto-complete.
To access: From the top bar, search any global symbol.
Market FAQs
Investors always look at finding answers from the market, so to solve this problem, we've created a new app called 'Markets FAQs', where;
We will list the most common questions, an investor normally seek
These questions will be grouped into several categories like Global Markets, Company Analysis, Recommendations, and more.
Our user can filter FAQs based on;
categories,
filter results with search or
even look at FAQs which contains a video walkthrough
For each FAQ, when click will lead you to the respected KlickAnalytics app for an answer
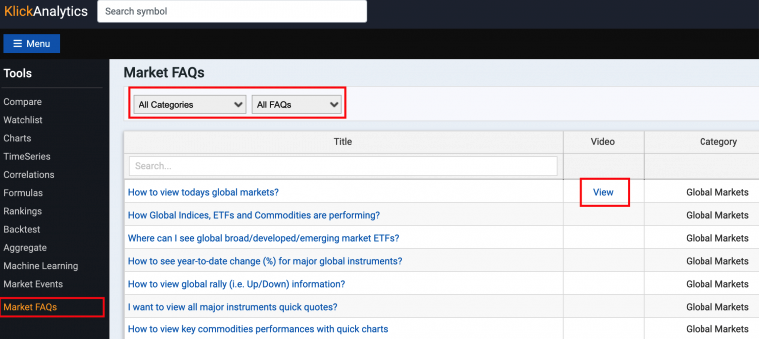
We have around 100+ common market FAQs at the moment, and we will be adding more investors' FAQs more and more.
To access: Click on Menu > Market FAQs
Filter best stocks by fundamental ratings
Fundamental analysis plays an important role in evaluating a company strengths and more. Now you can filter best stocks by fundamental ratings and more.
We take the following fundamental data items in our calculations;
DCF - Discounted Cash Flow
ROE - Return on Equity
ROA - Return on Assets
Debt to equity ratio
Price to earnings ratio
Price to book ratio
For a detail explanation of the calculations, click here.
We will have the following ratings for each US listed companies
Strong Buy
Buy
Neutral
Sell
Strong Sell
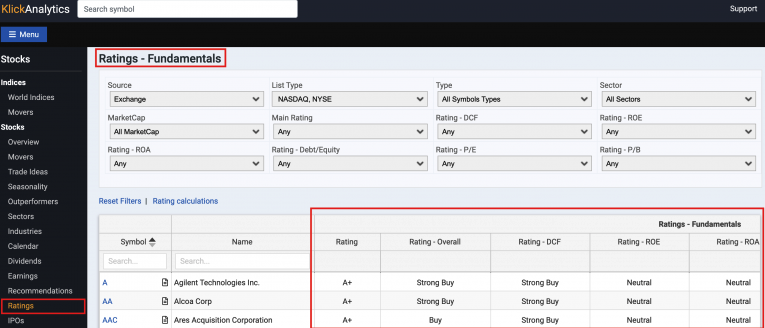
You can view ratings based on;
Total Rating
Rating - DCF
Rating - ROE
Rating - ROA
Rating - Debt/Equity
Rating - Price to earning ratio
Rating - Price to book ratio
You can even filter the records based on an exchange, sector, companies within an index, themes based companies, or even watchlist.
To access: From the top menu, click Menu > Ratings
Please note that the above ratings are purely for education purpose and does not constitute any recommendations of any type of trading at all. Please take this purely for education purposes only.
View all historical earning call transcripts
We've added a new app which allows you to look at current and historical earnings call transcript for all US listed companies.
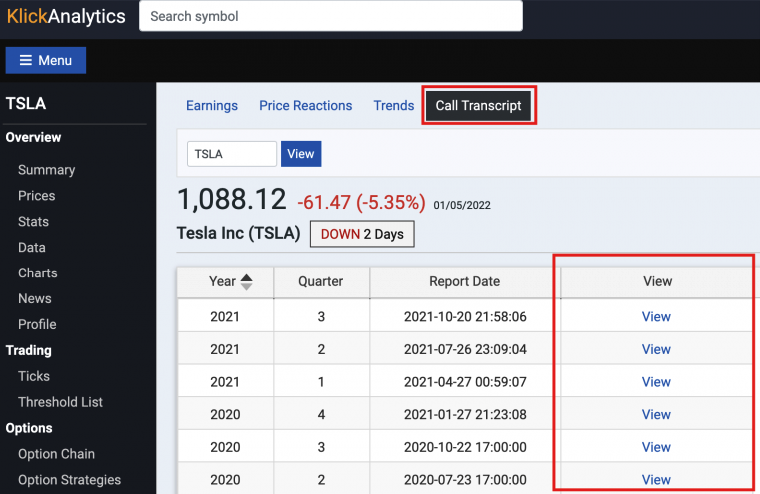
KlickAnalytics provides call scripts from 2006 onwards for companies.
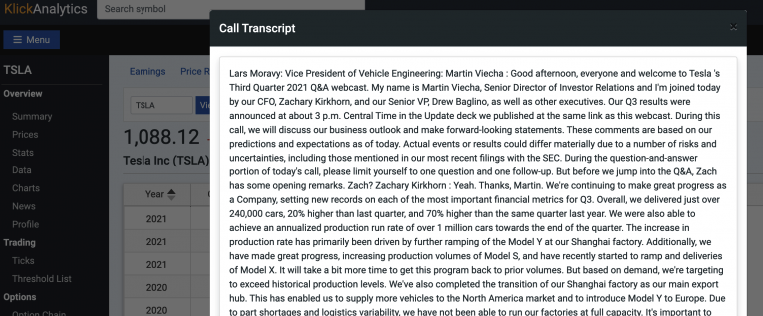
Now our users can access all the earnings call transcripts to see actual call details for even further analysis.
To access: Search for a company say TSLA, and then from the left symbol menu > Earnings > Call Transcript
Ask the market a question. Get a calculated answer.
The AI is not a chatbot bolted onto a document store. It calls the same analytics engine that powers every screen on this platform — so what comes back is a number it computed from raw history, with the command that produced it.
86,000+ instruments
Global equities, ETFs, funds, options, FX, commodities, crypto, economics, filings, transcripts and news — one normalised symbol universe with adjusted history.
A real analytics engine
Screening, backtesting, technicals, options analytics, correlations, seasonality and factor models — computed on demand from raw prices, never a stale cache.
It shows its working
Answers arrive with the charts, tables and tool calls behind them, so you can check the number instead of trusting a paraphrase.
Your own documents
Upload filings, decks and research. Ask across them and the answer cites the page it came from.
Agents and workflows
Multi-step research that runs the platform's tools for you — screen, pull the history, compute, compare, then write it up.
MCP, CLI and API
The same command catalogue from Claude, your own agent, a shell or your pipeline. The answer on screen is the answer your job gets at 4am.
You ask
“How does NVDA usually trade through earnings?”
It calls
→ ka.options_expected_move(NVDA)
It answers
NVDA has averaged a 9.2% absolute move on the day after earnings and closed higher 67% of the time. Two in three reactions land between −4.2% and +16.3% — the distribution is skewed right, not symmetric.
Every figure computed live from our own history — not scraped, not summarised.
Or start with