What's New
Product updates, improvements and fixes across the KlickAnalytics platform.
142 updates · clear
See the Expected Move Before Earnings
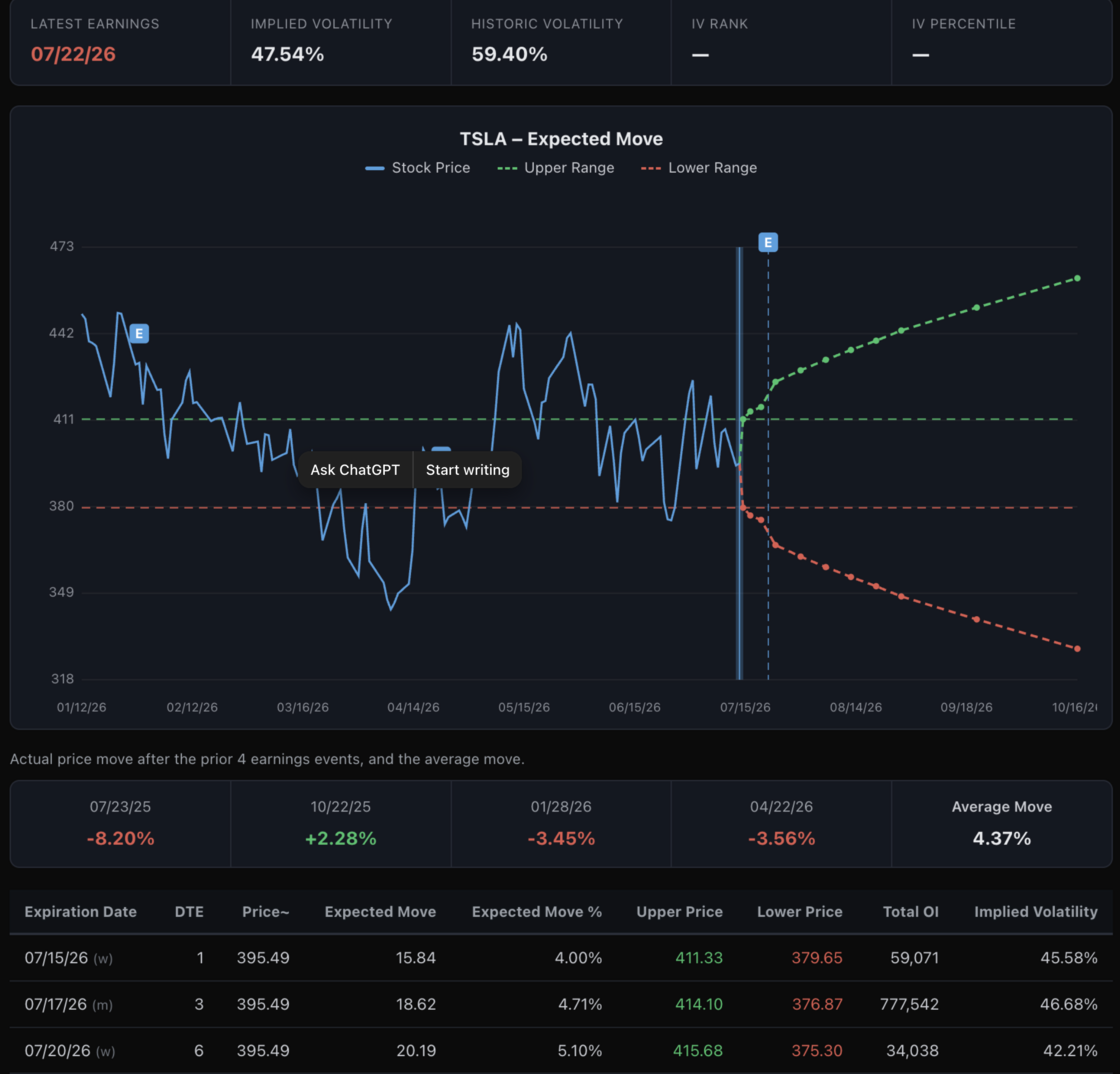
KlickAnalytics now gives you a dedicated Expected Move view for any symbol, helping you quickly understand how the options market is pricing upcoming volatility.
Track key data such as latest earnings date, implied volatility, historic volatility, IV Rank, IV Percentile, expected move amount, expected move %, upper and lower price ranges, days to expiration, open interest, and implied volatility by expiration—all in one place.
You can also view the projected move visually on the chart, compare it with the actual price moves from prior earnings events, and see the average historical move to better judge whether the current options market is pricing a bigger or smaller reaction than usual.
It’s a fast, practical way to analyze earnings risk, volatility expectations, and potential trading ranges before the event.
To view: search for any symbol say TSLA, and then click on Analysis > Options > Expected move
One plan, everything included
We just simplified KlickAnalytics to one plan.
The entire AI + quant + research + automation stack — AI agents, backtests, real-time data, custom formulas, CLI & MCP, workflows, client & team tools — no tiers, nothing held back. 10,000 AI credits/mo included.
One plan. $500/mo. Everything.
You don't need to do anything. As an existing subscriber, you keep your current price — you're grandfathered in. This new pricing applies to new subscriptions going forward.
We're going all-in on depth: a lot of new analytics are landing coming soon, and every one of them lands in your plan automatically.
Build Options Strategies with Instant Payoff Diagrams
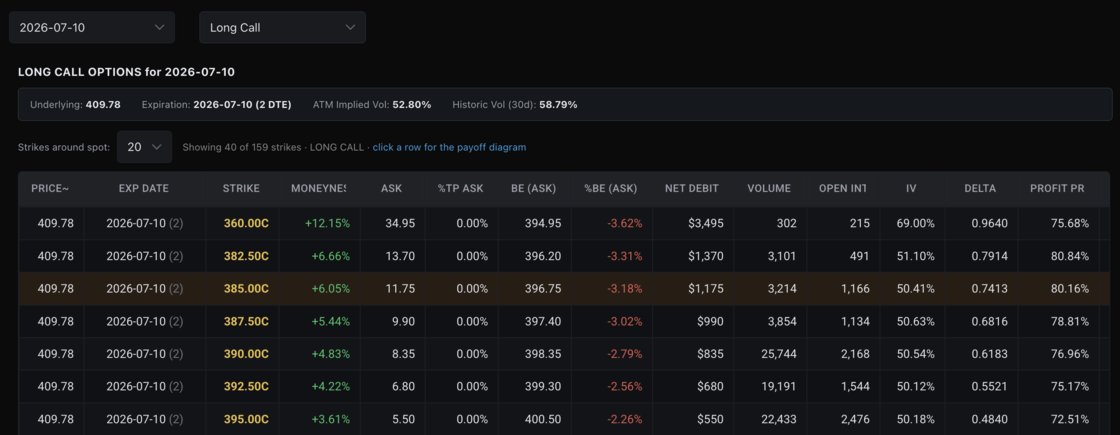
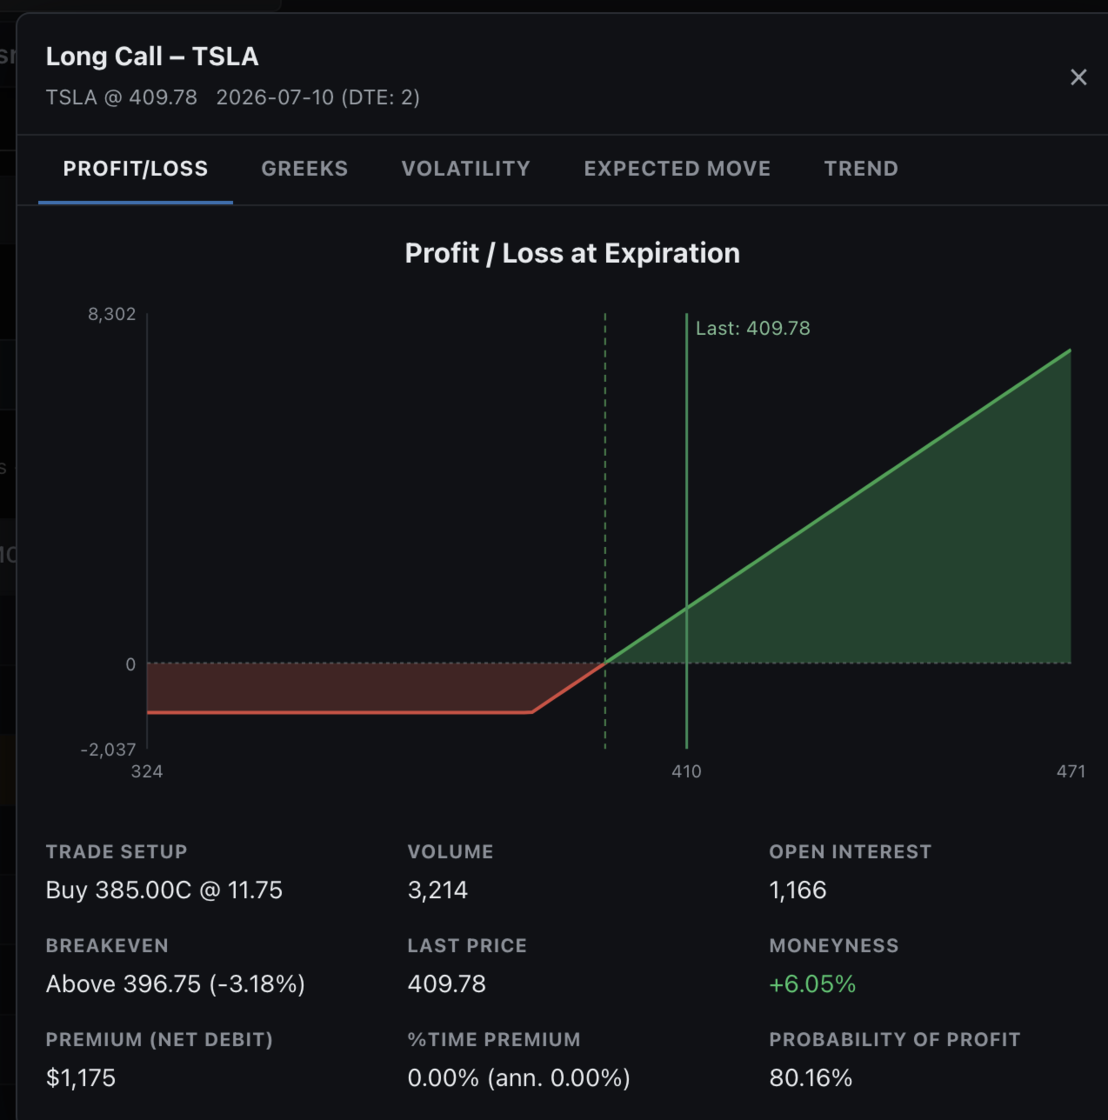
KlickAnalytics now lets you explore options strategies such as Long Calls, Long Puts, Covered Calls, Spreads, Straddles, and more.
Compare strikes, premiums, breakeven levels, implied volatility, volume, open interest, and probability of profit—then click any setup to view an interactive profit-and-loss payoff diagram, Greeks, volatility, expected move, and trend analysis.
From screening opportunities to understanding risk before placing a trade, the complete strategy picture is now in one place. To access: Search for any symbol say TSLA, and then click on Options > Options Strategies
Markets Don’t Move in Rows. They Move in Maps...
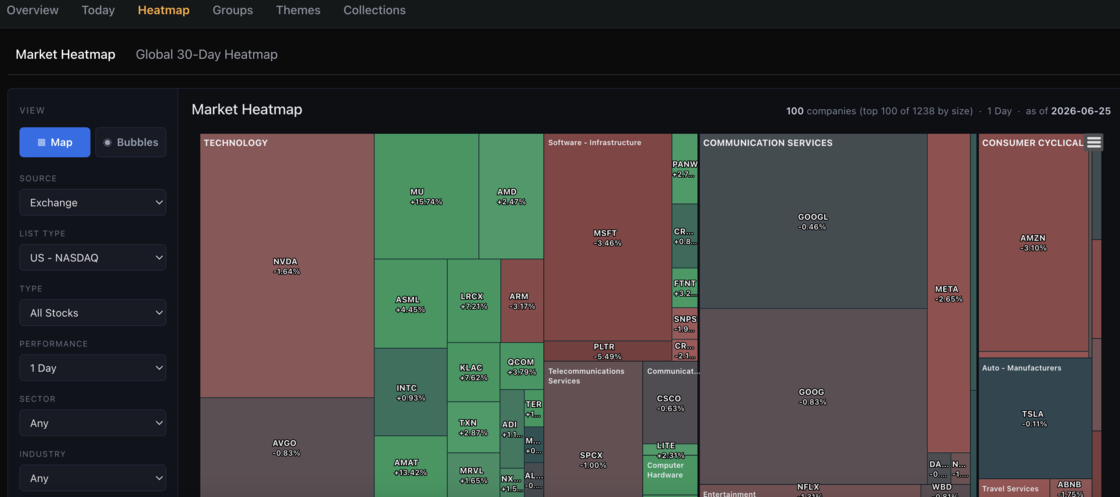
Markets are not just numbers in a table.
They are movement, pressure, strength, weakness, rotation, momentum, and risk — all happening at the same time.
That is why we built the KlickAnalytics Market Heatmap.
Now you can visually explore the market through a fully interactive heatmap and bubble view:
- Select an exchange.
- Switch between market groups, sectors, themes, collections, and your own watchlists.
- Zoom in and out of the market.
- Move from a full market view into individual sectors and stocks.
- Change bubble size by price, market cap, volume, change, performance, or other metrics.
- Track gainers, losers, concentration, and rotation in seconds.
Now you can,
- Use Map View when you want structure.
- Use Bubble View when you want motion.
- Use filters when you want focus.
Instead of scrolling through hundreds of tickers, you can see where the market is leaning instantly.
This is built for traders, investors, analysts, and anyone who wants to understand the market faster.
KlickAnalytics Market Heatmap — the market, mapped visually.
To view: From the top menu, click Markets > Heatmap > Market Heatmap
KlickAnalytics AI Reports: no prompt needed. Just run the report
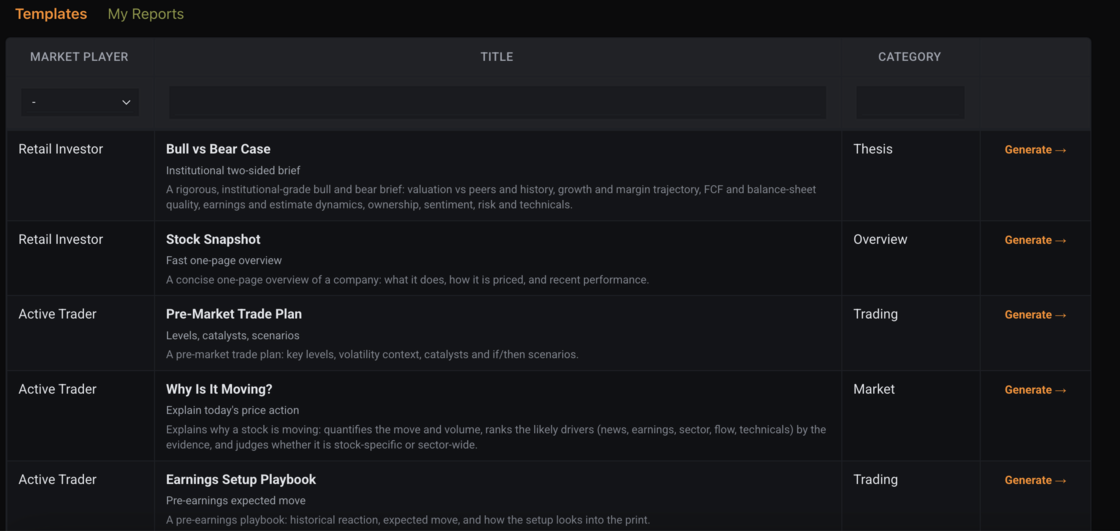
KlickAnalytics AI Reports: no prompt needed. Just run the report.
KlickAnalytics AI Reports are live.
Pick from various reports types.
Run the report.
Refine it with chat.
Enhance the thesis.
Review the sources.
Save it.
Share it with teams.
From Earnings Setup Playbooks to Bull vs Bear Cases, Stock Snapshots, Pre-Market Trade Plans, and Why Is It Moving? — we’re turning market research into a repeatable AI workflow.
Most AI tools give finance teams a blank chat window.
KlickAnalytics gives them ready-to-run institutional-style reports they can generate, improve, save, and build on.
Even the big “AI for finance” platforms are still mostly focused on chat and document Q&A.
We’re building the next layer:
AI-generated market intelligence workflows.
More templates coming.
More report types coming.
More financial intelligence coming.
KlickAnalytics AI Reports — research that keeps moving.
To access: Click on AI > Reports
Real-Time Tables
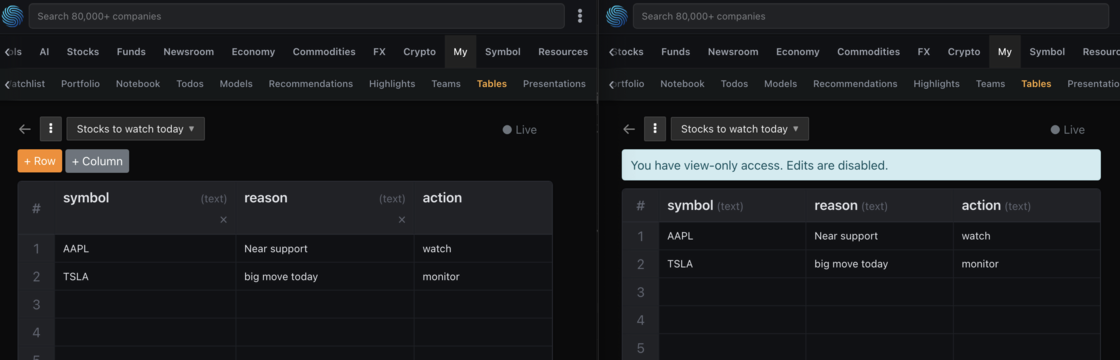
Market work changes fast.
Your watchlists, trade ideas, research notes, and team workflows should not be trapped in static files.
We’re introducing real-time tables inside KlickAnalytics — live collaborative tables that can be created, updated, shared, and tracked inside the terminal.
Use them for:
Live market watchlists Trade idea tracking Research coverage lists Portfolio review notes Catalyst/event tracking Team analyst workflows Client-ready market lists
Example:
A team creates a “Stocks To Watch Today” table. One analyst adds symbols. Another updates the reason for watching. A PM reviews it in view-only mode. Everyone stays aligned in real time.
No version chaos. No scattered notes. No disconnected workflow.
This is not Excel functionality.
It’s a live collaborative workspace for market intelligence.
KlickAnalytics is becoming where financial teams create, share, and act on market intelligence — together.
To access: From the top menu > Click My > Tables
Full research access in Terminal mode
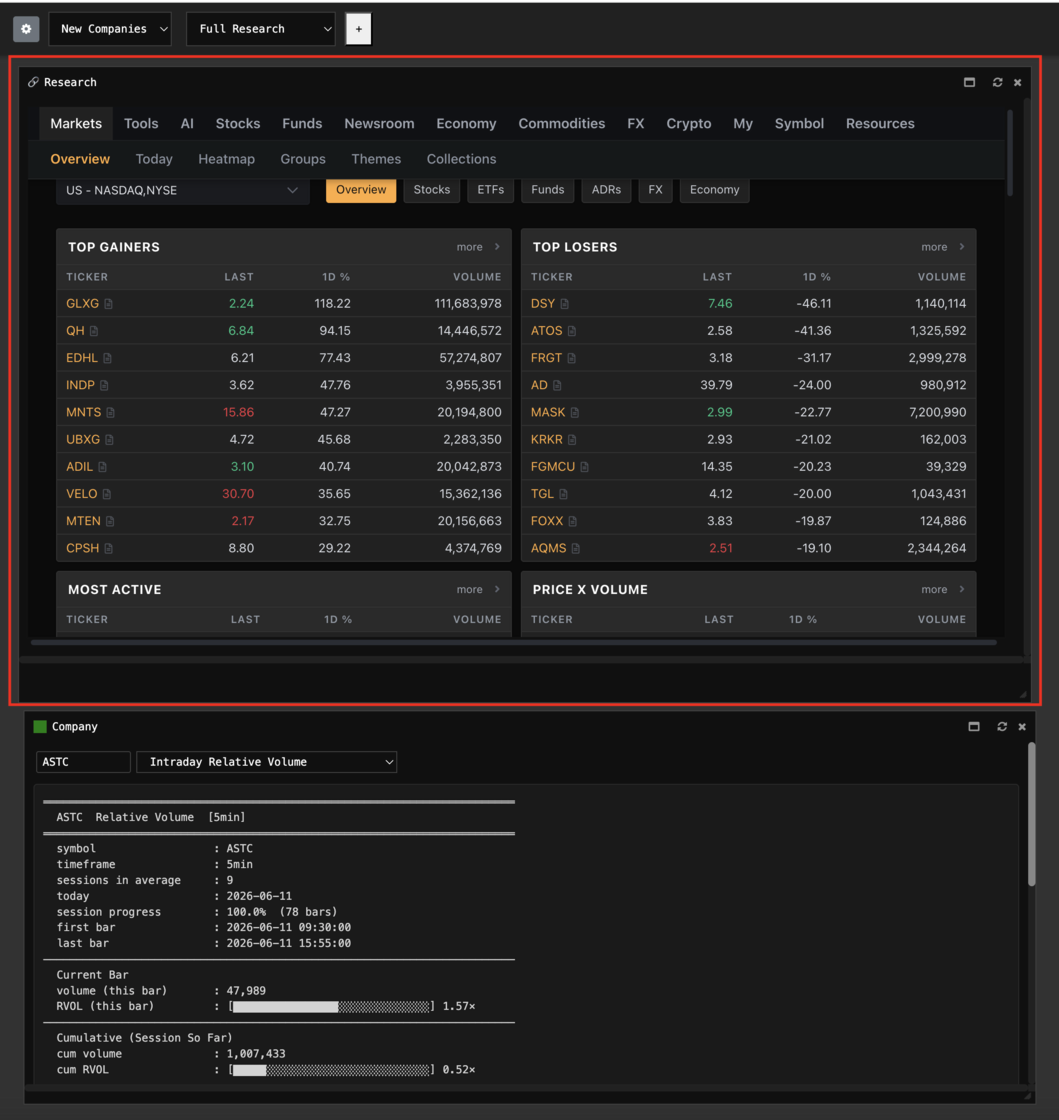
You can now embed full KlickAnalytics apps directly inside the terminal interface window — from market overviews and screeners to symbol tools, charts, scanners, dashboards, and custom analytics.
One workspace. Multiple apps. Research, analyze, compare, and act without jumping between pages.
The terminal becomes your command center for market intelligence.
KlickAnalytics: full apps, inside one intelligent terminal.
To view: Launch terminal > Click on Tool drop down and select Full Research
RRG Charts: See how stocks rotate against the market.
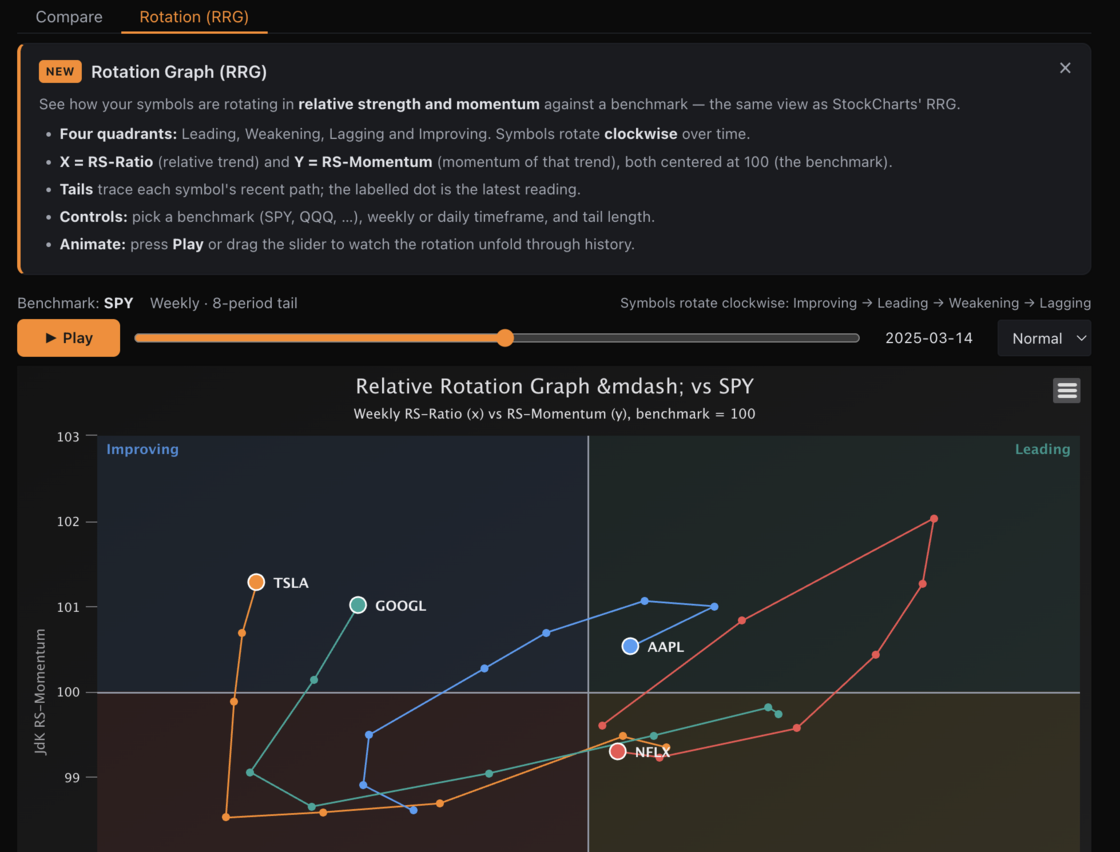
Market leadership moves in cycles. Now you can see it rotate.
We just added Relative Rotation Graphs (RRG) to KlickAnalytics.
Compare symbols like TSLA, AAPL, GOOGL, NFLX against benchmarks such as SPY and watch how they move through:
Leading → Weakening → Lagging → Improving
This gives traders and analysts a visual way to track relative strength, momentum, and sector/symbol rotation over time.
Not just price charts. Not just performance tables. Actual market rotation — visualized.
Now live on KlickAnalytics.
To view: Click on Tools > Compare
Global Financials are here...
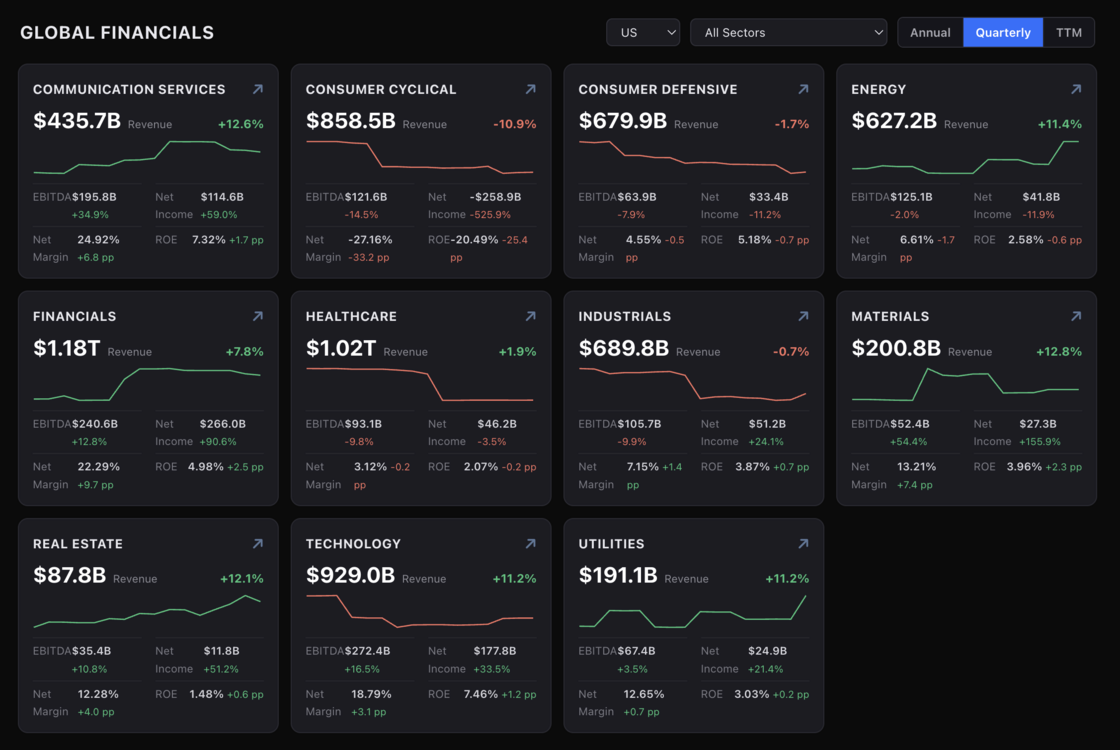
We just shipped Global Financials — and it changes how you analyze sectors on KlickAnalytics.
Until now, fundamentals meant opening companies one at a time. Starting today, every U.S. sector's financials are a live, chartable symbol — revenue, earnings, margins, ROE and more, as a time-series you can plot, compare, and drop in a watchlist, exactly like a stock or an index.
🎯 Every series is a real symbol
🔜 Coming next Industries (Banks, Semiconductors, REITs…) · more countries · global FX-normalized roll-ups
Sector fundamentals — finally as easy to chart as a stock.
To View: Click on Stocks > Financials
Introducing KlickAnalytics Thematic Indices
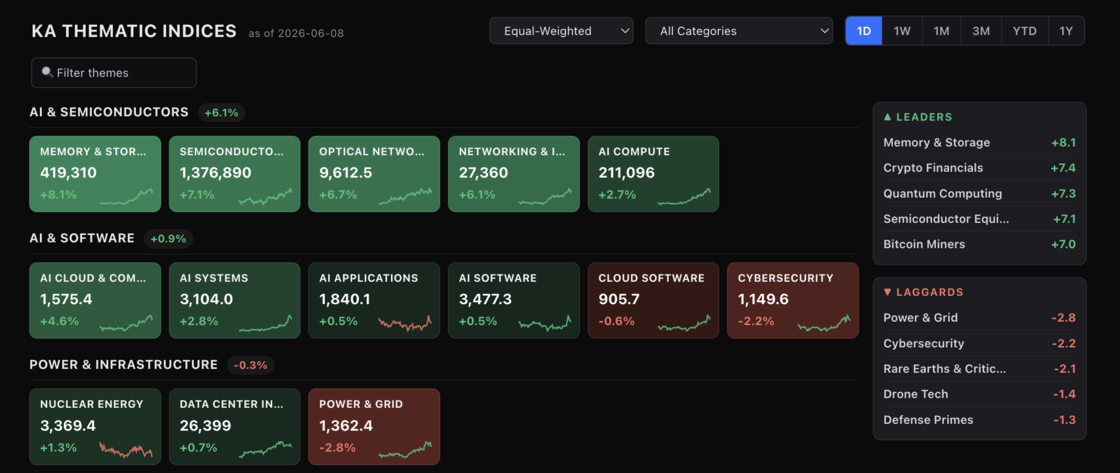
Track the market's biggest stories in one place. We've launched 36 thematic indices spanning 13 categories — from AI Compute, Quantum and Nuclear to Bitcoin Miners, GLP-1/Obesity, Gold, Uranium, Defense and the Magnificent 7.
Every theme comes in two flavors — **equal-weight and cap-weighted **— so you can see whether a move is broad-based or driven by the mega-caps. Each index is rebased to 100, split- and dividend-adjusted, with history going back decades where the data exists.
Explore them on the new Thematic Indices board: a live heatmap with 1D→1Y performance, leaders and laggards, and a click-through into every theme's chart and constituents — including each holding's contribution to the day's move.
These are the first batches, and we will be adding more and more shortly.
Now live — see what's leading the market today.
To View: Click on Markets > Themes
Ask the market a question. Get a calculated answer.
The AI is not a chatbot bolted onto a document store. It calls the same analytics engine that powers every screen on this platform — so what comes back is a number it computed from raw history, with the command that produced it.
86,000+ instruments
Global equities, ETFs, funds, options, FX, commodities, crypto, economics, filings, transcripts and news — one normalised symbol universe with adjusted history.
A real analytics engine
Screening, backtesting, technicals, options analytics, correlations, seasonality and factor models — computed on demand from raw prices, never a stale cache.
It shows its working
Answers arrive with the charts, tables and tool calls behind them, so you can check the number instead of trusting a paraphrase.
Your own documents
Upload filings, decks and research. Ask across them and the answer cites the page it came from.
Agents and workflows
Multi-step research that runs the platform's tools for you — screen, pull the history, compute, compare, then write it up.
MCP, CLI and API
The same command catalogue from Claude, your own agent, a shell or your pipeline. The answer on screen is the answer your job gets at 4am.
You ask
“How does NVDA usually trade through earnings?”
It calls
→ ka.options_expected_move(NVDA)
It answers
NVDA has averaged a 9.2% absolute move on the day after earnings and closed higher 67% of the time. Two in three reactions land between −4.2% and +16.3% — the distribution is skewed right, not symmetric.
Every figure computed live from our own history — not scraped, not summarised.
Or start with