What's New
Product updates, improvements and fixes across the KlickAnalytics platform.
142 updates · clear
Access Mutual funds Key information!
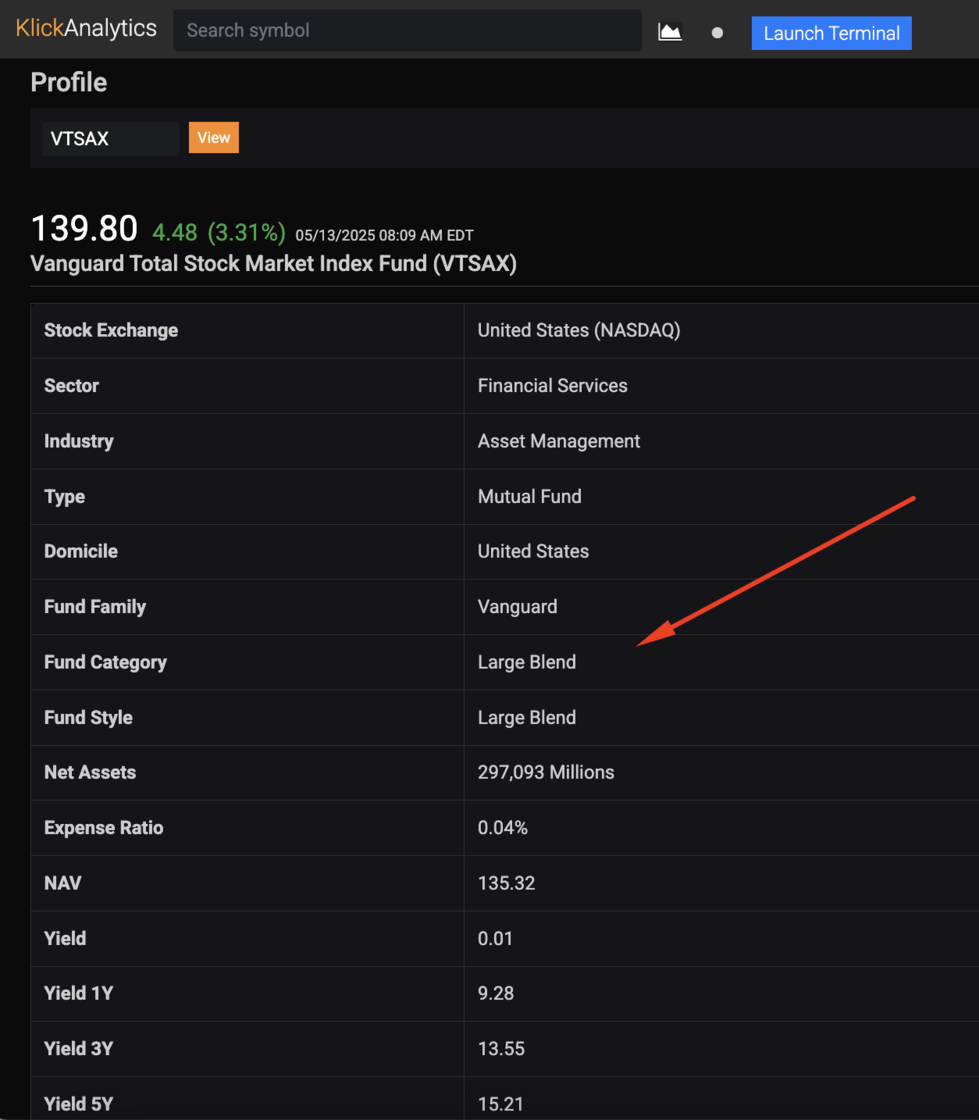
We've have enhanced our coverage of Mutual funds. Our user can access the following for any mutual fund under its profile page;
- Domicile, Fund Family, Fund Category, Fund Style
- Net Assets, Expense Ratio, NAV
- Yield for YTD, 1Y, 3Y ,5Y and more.
To access: Search for any mutual fund say VTSAX, and then from the top drop down menu click > Company > Profile
View Options chain, and greeks!
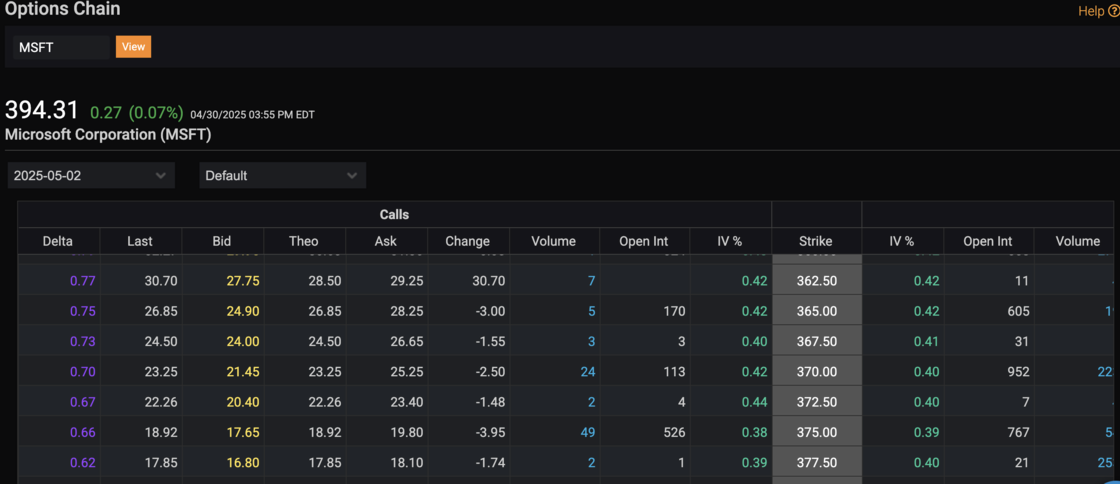
We've added the support to view all 6000+ major US symbols options data to our platform. This data is updated every day after the market. As part of the options analytics tool, we release the enhanced option chain.
The options chain will allow you to view all the greeks, along with high, lows, implied volatility numbers and much more.
To access: Search any symbol, say MSFT, and then from the top menu select Options > Options Chain
180+ Global Indices added!
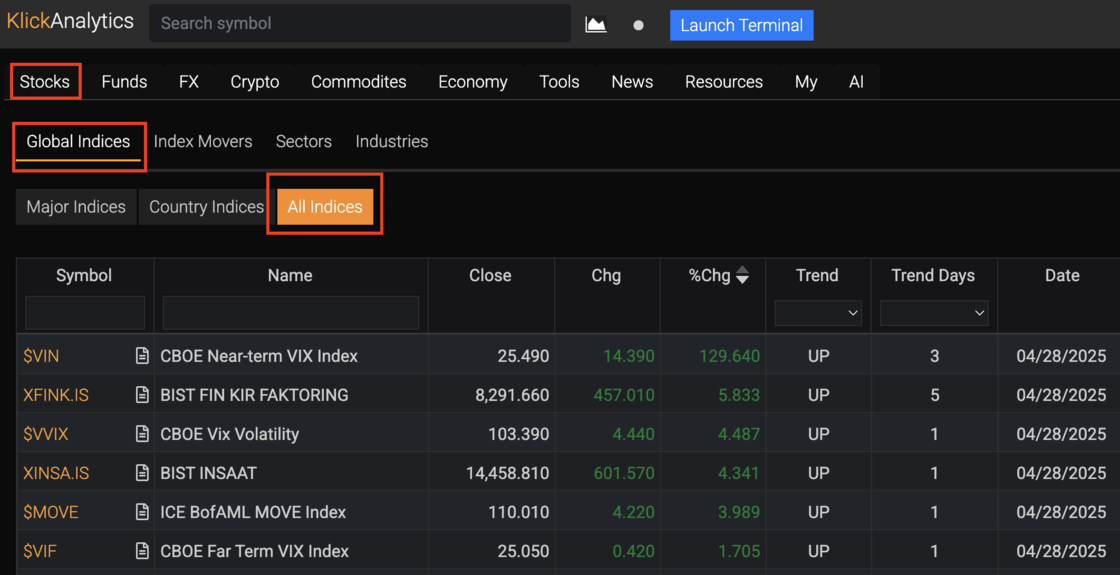
You can now access 180+ global indices across:
- Major Indices
- Country Indices
- Sectors
- Volatility Indices
- And much more!
Easily explore movements across the world’s markets under the Stocks → Global Indices → All Indices section.
Track sector performances, volatility trends, and country-specific indices — all in one place, updated daily!
To access: Click on Stocks > Global Indices > All Indices
Manage and Store Internal Price Targets Seamlessly Across Your Teams!
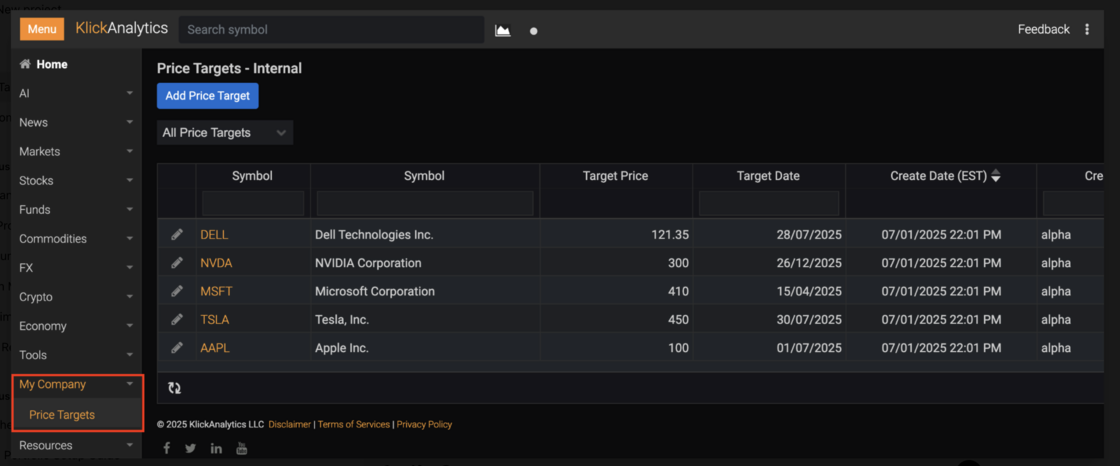
At KlickAnalytics, we are all about 'Workflow Solutions'.
Today, we are releasing our very first workflow solution tool for an organization called "Recommendations - Internals".
This tools will allow any organization to create, store, manage and analyze their own internal price targets on global listed companies across an entire organization.
KEY FEATURES:
Manage Multiple Price Targets: Easily input, track, and update target prices for various stocks across different sectors.
Set Custom Target Dates: Assign specific dates for each price target, helping organizations align their financial strategies with market forecasts.
Track Historical Data: All target prices come with a create date, allowing teams to track updates and revisions in real time.
Easy Access & Organization: View all price targets in a simple, organized table. Quickly filter by stock symbol or target date to access important information at a glance.
Real-Time Updates: Automatically refresh price targets for dynamic, up-to-date forecasting and reporting.
BENEFITS TO YOUR ORGANIZATION:
Informed Decision-Making: With accurate and timely price targets, your organization can make better investment decisions based on reliable forecasts and historical trends.
Streamlined Workflow: The ability to manage multiple stocks and their associated targets from a single platform simplifies task management and reduces manual tracking.
Improved Forecasting & Planning: Set and track target dates to better align your investment strategies with market movements and organizational goals.
Enhanced Collaboration: Share price target data across teams in a consistent and accessible format, fostering collaboration among financial analysts, portfolio managers, and decision-makers.
Data-Driven Insights: Use historical and current price target data to build comprehensive reports, analyze trends, and inform future investment strategies.
This update is designed to optimize your organization’s approach to stock market forecasting and improve the efficiency of financial teams.
With KlickAnalytics, you now have the tools needed to make more informed, data-driven decisions and align stock price targets with your broader financial goals.
To access: Click on Menu > My Company > Recommendations
View Top Analysts Price Targets!

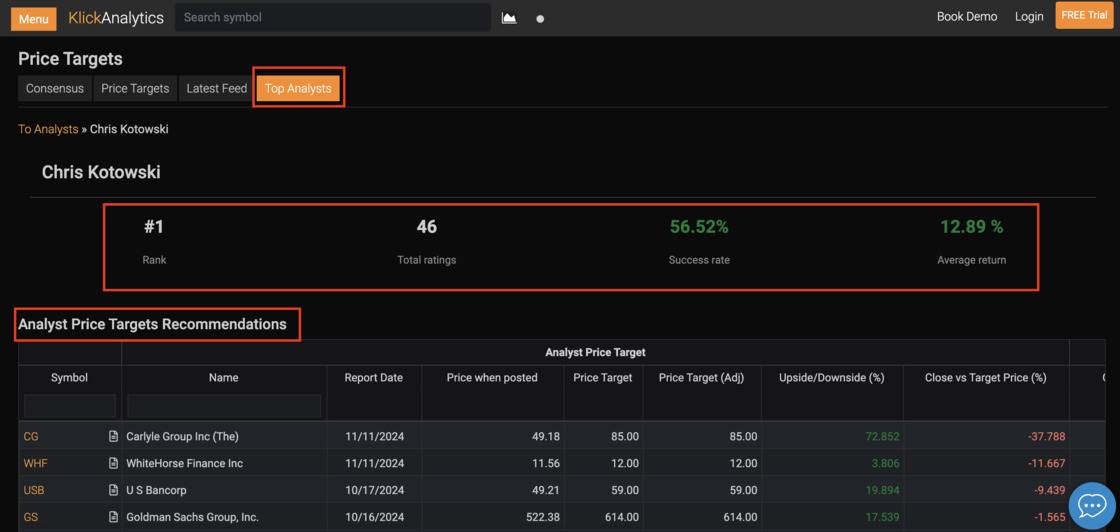
We are thrilled to announce the addition of enhanced features to Klick Analytics' Price Targets section.
Track Analyst Recommendations: Users can now view all price target recommendations made by a specific analyst, including key metrics such as price when posted, target price, adjusted target price, upside/downside percentage, and close vs. target price percentage.
Top Analysts Rankings: Easily access a detailed leaderboard of top-performing analysts, ranked by success rate, average returns, and total ratings, to identify the most reliable experts in the field. Detailed Analyst Profiles: Each analyst profile now showcases their rank, total ratings, success rate, and average return, allowing users to assess their performance at a glance.
These features are designed to provide a deeper understanding of analyst performance and empower users with actionable insights for smarter decision-making.
To access: Click Menu > Stocks > Price Targets > Top Analysts
All Press releases on your finger tips!
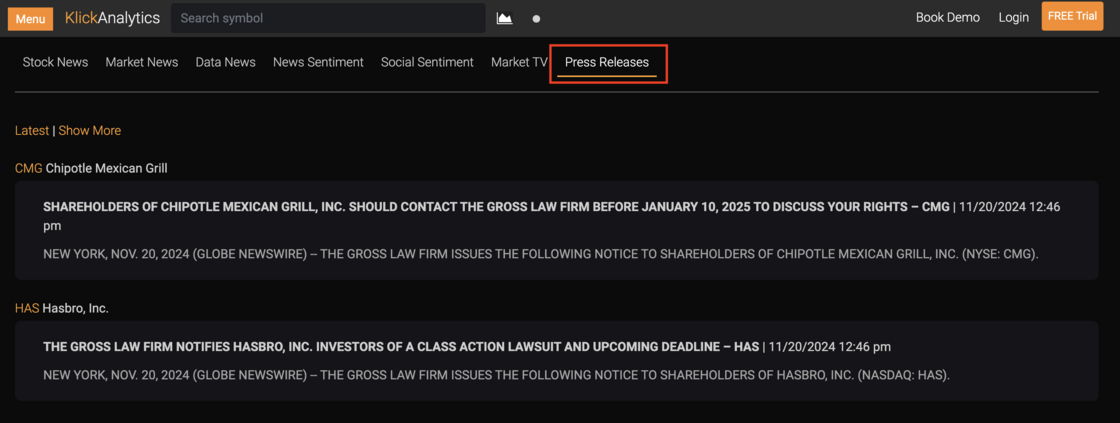
A new feature has been introduced allowing users to view both current and historical press releases. Each press release includes the company ticker, company name, a title, publication date, and a brief summary. Users can easily access all information related to specific companies directly from the interface for better insights.
Key Features:
Company Information: Displays the company ticker and name.
Detailed Press Release: Includes the title, publication date, and a brief summary of the release.
Historical Access: Users can view both current and past press releases.
Quick Navigation: Allows users to explore all related company details from the press release.
To access: Click on 'Menu' on the top, and then Click on News > Press Releases
Country ETFs added
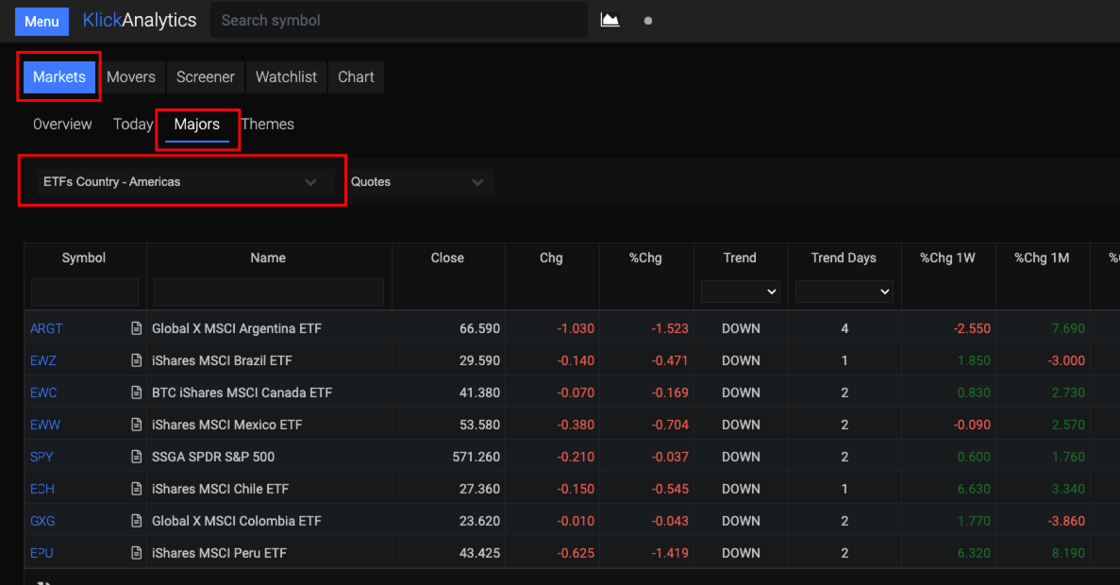
We have added the additional coverage to list all the major ETFs by country i.e.
- Americas
- Europe
- Asia Pacific
- Middle East / Africa
This will allow the users to quickly view the current and historical performances for all country based ETFs and more.
To access: From the top, click 'Menu' > Markets > Majors > and select ETFs Country like America
Intraday Returns Analysis
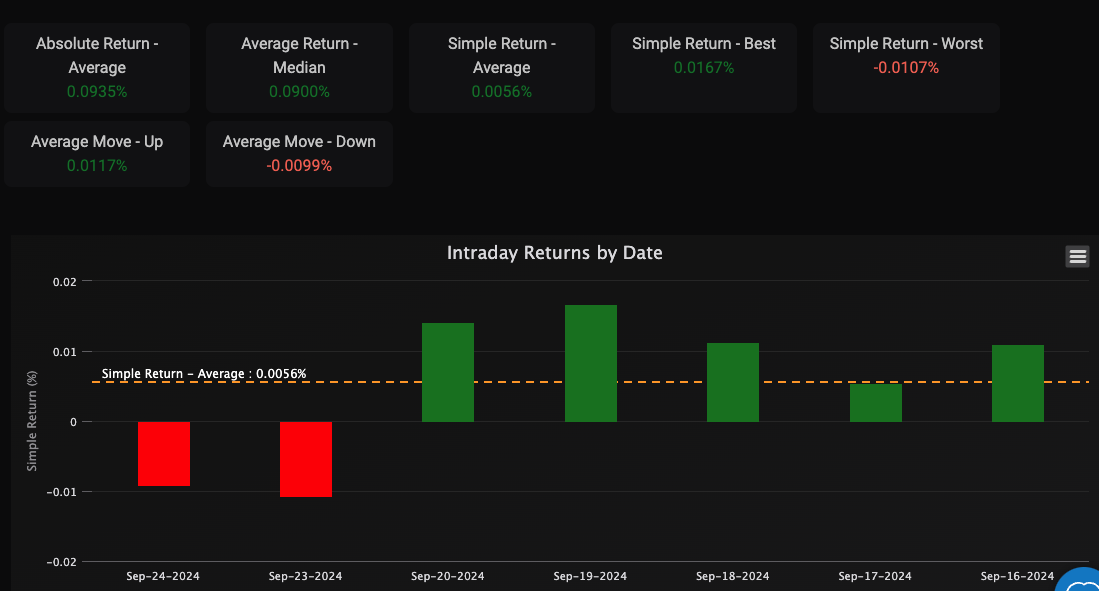
We are thrilled to announce a new enhancement to the Intraday Returns Analysis tool that brings even more precision to your trading insights. You can now explore intraday returns across a custom date range, enabling you to tailor the analysis to specific periods and events. With this update, you can dive deeper into your data by zooming in on key dates and trends. The simple return metrics, including the average, best, and worst returns, are now more interactive, allowing for a visual breakdown of returns on a daily or even intraday level. This feature also includes enhanced average move statistics, giving you a detailed view of upward and downward market movements, empowering you with more comprehensive data to refine your trading strategies.
To access: Search for any symbol, sat TSLA, from the top menu, select Analysis > Intraday > Intraday Returns
Seasonal Trades Analysis
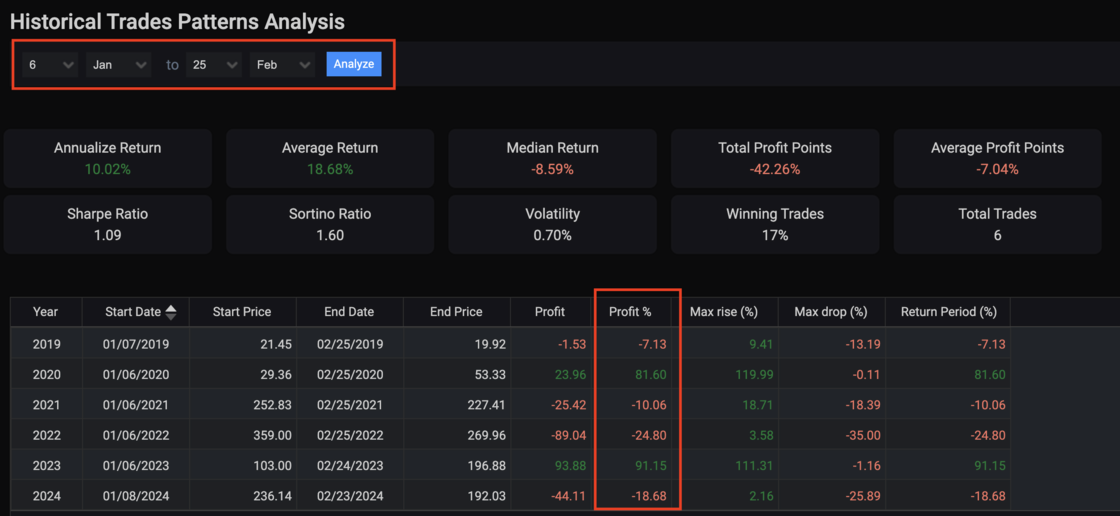
We’re excited to introduce app called Historical Trades Patterns Analysis tool, offering enhanced flexibility and deeper insights into your trading analysis.
Our users can select custom start and end days across different months and years, allowing you to explore trade patterns over any specific time period that interests you. Additionally, we’ve added the ability to filter and customize key metrics such as profit percentage, max rise/drop, Sharpe ratio, and volatility, making it easier for you to focus on the data that matters most.
Interactive charts now update in real-time as you adjust your date range or metrics, giving you a visually engaging way to spot trends and patterns instantly. A new performance summary section has also been added to quickly highlight key takeaways, providing a snapshot of your selected time frame's most critical metrics.
To view: search a symbol say TSLA, and then from the top menu, select Analysis > Seasonality > Trades
"Today" Screen: Your Global Market Snapshot at a Glance
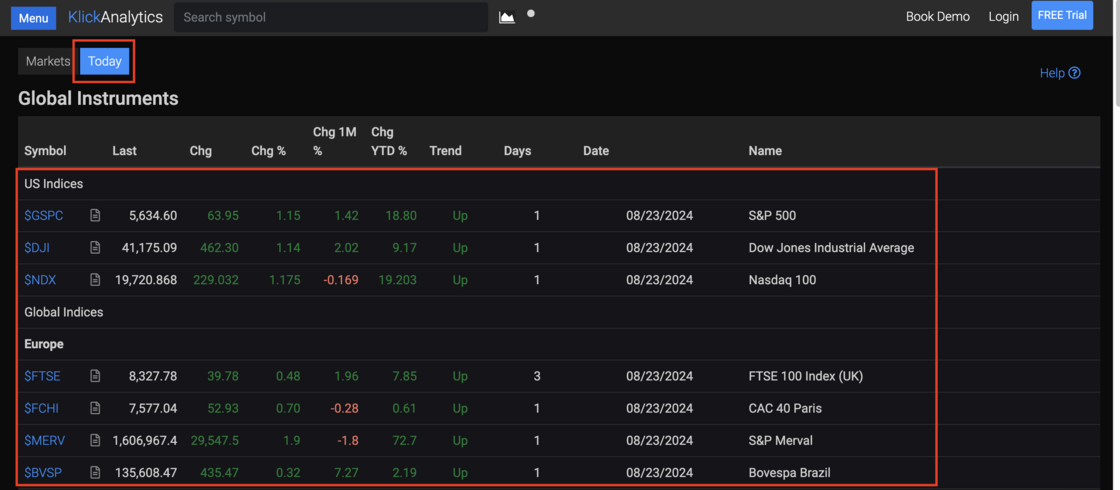
🚀 New Feature Release: "Today" Screen
We are excited to announce the launch of our new "Today" screen, now available on the main page of your home dashboard! This new feature provides a comprehensive, real-time overview of major global instruments, including indices, cryptocurrencies, currencies, major ETFs, and much more.
With the "Today" screen, you can effortlessly stay informed with a quick glance at the world's most important financial instruments, all in one place. This enhancement is designed to help you make informed decisions faster and with greater ease.
Stay ahead of the markets with our latest update!
To access: Click Menu > Home > Today
Ask the market a question. Get a calculated answer.
The AI is not a chatbot bolted onto a document store. It calls the same analytics engine that powers every screen on this platform — so what comes back is a number it computed from raw history, with the command that produced it.
86,000+ instruments
Global equities, ETFs, funds, options, FX, commodities, crypto, economics, filings, transcripts and news — one normalised symbol universe with adjusted history.
A real analytics engine
Screening, backtesting, technicals, options analytics, correlations, seasonality and factor models — computed on demand from raw prices, never a stale cache.
It shows its working
Answers arrive with the charts, tables and tool calls behind them, so you can check the number instead of trusting a paraphrase.
Your own documents
Upload filings, decks and research. Ask across them and the answer cites the page it came from.
Agents and workflows
Multi-step research that runs the platform's tools for you — screen, pull the history, compute, compare, then write it up.
MCP, CLI and API
The same command catalogue from Claude, your own agent, a shell or your pipeline. The answer on screen is the answer your job gets at 4am.
You ask
“How does NVDA usually trade through earnings?”
It calls
→ ka.options_expected_move(NVDA)
It answers
NVDA has averaged a 9.2% absolute move on the day after earnings and closed higher 67% of the time. Two in three reactions land between −4.2% and +16.3% — the distribution is skewed right, not symmetric.
Every figure computed live from our own history — not scraped, not summarised.
Or start with