What's New
Product updates, improvements and fixes across the KlickAnalytics platform.
Historical Spread Calculator
📊 Unveiling Spread Analyzer - Your Ultimate Global Instruments Comparison Tool! 🌐
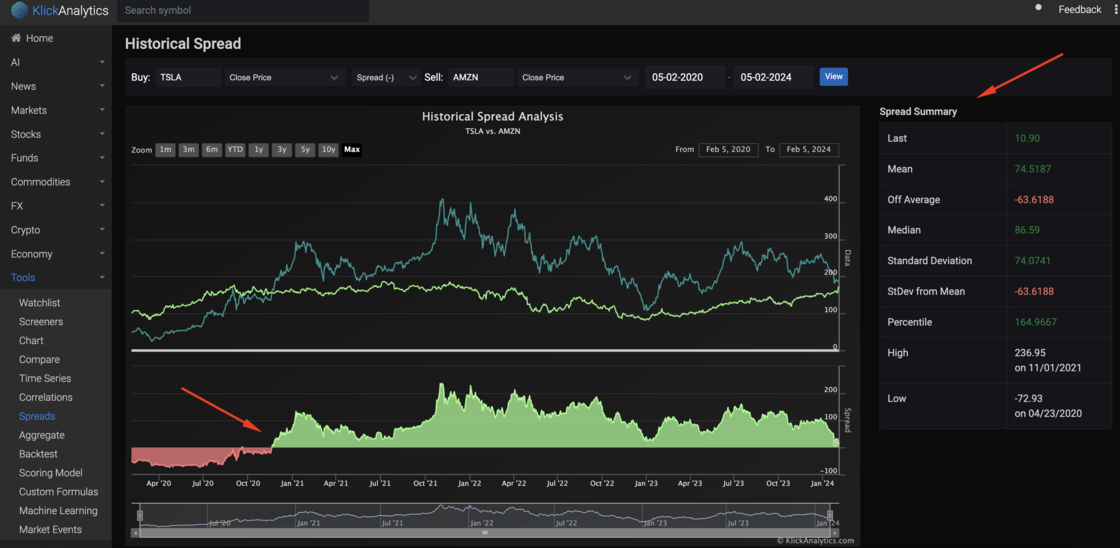
Exciting news for traders and investors! We're thrilled to present Spread Explorer, an advanced app that empowers you to select any two global instruments and conduct a comprehensive historical spread analysis. Here's what this versatile tool offers:
Instrument Flexibility:
Select any two global instruments of your choice for a detailed analysis of their historical spread dynamics.
Spread Calculation Options: Utilize diverse spread calculation methods, including ratio, division, and multiplication, to gain valuable insights into the relationship between the chosen instruments.
Spread Summary:
Uncover detailed spread statistics, featuring the last recorded spread, mean spread, off-average spread, median spread, standard deviation, StDev from Mean, percentile spread, as well as the highest and lowest spreads with their respective dates.
Key Spread Stats:
- Last Spread
- Mean Spread
- Off Average Spread
- Median Spread
- Standard Deviation
- StDev from Mean
- Percentile Spread
- Highest Spread (with date)
- Lowest Spread (with date)
Spread Explorer provides a wealth of information to aid in making informed decisions about global instrument investments. Whether you're a seasoned trader or a novice investor, this tool enhances your analytical capabilities.
Make data-driven investment choices by understanding the historical spread dynamics between any pair of global instruments. Download Spread Explorer now and elevate your analytical capabilities to make more informed investment decisions! 📈🌐
To access: From the left menu, click on Tools > Spreads
View all the main traders stats!
🚀 Introducing Trader Stats - Your Ultimate Trading Companion! 📈
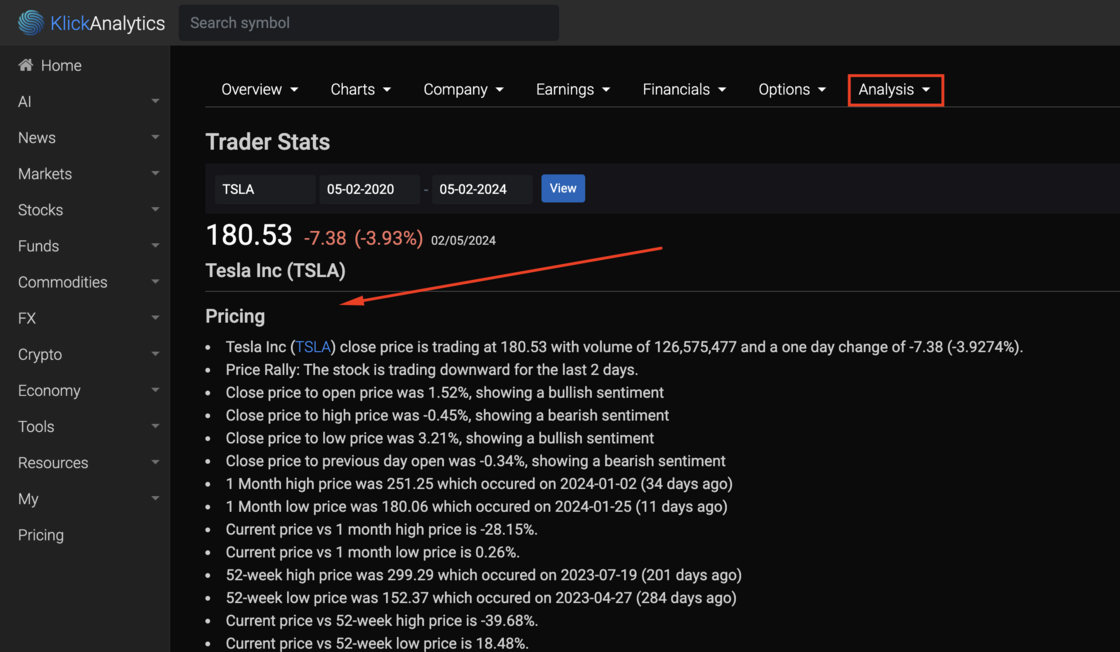
Exciting news! We're thrilled to introduce our latest app, Market Insights, designed to provide investors with a robust set of tools for analyzing market trends across various securities. Here's a glimpse of what our app offers:
Pricing Overview: Explore real-time pricing data for your chosen security, including close price, trading volume, and one-day percentage change. Gain valuable insights into price movements and sentiments with indicators like price rally, close price to open, high, low, and previous day open.
Historical Performance: Track the security's historical journey over different timeframes, including one month and 52 weeks. Evaluate the current price against highs and lows, and delve into historical returns and relative volume for a comprehensive understanding of its performance.
Technical Indicators: Analyze short-term, medium-term, and long-term moving averages to identify potential trends. The app provides SMA signals, close price comparisons, and technical indicators to aid in making well-informed trading decisions.
Volatility and Volume Analysis: Dive into volatility trends over various durations and explore volume statistics. Whether it's the highest or lowest volume in the last 7, 30, 60, 90, 180, or 365 days, Market Insights keeps you informed about market dynamics.
Market Indicators and Analysis: Discover trend insights based on SMA 50/200, RSI, Bollinger Bands, MACD, ADX, CCI, and more. Uncover potential buy or sell signals, trend strength, and volatility metrics applicable to a wide range of securities.
Market Insights is your all-in-one tool for thorough market analysis, providing a wealth of information to enhance your trading decisions across various securities. Download the app now and elevate your investment strategy!
To access: Search for any symbol say TSLA, and then from the symbol menu, select Analysis > [Trader Stats](https://klickanalytics.com/symbol_trader_stats?s=TSLA)
View pre and post market movers
We are so excited to announce that we've added a new app called 'Pre and Post Movers' which display pre and post markets movers.
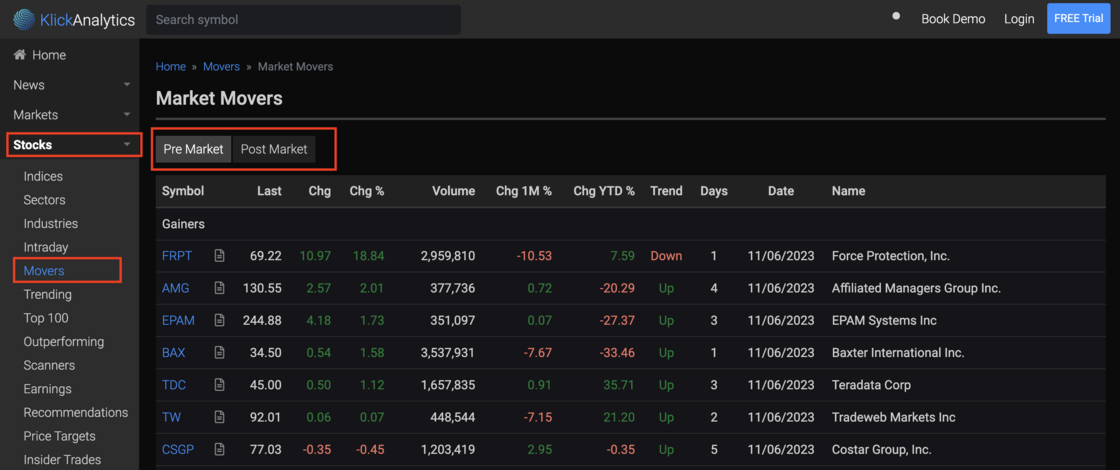
Understanding pre and post-market movers stock information is crucial for investors and traders. Firstly, it provides insight into early market sentiment, helping individuals make informed decisions before the regular trading session begins. This data can alert investors to potential price gaps and trends, minimizing unexpected losses. Secondly, it aids in risk management by allowing traders to adjust their positions or execute orders after hours, ensuring they respond to breaking news or events that may impact stock prices. Finally, pre and post-market data can unveil new opportunities and reveal valuable market intelligence, giving traders a competitive edge and improving their chances of success in the fast-paced world of stock trading.
To access:
From the left menu, click on Movers > Pre Market
More Stock News added
We are delighted to announce a significant enhancement to our news stories section, featuring a comprehensive selection of stock news. This curated selection offers users access to major news updates concerning all stocks traded on the US exchange. Furthermore, users can conveniently access succinct news summaries alongside the corresponding company symbols, providing a streamlined and informative platform for staying up-to-date with stock market developments.
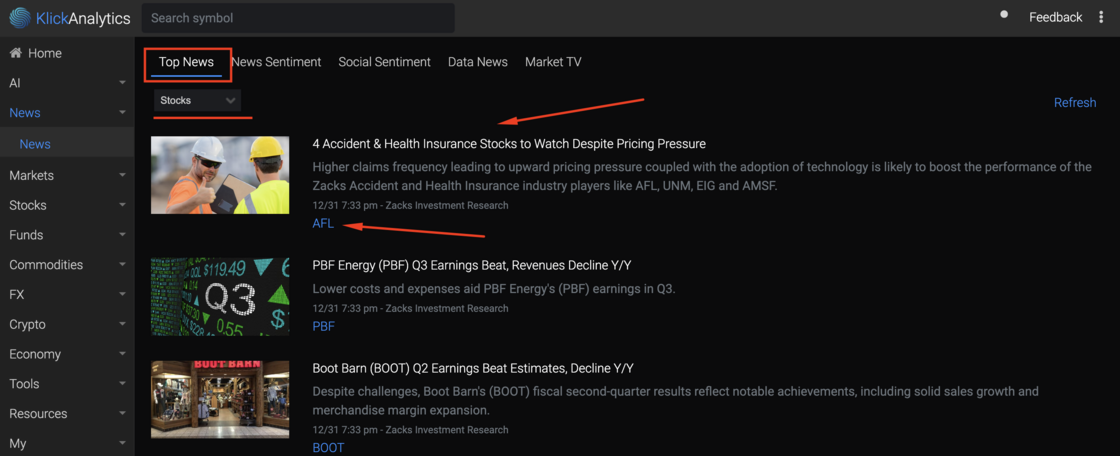
To access:
From the left menu, click on News > Top News > and select drop down "Stocks"
News stories with quick summary
We are pleased to introduce an enhancement to our news section, which now offers users the ability to view news stories alongside their corresponding images and concise summaries. This enhancement allows users to effortlessly gain a comprehensive overview of the news at a glance, providing a more efficient and engaging news browsing experience.
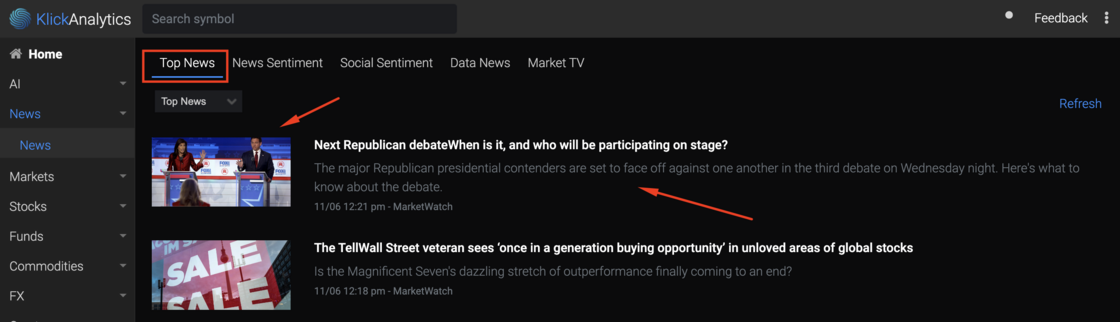
To access:
From the left menu, click on News > Top News
View top trending symbols
Stay ahead of the game with our dynamic KlickAnalytics engine! This cutting-edge tool keeps a constant eye on the market, sifting through the latest market news and price fluctuations. The result?
View on symbols and companies making significant price moves and grabbing headlines. With this powerful resource at your fingertips, you'll unlock a world of trading opportunities and more. Don't miss out on the chance to seize the day in the market!
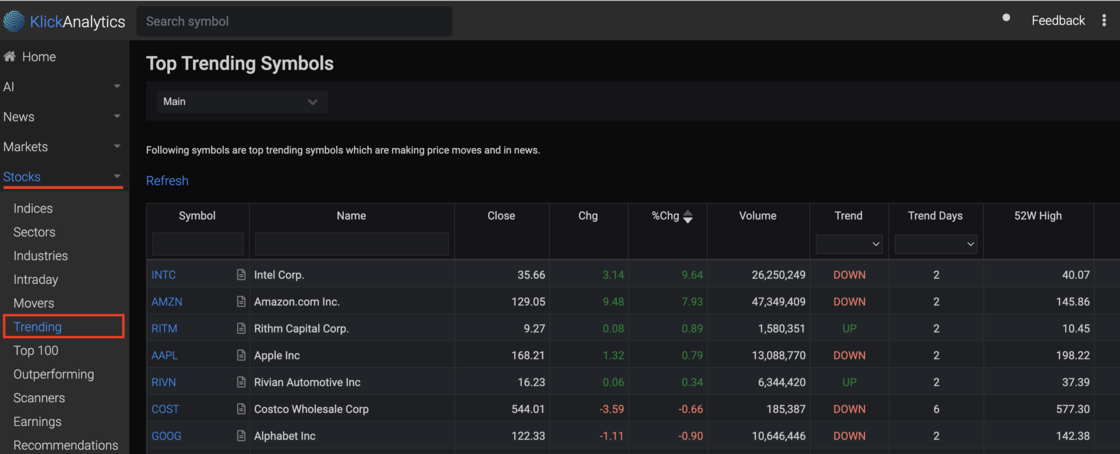
The data updates on every 10mins interval.
To view:
From the left menu, click on Stocks > Trending
New navigation layout
We're thrilled to announce a major update that's all about making your KlickAnalytics experience smoother and more efficient than ever before. With our platform constantly expanding, we understand the importance of quick and easy access to all your favorite apps. That's why we've revamped our navigation system to bring you a host of fantastic benefits!
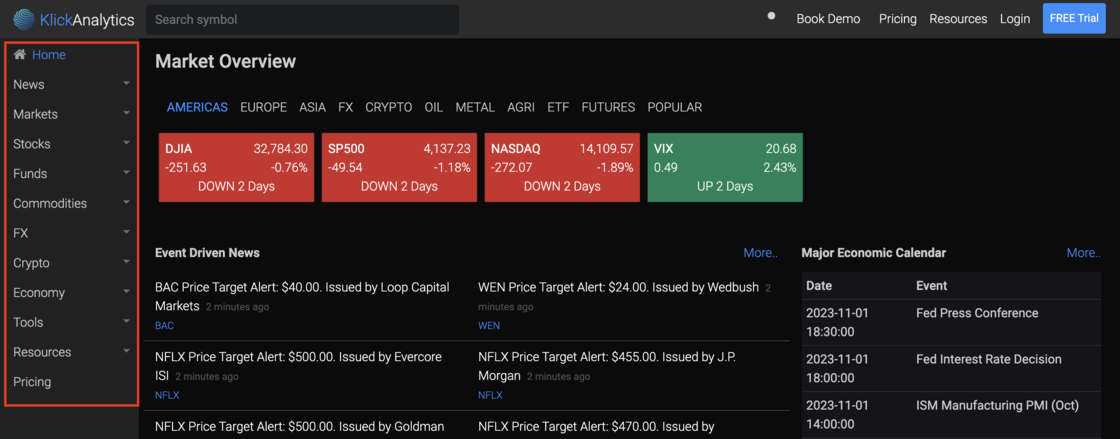
🌐 Simplified Access: Accessing your go-to apps has never been easier. Say goodbye to the hassle of digging through menus – now, with just one simple click, you can unlock a world of possibilities.
💼 Streamlined Sidebar: Our new and improved sidebar, located conveniently on the upper left-hand side, is your gateway to a seamless experience. It's your one-stop-shop for all things KlickAnalytics, putting you in control of your digital world.
🚗 Turbocharged Access: With this enhanced navigation, you're just one click away from accessing your favorite applications, tools, and features. This means you'll spend less time searching and more time doing what you love on KlickAnalytics.
✨ Elevate Your Experience: Whether you're a seasoned pro or a brand-new user, our updated navigation will take your KlickAnalytics journey to the next level. Explore your data, boost your productivity, and make informed decisions effortlessly.
This update is all about you – our cherished users.
We're committed to continuously improving your experience, and we believe that easy access to our growing suite of 40+ apps is the key to your success. Try out the new sidebar navigation today and unlock the full potential of KlickAnalytics!
Ready to discover a smoother, more efficient KlickAnalytics? Get started now and experience the magic of simplified navigation for yourself! 🌐💫📈
View all data news by a symbol
Experience the dynamic pulse of 'Data News' as it delves deep into the latest market happenings, crafting engaging articles through the ingenious automation of KlickAnalytics' data-driven content engine.
Now our users can view all the 'Data News' related any global symbol via our new app called 'Symbol Data News'
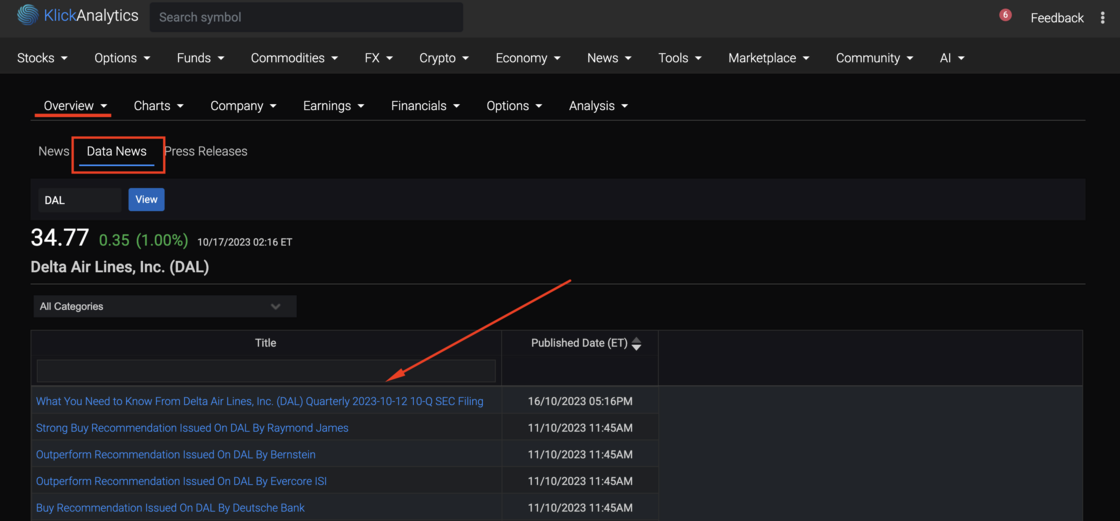
To view:
Search for any symbol, say DAL then click on dropdown Overview > News > Data News
Added coverage of Dubai - DFM Markets
KlickAnalytics vision is to provide global financial markets information.
Today, we've added the first exchange in the Middle East i.e.
Dubai Financial Markets - DFM.
Users can access price related information on following instruments traded on DFM markets;
- Stocks
- Funds
- REITs
- Exchange Traded Funds (ETFs)
- and much more.
All the symbols traded in DFM ends with .DFM e.g. The code for Dubai Financial Markets symbol will be (DFM.DFM)
More and more global exchanges will be coming soon to KlickAnalytics.com platform soon..
For more information;
Try Price Performance on DFM.DFM
We've start our crowd funding campaign
We are 'testing the waters' to gauge investor interest in an offering under Regulation Crowdfunding. No money or other consideration is being solicited. If sent, it will not be accepted. No offer to buy securities will be accepted. No part of the purchase price will be received until a Form C is filed and only through Wefunder’s platform. Any indication of interest involves no obligation or commitment of any kind.
For investment opportunities:
Checkout https://wefunder.com/klickanalytics/
Ask the market a question. Get a calculated answer.
The AI is not a chatbot bolted onto a document store. It calls the same analytics engine that powers every screen on this platform — so what comes back is a number it computed from raw history, with the command that produced it.
86,000+ instruments
Global equities, ETFs, funds, options, FX, commodities, crypto, economics, filings, transcripts and news — one normalised symbol universe with adjusted history.
A real analytics engine
Screening, backtesting, technicals, options analytics, correlations, seasonality and factor models — computed on demand from raw prices, never a stale cache.
It shows its working
Answers arrive with the charts, tables and tool calls behind them, so you can check the number instead of trusting a paraphrase.
Your own documents
Upload filings, decks and research. Ask across them and the answer cites the page it came from.
Agents and workflows
Multi-step research that runs the platform's tools for you — screen, pull the history, compute, compare, then write it up.
MCP, CLI and API
The same command catalogue from Claude, your own agent, a shell or your pipeline. The answer on screen is the answer your job gets at 4am.
You ask
“How does NVDA usually trade through earnings?”
It calls
→ ka.options_expected_move(NVDA)
It answers
NVDA has averaged a 9.2% absolute move on the day after earnings and closed higher 67% of the time. Two in three reactions land between −4.2% and +16.3% — the distribution is skewed right, not symmetric.
Every figure computed live from our own history — not scraped, not summarised.
Or start with