Custom Series: chart your own data next to the market
Upload a CSV of dates and values and it becomes a private ticker you can chart, compare against any stock or index, edit row by row and share with your team.
Some of the most important numbers on a desk are not in any market data feed. A private fund's monthly NAV. An internal index. Broker quotes for a bond that barely trades. A strategy's equity curve out of a backtest. A spreadsheet of store traffic or freight rates that someone updates every week.
These numbers usually live in a separate file, charted on their own, and comparing them with the market means lining up dates by hand. Custom Series puts them on the platform instead: upload a CSV and it becomes a ticker of its own, charted and compared like any other instrument.
A date and a value is enough
The first column is the date. After that, the only value you need is a close — call the column Close, Price, Value, Last or Adj Close, or anything else if it is the only one. This monthly NAV file uploads as it is:
Date,NAV
2026-06-30,100.00
2026-07-31,101.85
2026-08-31,103.12
If the file has them, Open, High, Low and Volume are read too, so a full price history keeps its candles:
Date,Open,High,Low,Close,Volume
2026-09-10,50.2,51.0,49.8,50.6,120000
2026-09-11,50.6,52.1,50.1,51.9,98000
A few details are handled for you:
- No header row? The columns are matched by how many there are: date and close, date–close–volume, or the full open-high-low-close.
- Any date style. 2026-01-31, 01/31/2026, 31/01/2026 and 31.01.2026 are all read. For slash dates such as 03/04/2026, which could be either March or April, choose the convention on the upload form.
- European spreadsheets. Files exported with semicolons are read with the comma as the decimal point, so
1.234,50becomes 1,234.50 rather than a price a hundred times too large. - Corrections. If a date appears twice, the later row wins — append a corrected line rather than hunting for the old one.
- Daily, weekly or monthly. Rows can be any distance apart; the chart follows your dates.
Check it before it is saved
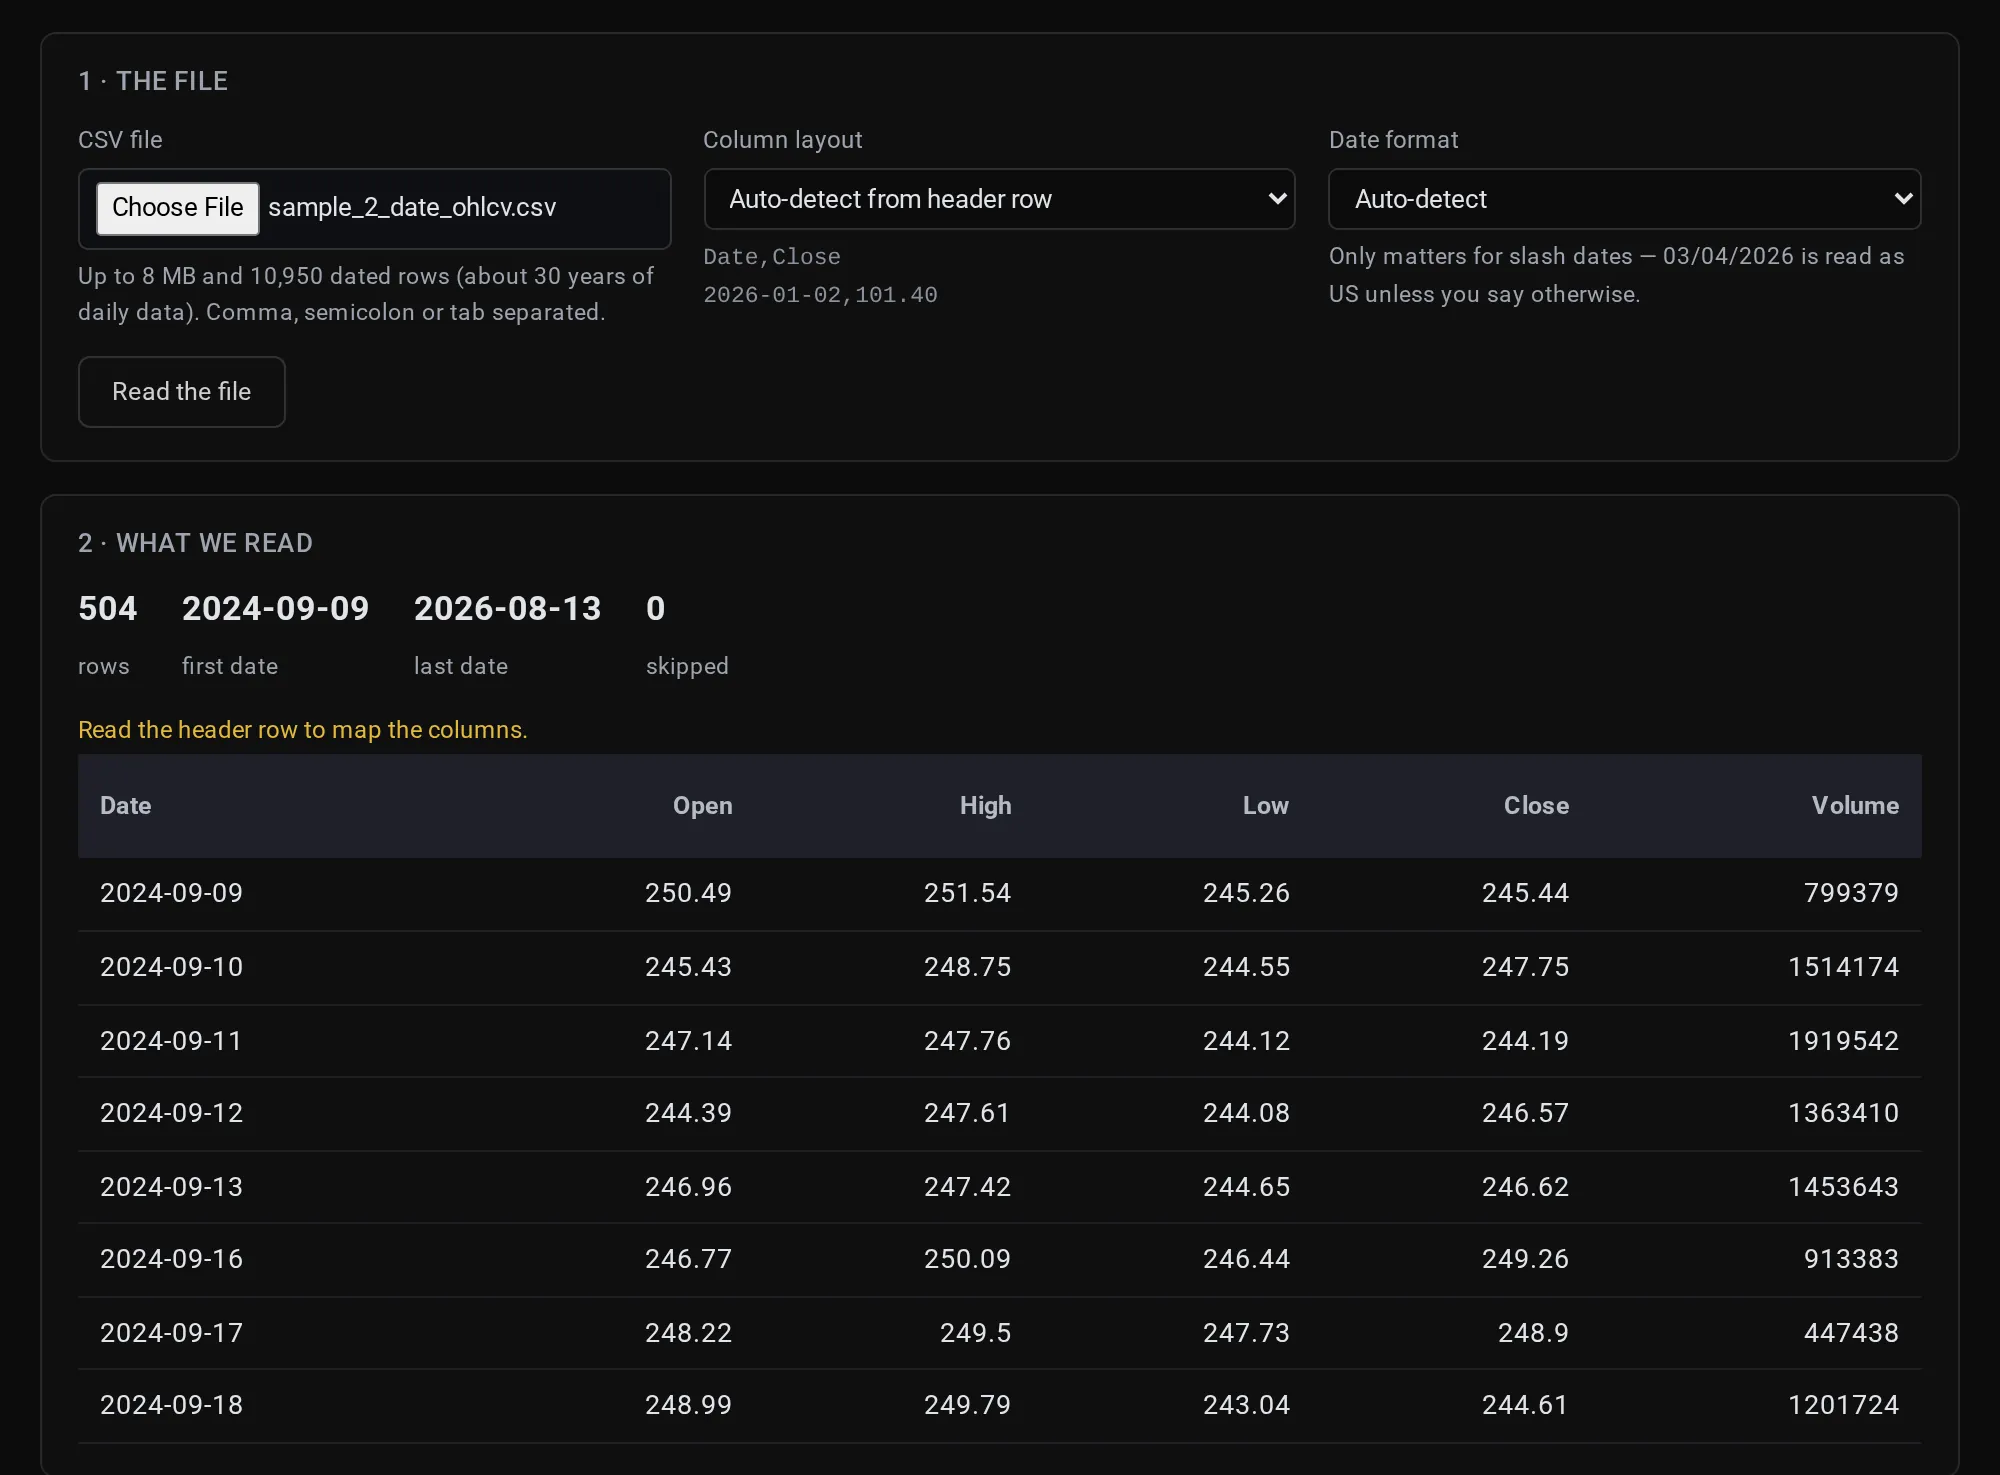
Choose the file and click Read the file. Nothing is stored yet. You see how many rows were read, the first and last date, how many rows were skipped and why, and the first rows exactly as they will be saved — only the columns your file actually contained.
If it looks right, give the series a name and a description and click Create series. You land on the series page with the stored numbers in front of you.
A ticker of its own
Each series gets its own symbol, and from there it behaves like any instrument:
- Open in Chart plots it on the full chart. A close-only series is drawn as a line; one with open, high and low can be shown as candles.
- Compare overlays it against stocks, indices, ETFs or your other series. Put a fund's NAV next to SPY, or an internal index next to the sector ETF it is meant to track.
- Symbol search finds it under My Series, so it is one search away wherever you pick a symbol.
Keep it up to date
Data changes, and the series page is built for that:
- Add row appends the latest value — this month's NAV, today's quote — without re-uploading anything.
- Every row has edit and delete icons to fix a single value or move it to another date. Daily changes are recalculated for you, including the row after the one you touched.
- Replace data swaps in a whole new file when the history is restated. The ticker stays the same, so everything pointing at it keeps working.
- Rename changes the name shown in search and on charts.
Private until you share it
A new series is visible only to you. Nobody else can find it in search or open it on a chart. When a colleague needs it, click Share and choose a teammate or a whole team:
| Access | Can do |
|---|---|
| Viewer | See the series and its data, find it in search, chart and compare it |
| Editor | Everything a viewer can, plus rename, add and edit rows, and replace the data |
| Owner | Everything, plus share and delete |
Removing someone's access closes the ticker to them everywhere at once.
Ideas to start with
- A private or illiquid holding. Upload its monthly valuations and compare them with the listed market it is most exposed to.
- A strategy's equity curve. Chart a backtest or a live track record against its benchmark.
- An internal index or basket. Keep the house index on the platform, and let the team chart it without asking for the file.
- Alternative data. Web traffic, shipping rates, survey readings — anything with a date and a number — next to the stocks it is meant to explain.
What is included
Custom Series is part of the paid plans: up to 50 series, each holding up to 10,950 dated rows (about 30 years of daily data), from files of up to 8 MB. Files can be comma, semicolon or tab separated.
Get started
- Open My › Custom Series and click + New Series.
- Choose your CSV and click Read the file.
- Check the preview, name the series, and click Create series.
- Click Compare and add a benchmark.