Introducing Sheets: a spreadsheet with market data built in
Pull price history, financial statements and live quotes into cells with a formula, ask AI about any range, and build models with your team in real time.
Most market analysis still starts the same way: export a CSV, paste it into a spreadsheet, fix the dates, line up the tickers, and do it all again tomorrow when the data has moved. The model is the valuable part. The copying is not.
Sheets removes the copying. It is a full spreadsheet — formulas, formatting, filters, sorting, several tabs — with KlickAnalytics data available as ordinary formulas. Type =KAH("SPY","close","-3Y") and three years of adjusted closes fill the cells below. Change the ticker, and everything built on top of it recalculates.
A spreadsheet first
If you know Excel or Google Sheets, you already know how to use it. XLOOKUP, SUMIFS, INDEX/MATCH, STDEV, CORREL and dynamic arrays all behave the way you expect, and the data formulas combine with them freely. Nothing about your model has to change shape to fit the data.
Five formulas that bring the data in
| Formula | What it returns | Example |
|---|---|---|
KAH | History as a table — prices or fundamentals, one or many symbols, daily to yearly | =KAH("SPY,QQQ,TLT,GLD","return","-1Y","","W") |
KAP | The latest value of a field — price, valuation, returns, technicals, sector | =KAP("NVDA","forward_pe") |
KAFIN | A complete income statement, balance sheet, cash flow or ratio set | =KAFIN("MSFT","IS","Q",8,"B") |
KALIVE | A streaming price that updates in the cell (paid plans) | =KALIVE("AAPL","change_pct")/100 |
AI | An answer about the cells you reference | =AI("Summarise the trend in one sentence",A1:B60) |
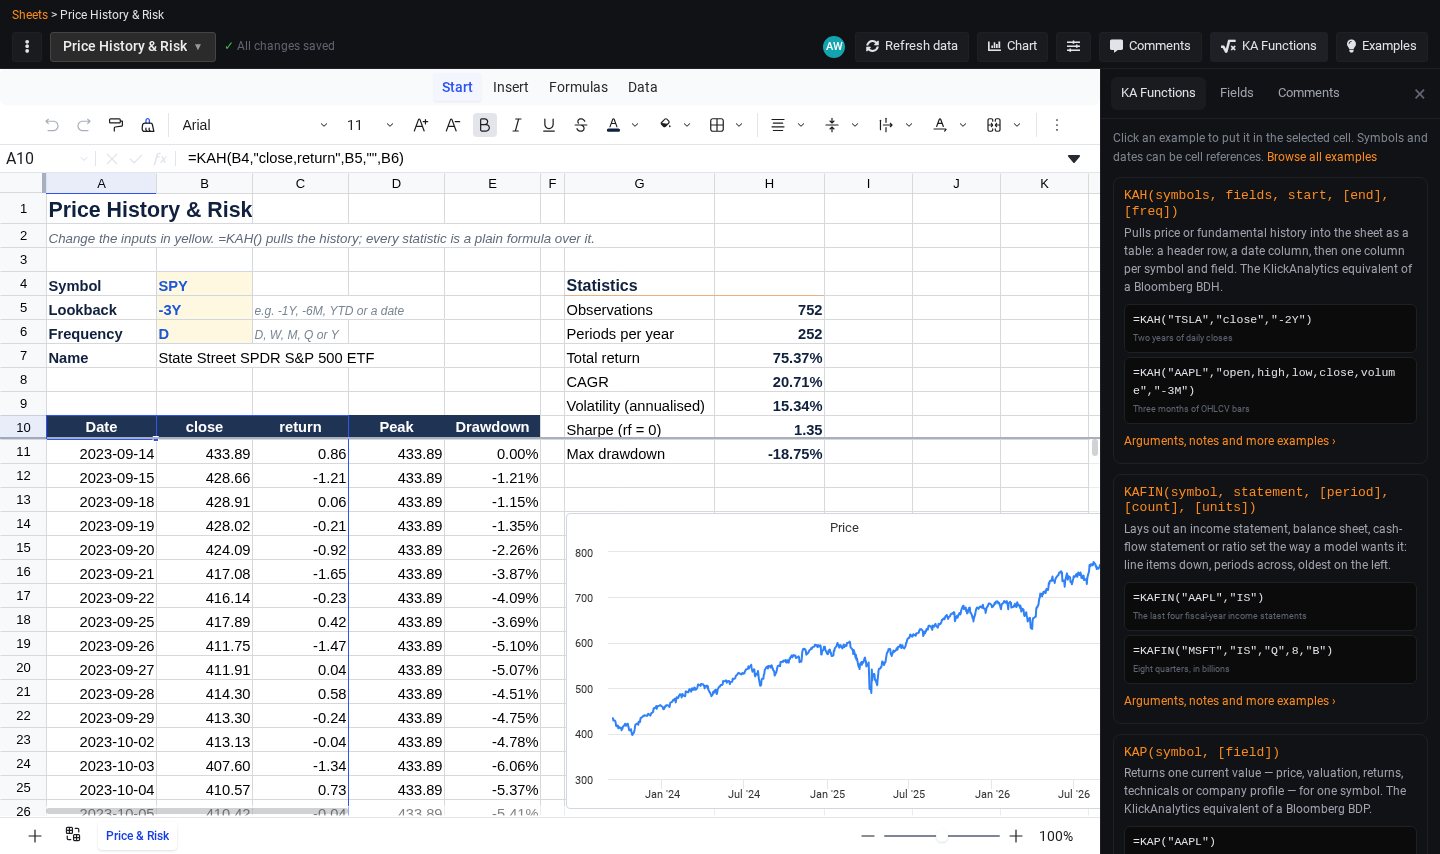
Tickers, dates and fields can all be cell references, so one input cell can drive an entire model. The KA Functions panel in the editor lists every argument with examples you can drop into the selected cell, and the Fields tab searches more than 200 fields by name.
Charts that follow the numbers
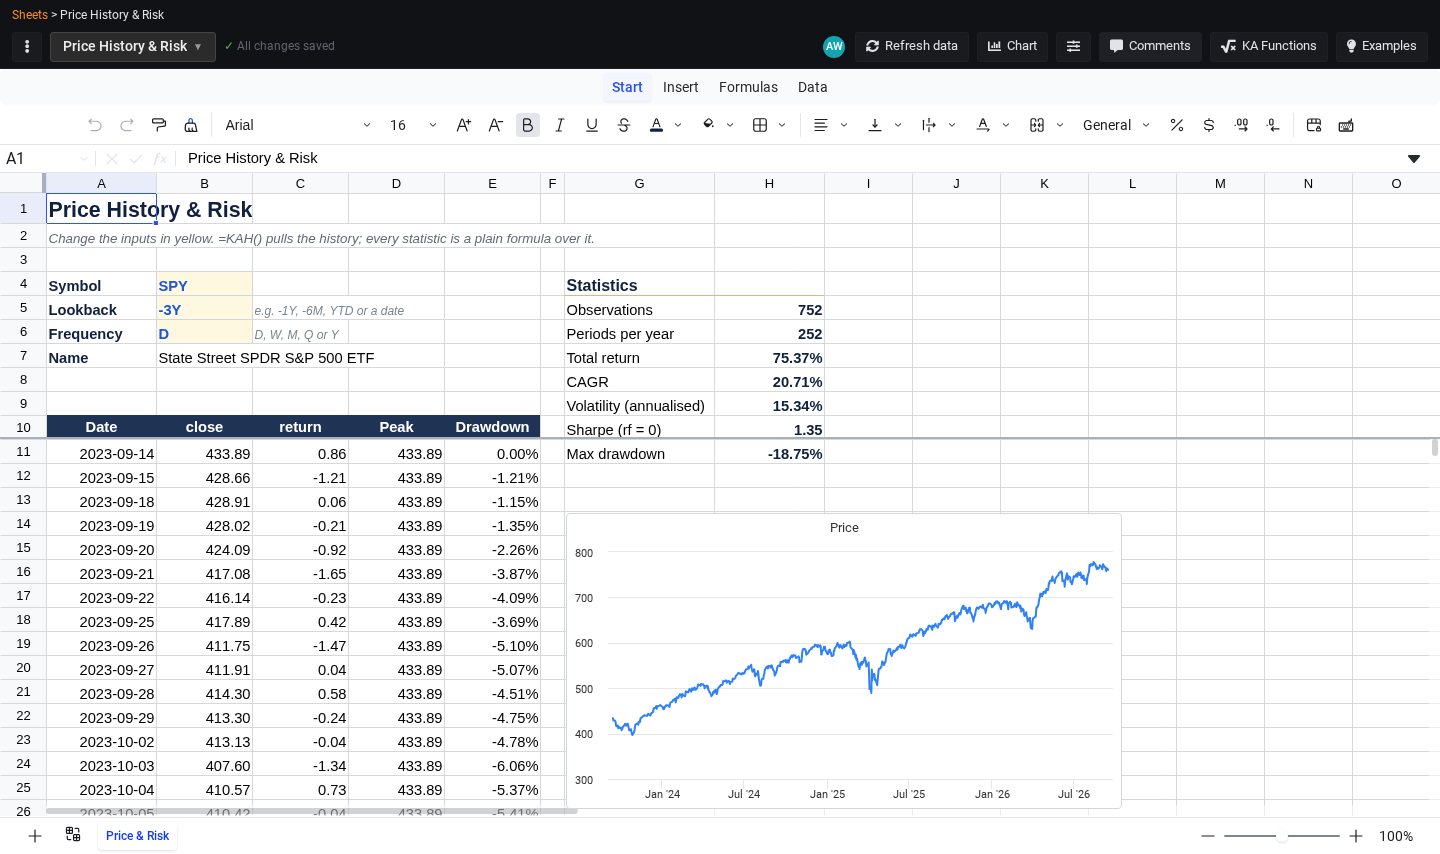
Select a range and choose Chart. Line, column, bar, area, pie and scatter charts sit on the sheet and redraw whenever the data under them changes — switch the ticker from SPY to QQQ and the price and drawdown charts update with the table.
Built for teams
A model is rarely one person's work. Share a sheet with your whole team or with individual colleagues, as an editor or a viewer, and they get a notification that opens it.
- Edit together in real time. Changes appear for everyone as they are made.
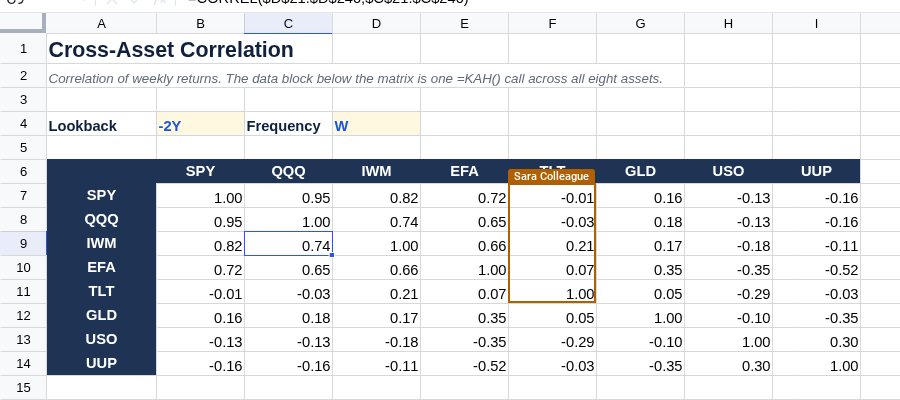
- See where people are. Each collaborator's selection is outlined in their colour with their name, and clicking someone's avatar takes you to the cell they are on.
- Discuss on the cell. Comment on any cell, @mention a colleague to notify them, and resolve the thread when it is settled.
- Go back in time. Version history keeps a copy of the sheet while it is being edited, and restoring one keeps the current state as a version first.
Start from an example, not a blank page
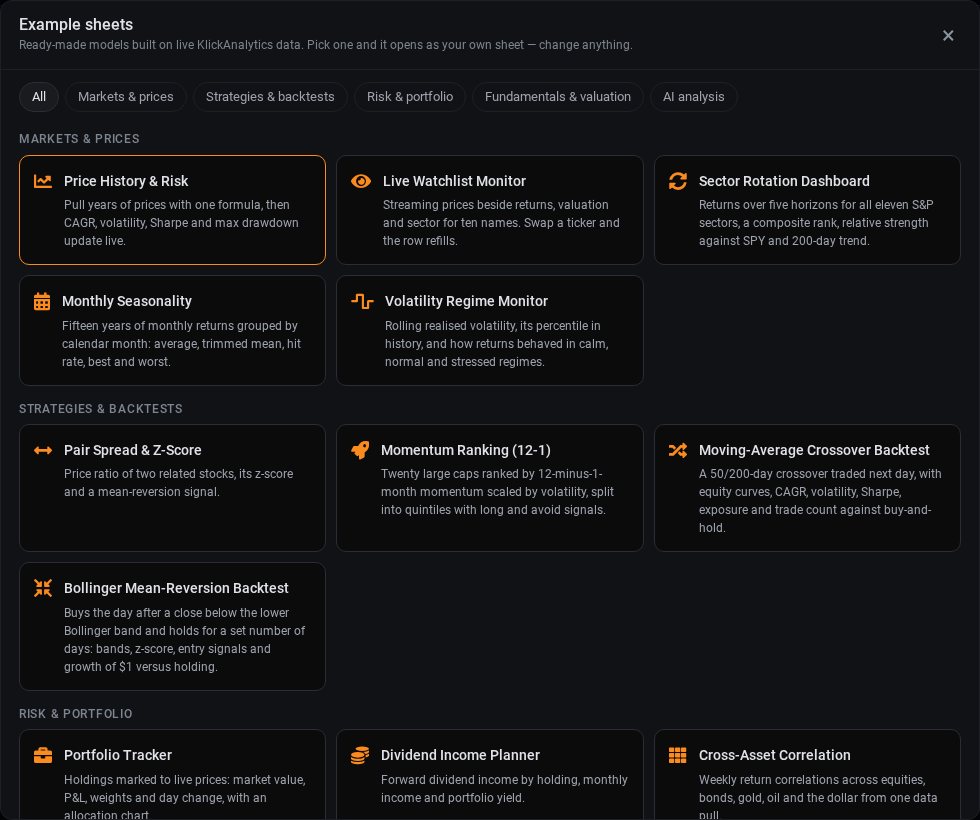
Sheets comes with 26 ready-made models across markets and prices, strategies and backtests, risk and portfolio, fundamentals and valuation, and AI analysis. Each one opens as your own copy with live data, so you can take it apart and change anything:
- Price History & Risk — CAGR, volatility, Sharpe and maximum drawdown for any symbol and lookback.
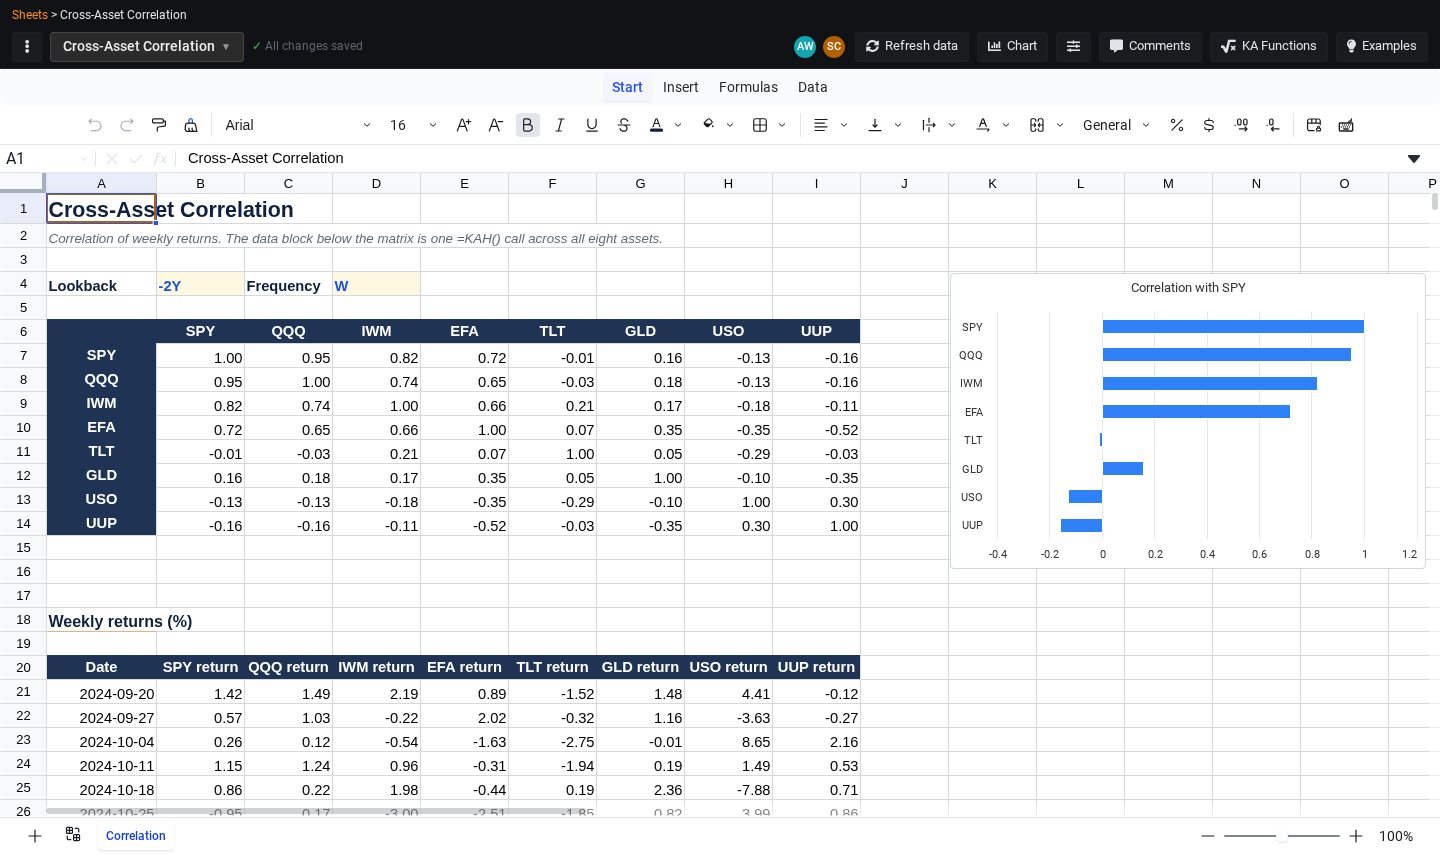
- Cross-Asset Correlation — weekly return correlations across equities, bonds, gold, oil and the dollar from one data pull.
- Moving-Average Crossover Backtest — a 50/200-day crossover against buy-and-hold, with equity curves and trade count.
- DCF Valuation — five years of free cash flow, a projection from your assumptions and an implied value per share.
- Portfolio Value at Risk — historical and parametric VaR, expected shortfall and the diversification benefit.
What is included
Every account can use Sheets. The free plan includes three sheets, up to 10,000 filled cells per sheet and up to 1,000 rows per data formula. Paid plans remove those limits and add streaming prices with KALIVE and downloads to Excel (.xlsx) and CSV. Each new =AI() answer uses one AI credit; the same question over the same numbers is answered once and reused, so reopening a sheet costs nothing.
Get started
- Open My › Sheets.
- Choose Examples and pick a model, or click New sheet.
- Type a data formula such as
=KAH("AAPL","close","-1Y")into any cell and build from there.