Build a cross-asset correlation dashboard and review it with your team
One data pull, an eight-asset correlation matrix and a chart — then share it, see where colleagues are working, and settle questions in comments on the cell.
Diversification rests on how assets move together, and those relationships are not fixed: the way stocks, bonds, gold, oil and the dollar co-move changes from one market regime to the next. A correlation matrix you rebuild once a quarter is out of date for most of the quarter. This walkthrough builds one that refreshes itself, then shows how to review it with colleagues without a single emailed attachment.
Step 1: open the example
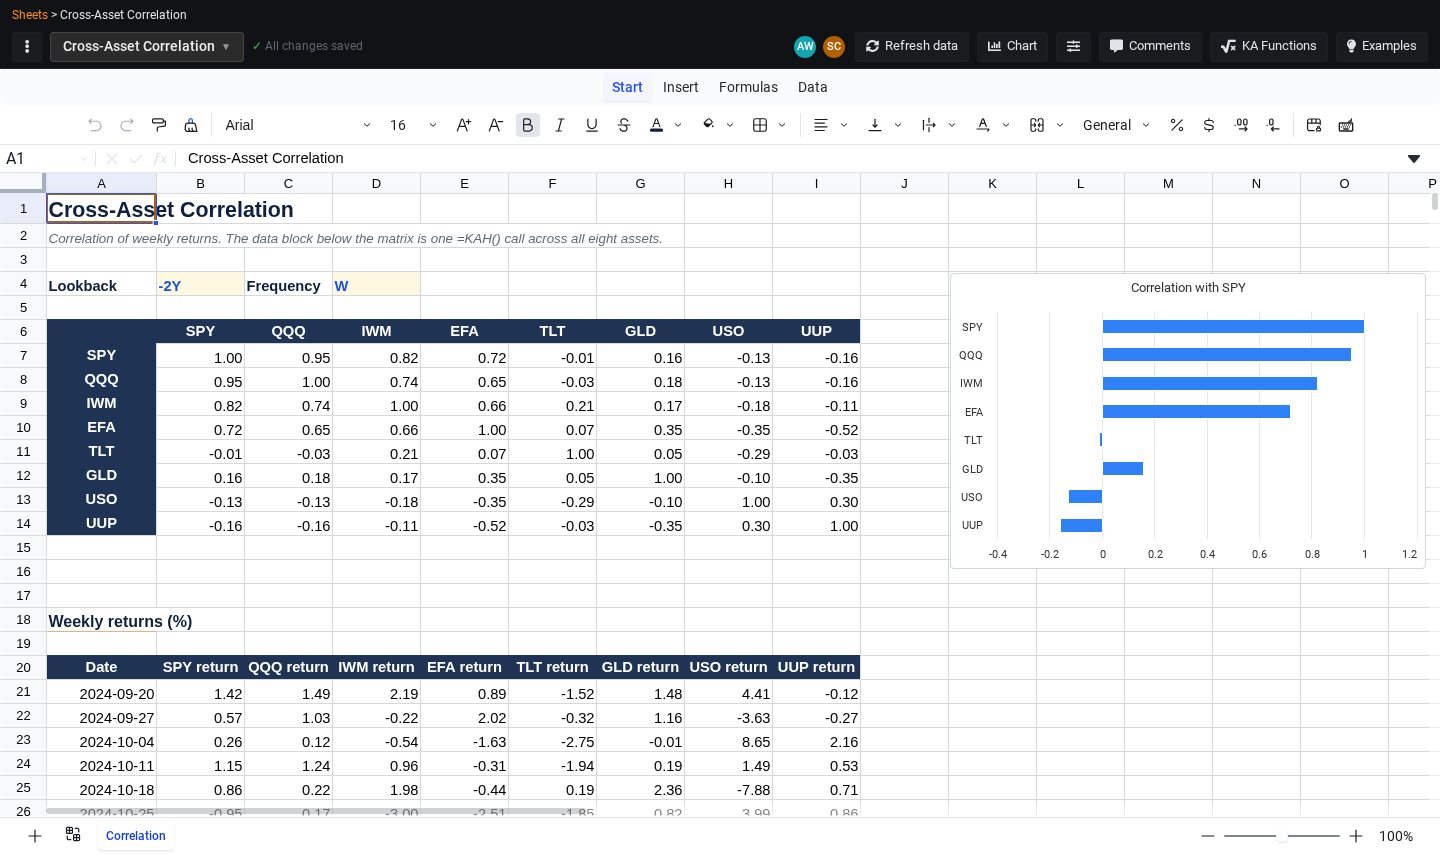
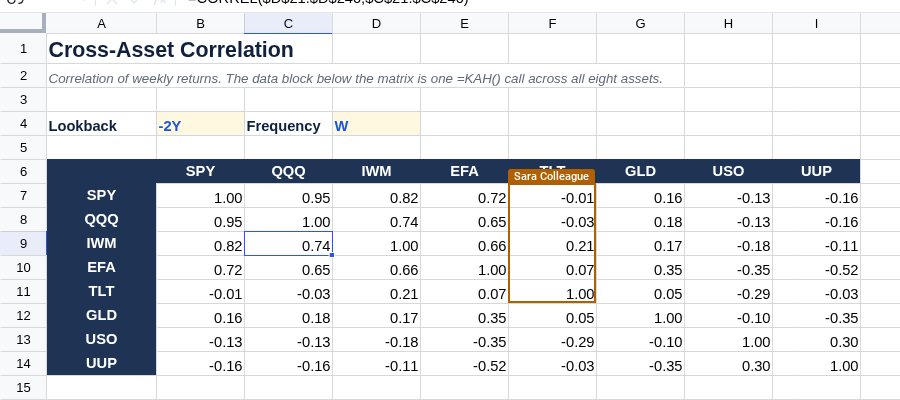
In My › Sheets, click Examples, choose Risk & portfolio and pick Cross-Asset Correlation. It opens as your own sheet with live data, as in the image above: eight assets — SPY, QQQ, IWM, EFA, TLT, GLD, USO and UUP — a correlation matrix, and a chart of each asset's correlation with SPY. Everything on the page comes from one data formula.
Step 2: see how it works
Click cell A20. The whole data block is a single formula:
=KAH("SPY,QQQ,IWM,EFA,TLT,GLD,USO,UUP","return",B4,"",D4)It pulls returns for all eight assets, lined up by date, using the lookback in B4 (-2Y) and the frequency in D4 (W, weekly). Each cell of the matrix is an ordinary spreadsheet formula over that block — for example, the QQQ/SPY cell is:
=CORREL($B$21:$B$240,$C$21:$C$240)The chart reads the first column of the matrix, so it redraws whenever the data does.
Step 3: make it yours
- Change the window. Type
-1Yor-3YintoB4and the matrix recalculates. - Change the frequency. Weekly returns smooth out day-to-day noise;
Mgives a longer-run view. - Mind the range. The matrix reads rows 21 to 240 — 220 periods, or about four years of weekly or eighteen years of monthly returns. For daily data or longer windows, extend the
CORRELranges to match. - Swap an asset. Edit the ticker list inside the
KAHformula and the matching row and column labels. One call handles up to 20 symbols.
Step 4: share it
Open the ⋮ menu in the top-left corner and choose Share. Share with a whole team or with individual colleagues, as an editor or a viewer. Each person gets a notification that opens the sheet, and it appears in their Sheets list and in the sheet switcher under Shared. Viewers can read the sheet and comment on it; only editors can change cells.
Step 5: work on it together
When several people have the sheet open, their avatars appear in the toolbar and edits show up for everyone as they are made. Each person's selection is outlined in their colour, with their name shown as they move, so you can see what a colleague is looking at before you ask. Click an avatar to jump straight to that person's cell.
Step 6: settle questions on the cell
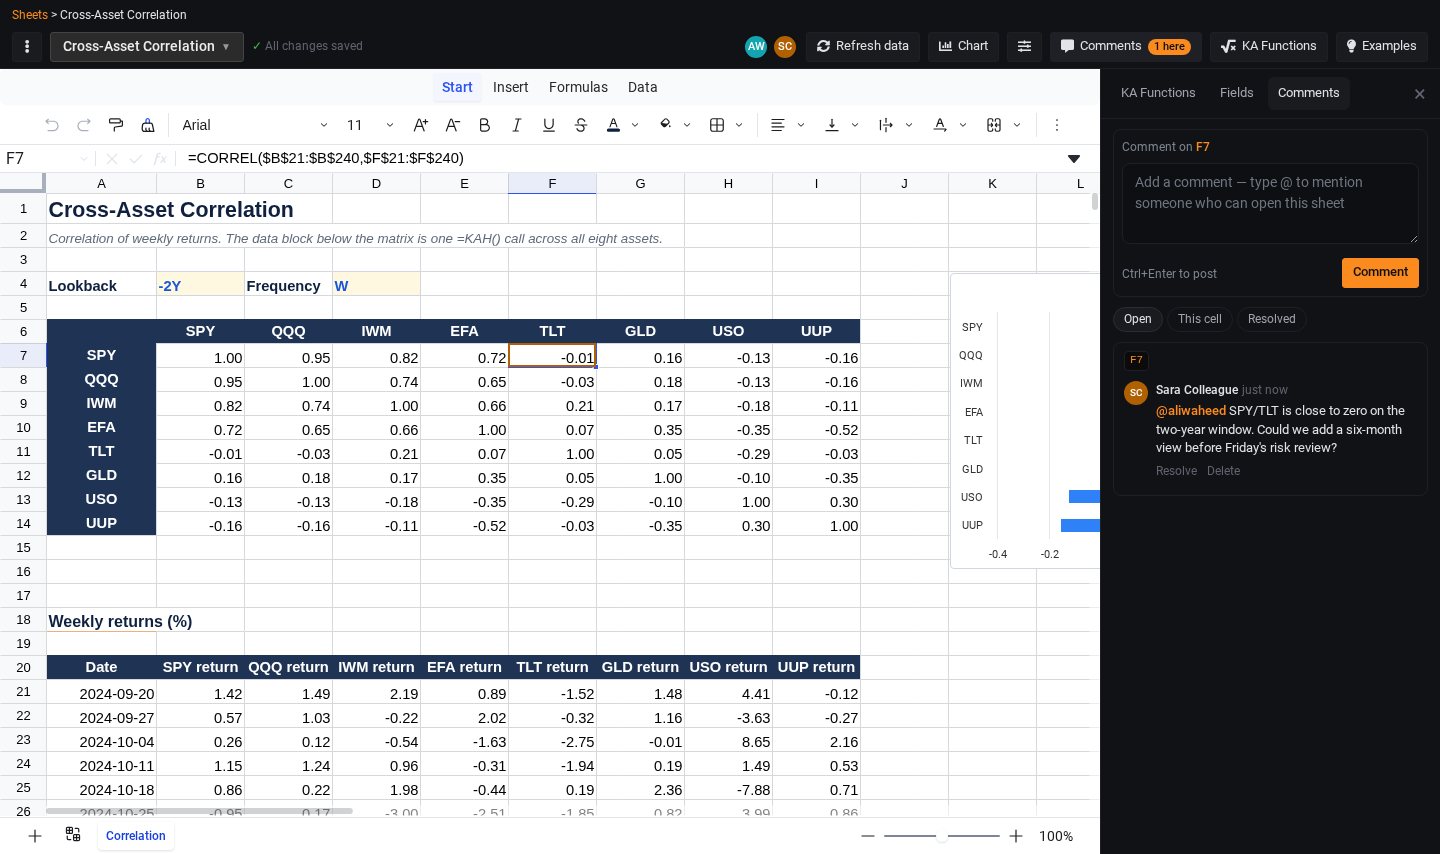
Select a cell and open Comments. Write your note and type @ to mention someone who can open the sheet — they get a notification that opens the sheet with the thread and the cell selected. Replies stay in the thread, and whoever started it (or any editor) can resolve it when the question is answered.
Step 7: keep a record
Sheets keeps a copy of the sheet at most every 30 minutes while it is being edited. Open ⋮ › Version history to restore an earlier state — the current one is saved as a version first, so nothing is lost. On a paid plan, ⋮ › Download exports the workbook to Excel or the current tab to CSV for anyone outside the platform.
Where to go next
The same pattern — one data formula feeding ordinary spreadsheet maths — runs through the other risk examples. Rolling Beta & Correlation tracks how one relationship changes over a moving window, Risk Parity (Inverse Volatility) turns volatilities into weights, and Portfolio Value at Risk adds expected shortfall and the diversification benefit.