A practical guide to market data formulas in Sheets
History, risk statistics, company snapshots and full financial statements — the formulas that turn a blank sheet into a research workspace, with the details that trip people up.
If you have used BDH and BDP in a terminal spreadsheet, the ideas here will feel familiar: one formula for a history, one for a current value, and statements laid out the way a model wants them. This guide walks through each with formulas you can paste into a sheet, and ends with the handful of details that cause most surprises.
1. History as a table: KAH
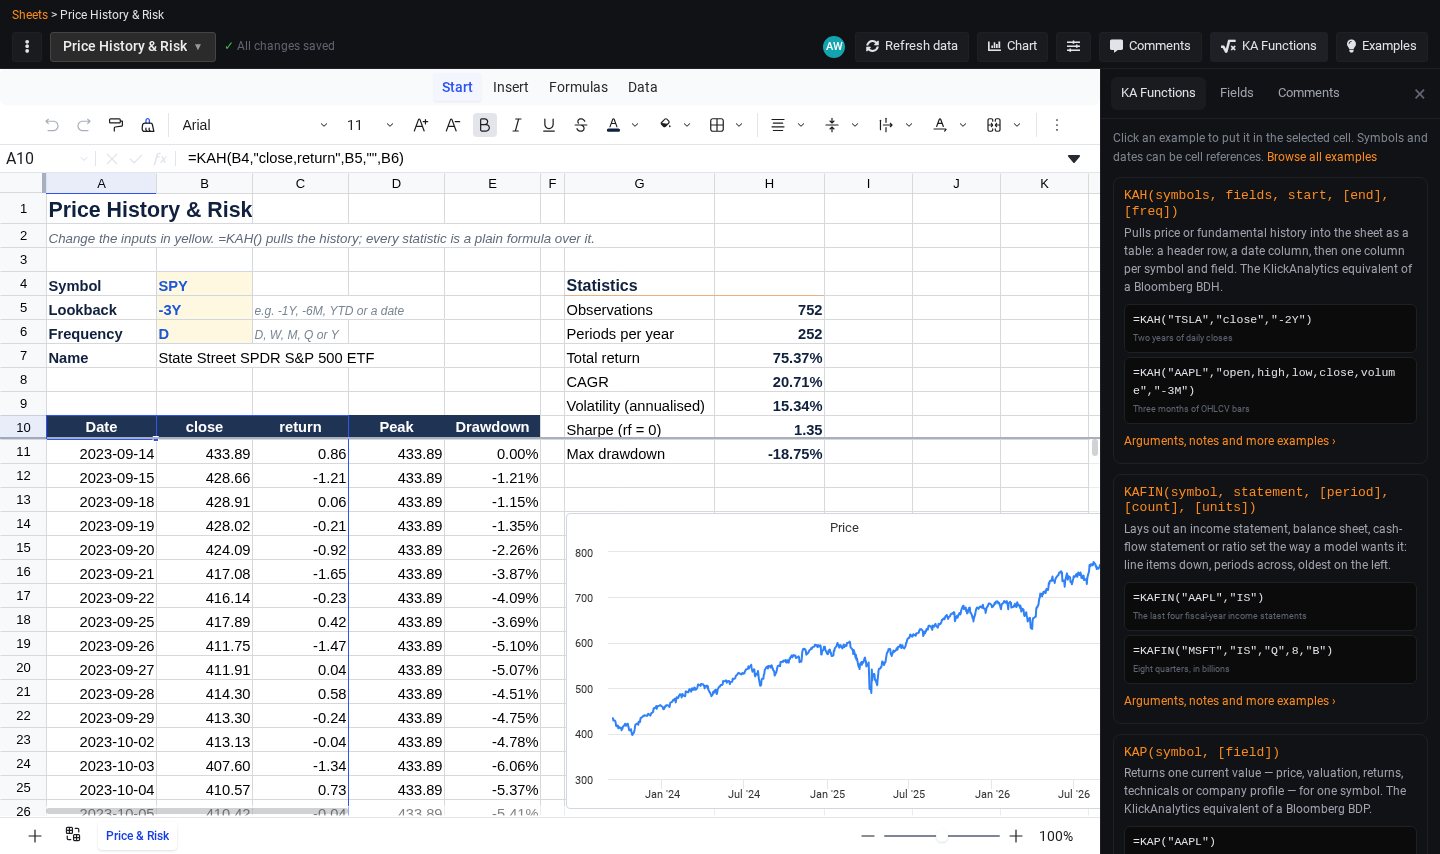
KAH(symbols, fields, start, [end], [freq])Start with one symbol and one field:
=KAH("TSLA","close","-2Y")The result spills down and to the right from the cell: a header row, a date column, then one column per field. Start and end accept a date ("2026-01-02"), a cell holding a date, a relative offset (-5D, -3W, -6M, -2Y) or YTD.
Several fields, several assets
=KAH("AAPL","open,high,low,close,volume","-3M")
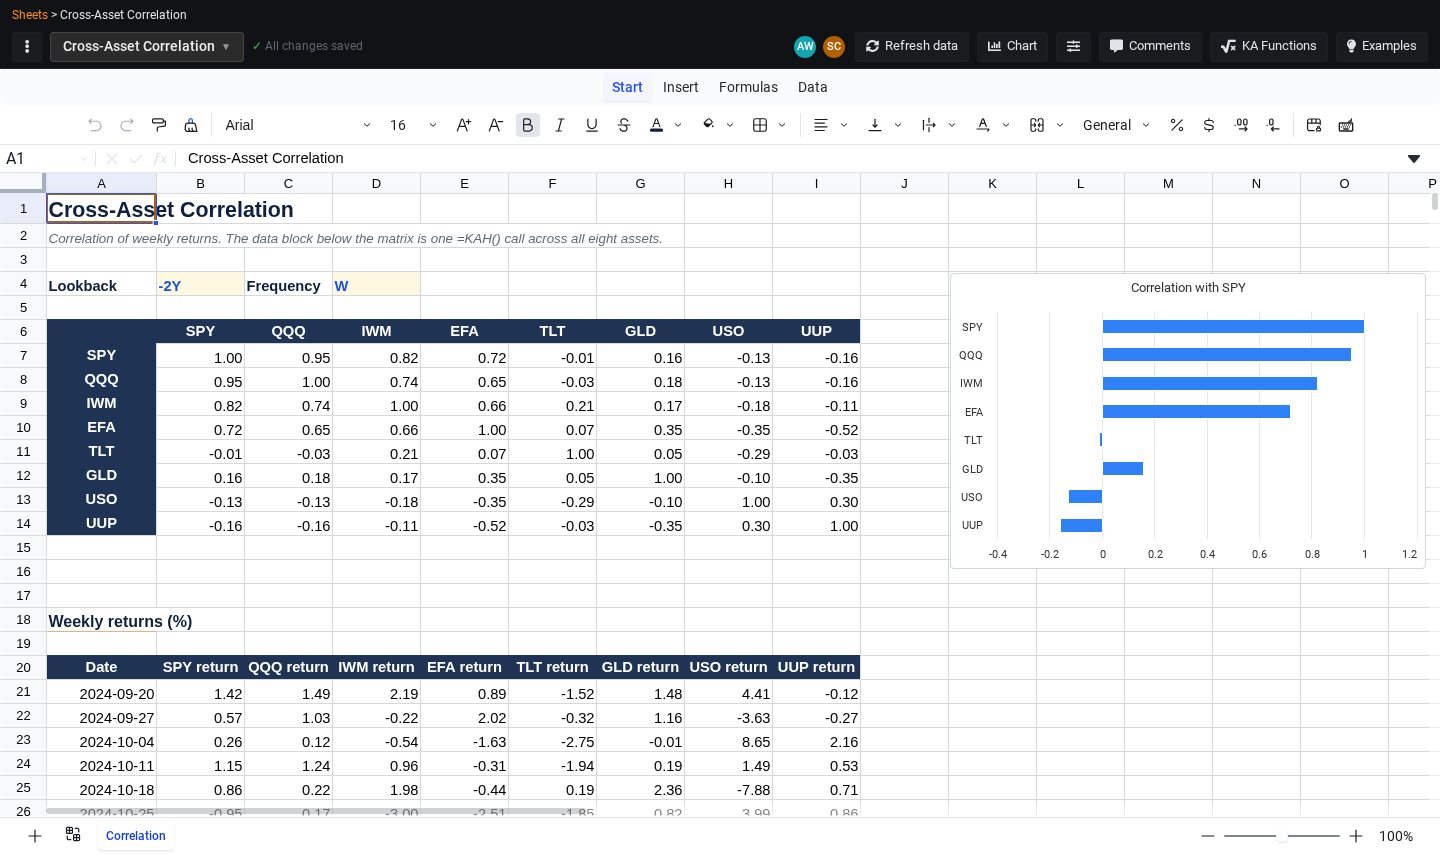
=KAH("SPY,QQQ,TLT,GLD","return","-1Y","","W")
The second formula returns a year of weekly returns for four assets side by side, lined up by date — the raw material for a correlation or allocation model. Up to 20 symbols fit in one call.
With W, M, Q or Y, each row is the last trading day of the period and every field folds the way it should: close is the last close, open the first open, high the highest high, volume is summed and return is compounded.
Fundamentals over time
=KAH("NVDA","revenue,netincome,eps","-8Q","","Q")
=KAH("MSFT","freecashflow","-5FY","","FY")
For fundamentals, -8Q means "the last eight reports". The table gains a Period column (such as "Q2 2026") beside the period-end date, following the company's own fiscal calendar.
2. A statistic in one cell
Because KAH returns an array, you can feed it straight into a spreadsheet function with INDEX(…,0,column), which picks one column of the table:
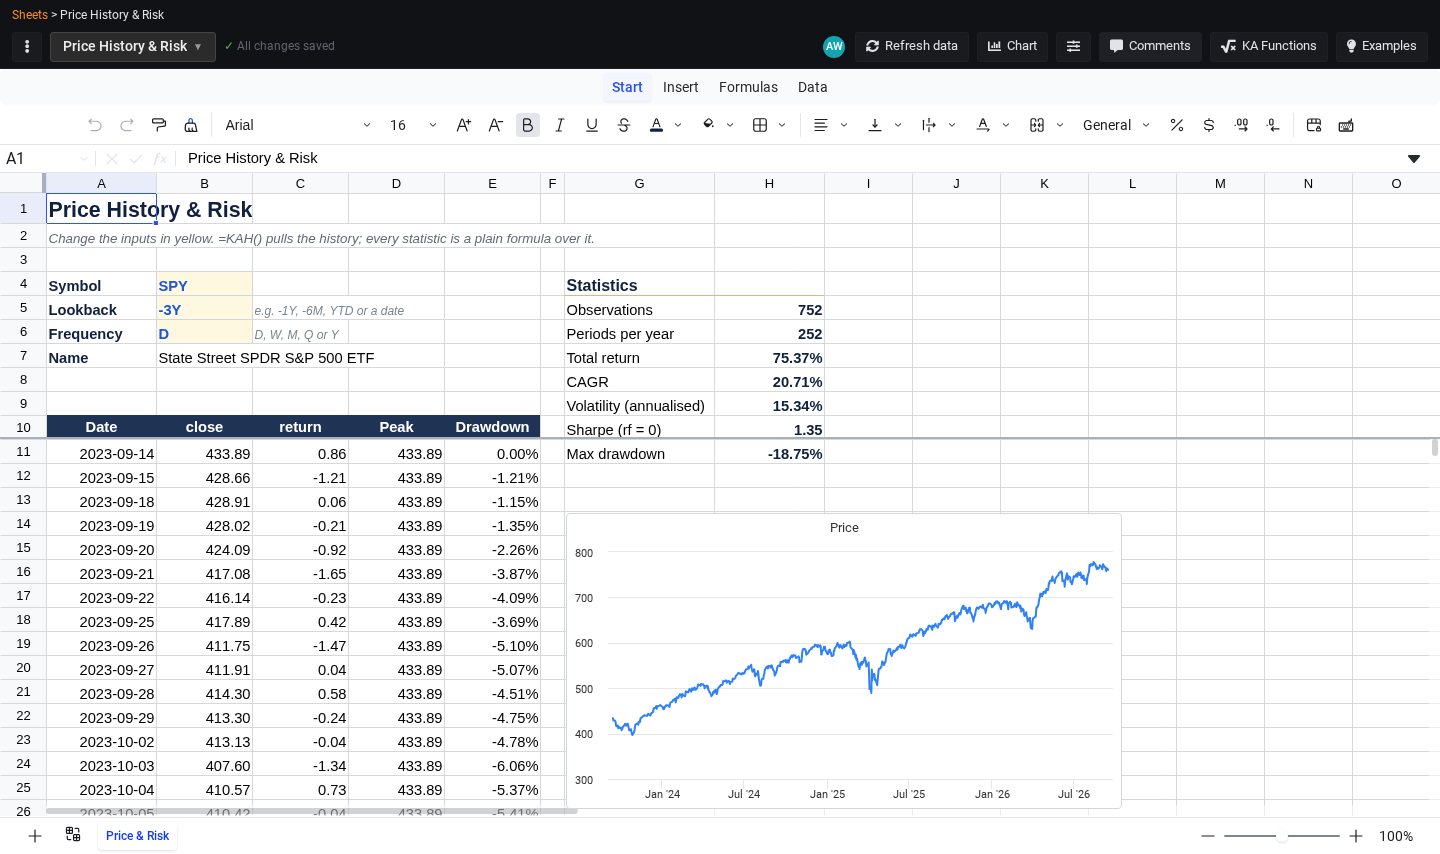
=STDEV(INDEX(KAH("TSLA","return","-1Y"),0,2))/100*SQRT(252)
=MAX(INDEX(KAH("SPY","close","-1Y"),0,2))
=CORREL(INDEX(KAH("SPY,QQQ","return","-1Y","","W"),0,2),INDEX(KAH("SPY,QQQ","return","-1Y","","W"),0,3))
The first is annualised volatility from daily returns, the second the highest close of the last year, the third the correlation of weekly returns between two ETFs. Identical calls are fetched once, so repeating a KAH inside a formula costs nothing extra.
3. A company snapshot: KAP
KAP(symbol, [field])KAP returns one current, end-of-day value. With a ticker in B1:
| Formula | Returns |
|---|---|
=KAP(B1,"name") | Company name |
=KAP(B1,"price") | Last close |
=KAP(B1,"mktcap")/1E9 | Market cap in billions |
=KAP(B1,"forward_pe") | Forward P/E |
=KAP(B1,"return_ytd")/100 | Year-to-date return, ready for a % format |
=KAP(B1,"price")/KAP(B1,"sma200")-1 | Distance from the 200-day moving average |
=KAP(B1,"sector") | Sector |
=IFERROR(KAP(B1,"dividend_yield"),"") | Dividend yield, blank when there is none |
Put tickers down column A and fill =KAP(A2,"forward_pe") down beside them, and you have a screen that refills whenever you change a name. The Fields tab in the editor searches all 200-plus fields.
4. Full statements: KAFIN
KAFIN(symbol, statement, [period], [count], [units])=KAFIN("MSFT","IS","Q",8,"B")
=KAFIN("NVDA","BS","FY",5,"M")
=KAFIN("KO","RATIOS","FY",5)KAFIN lays out an income statement (IS), balance sheet (BS), cash flow (CF) or ratio set (RATIOS) with line items down and periods across, oldest on the left. Row 1 holds the period labels, row 2 the period-end dates, then one row per line item. units scales money and share counts to thousands, millions or billions; EPS and ratios are never scaled.
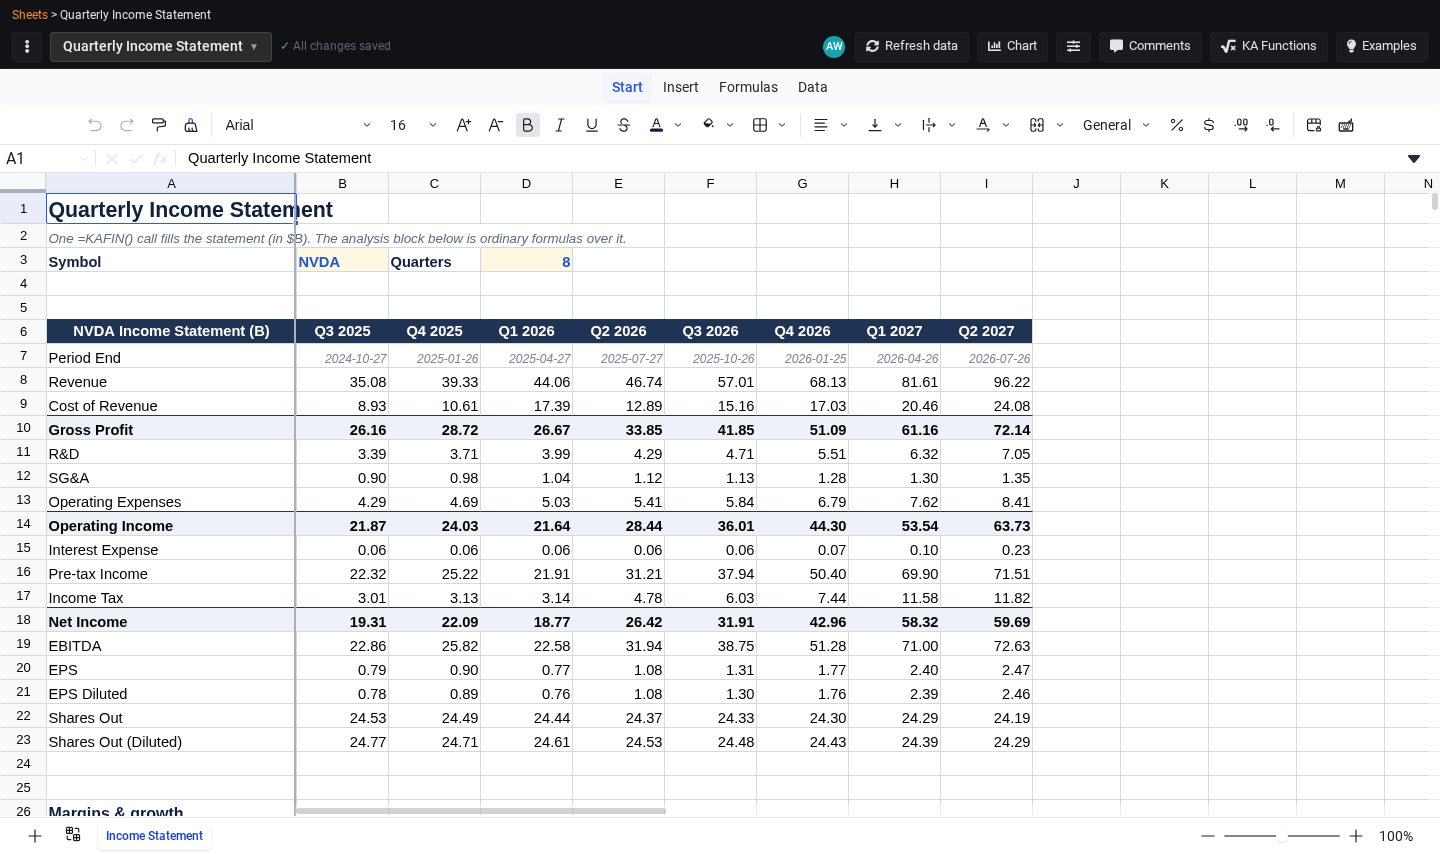
Because the layout is fixed, formulas that point into a statement keep working when you change the symbol. Two useful patterns:
=INDEX(KAFIN("AAPL","IS","FY",3,"B"),3,4)
=XLOOKUP("Net Income",INDEX(KAFIN("MSFT","IS","Q",2),0,1),INDEX(KAFIN("MSFT","IS","Q",2),0,3))
The first takes the latest fiscal-year revenue (row 3 is Revenue; column 4 is the newest of three years). The second looks a line item up by name instead of by position. For trailing-twelve-month figures, sum the last four quarters:
=SUM(INDEX(KAH("NVDA","revenue","-4Q","","Q"),0,3))/1E9Column 3 here is revenue, because quarterly fundamentals from KAH carry both a date and a Period column first.
5. Streaming prices and AI
=KALIVE("AAPL")
=B2*KALIVE(A2)
=AI("Summarise the trend in one sentence",A1:B60)
KALIVE updates in the cell as trades arrive and recalculates everything that depends on it — the second formula is a live position value with shares in B2. Stocks, ETFs, crypto and FX are supported, up to 25 live symbols per sheet; streaming quotes come with a paid plan, and until the first tick the cell shows the last close. AI reads only the ranges you pass it and writes its answer into the cell; change a referenced cell and the answer updates.
The details that trip people up
- Leave room for the spill.
KAHandKAFINfill cells below and to the right. If anything is in the way, the cell shows#SPILL!— clear the area or move the formula. - Returns are in percent, ratios are fractions. A
returnof 1.25 means 1.25%, and so doreturn_ytdand friends: divide by 100 before applying a % format.dividend_yieldand the margin fields are already fractions. - Prices are adjusted.
close,open,highandloware split- and dividend-adjusted. Ask forpx_close,px_open,px_highorpx_lowfor the unadjusted prints. - Don't mix kinds in one call. Price fields and fundamental fields go in separate
KAHformulas. - "Loading…" is temporary. Data formulas show it while a batch is fetched, then fill in together. Refresh data in the toolbar re-fetches every data formula on demand.
- Catch missing values. A company with no dividend or negative earnings returns
#N/Afor that field; wrap the formula inIFERROR. - Mind the row limit. One
KAHreturns up to 10,000 rows (1,000 on the free plan). For long histories, use a longer frequency.
The fastest way to learn the rest is to open an example — Price History & Risk is a good first one — and click into the cells to see how each number is built.