What's New
Product updates, improvements and fixes across the KlickAnalytics platform.
News of the Hour
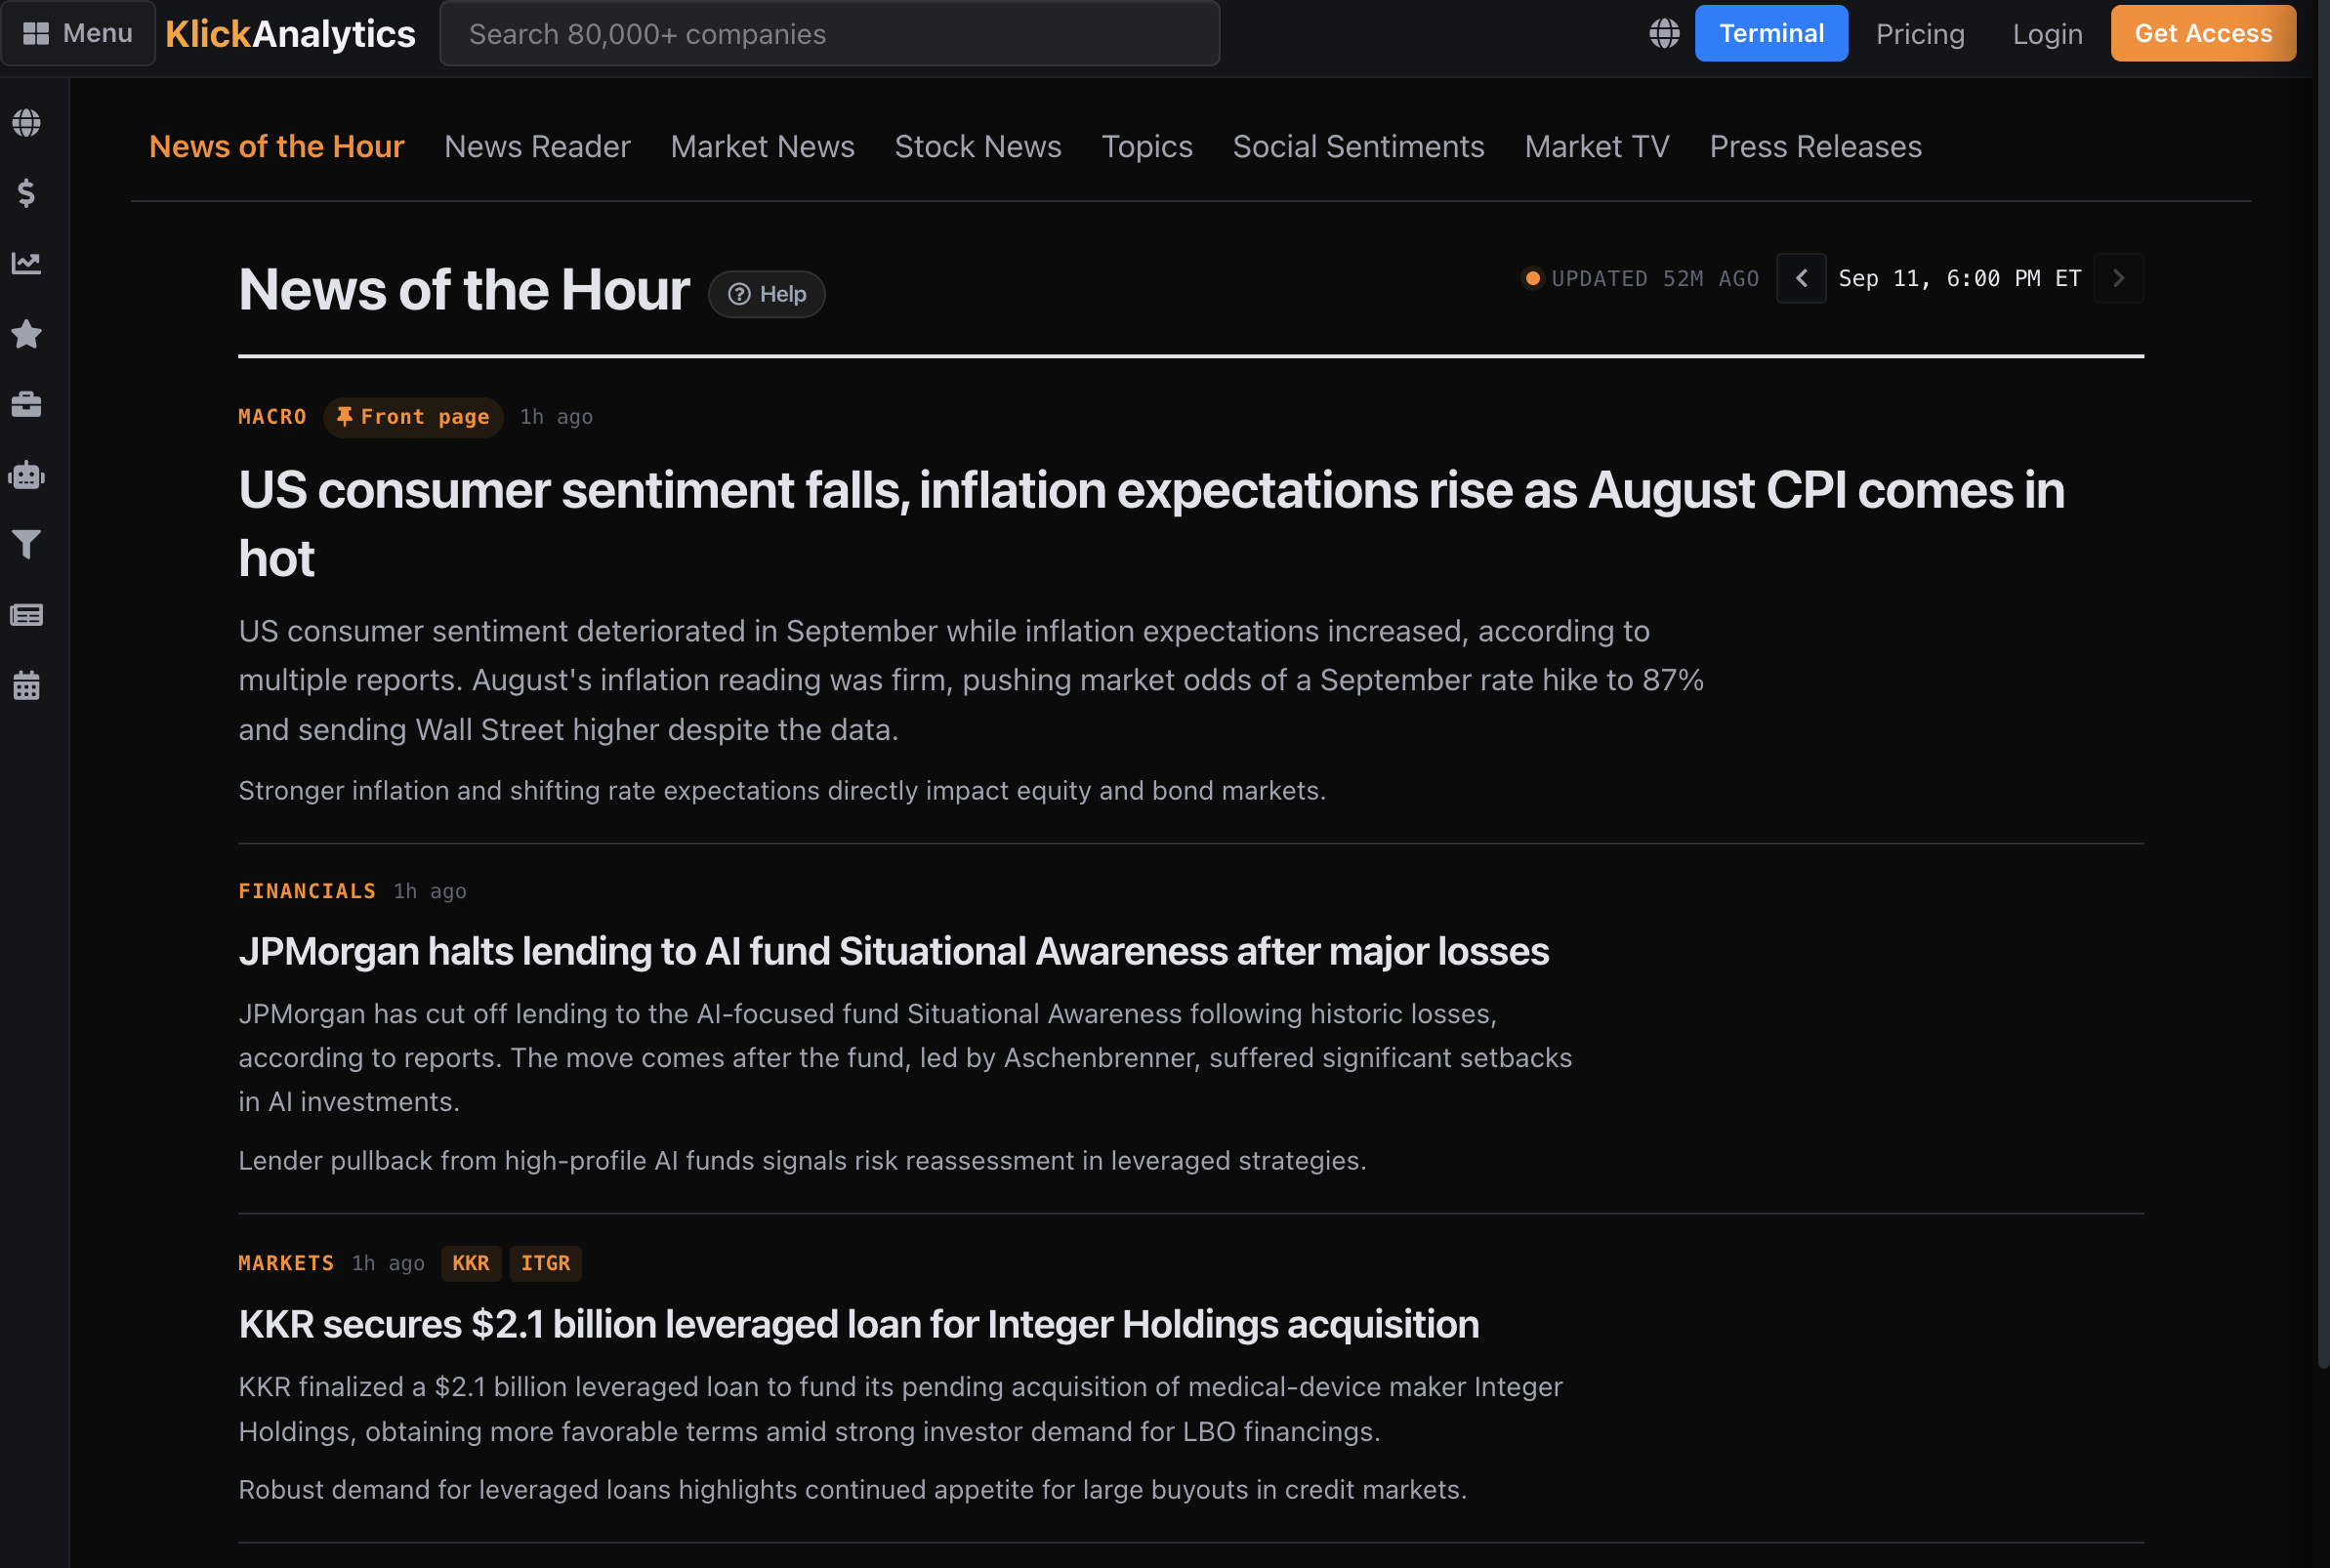
Markets move quickly, but not every headline deserves your attention.
KlickAnalytics’ new News of the Hour identifies and organizes the most important market developments from each hour—giving you a concise view of what happened, why it matters, and which companies or markets may be affected.
With News of the Hour, you can:
-
Review the most important stories from the latest hour
-
See a concise summary beneath every headline
-
Understand why each development matters to the market
-
Browse stories organized by macro, markets, financials, technology, and other major categories
-
Identify related companies through symbol tags
-
See which story has been selected for the front page
-
Move backward and forward through previous hourly editions
-
Check exactly when each edition was generated and updated
-
Quickly move into deeper news coverage across KlickAnalytics
Instead of scrolling through thousands of headlines, users receive a focused, continuously updated briefing built around market significance.
One hour. The stories that mattered. The context behind them.
To access: From the Menu > Newsroom > News of the hour
Browse 100+ Apps by Market Player
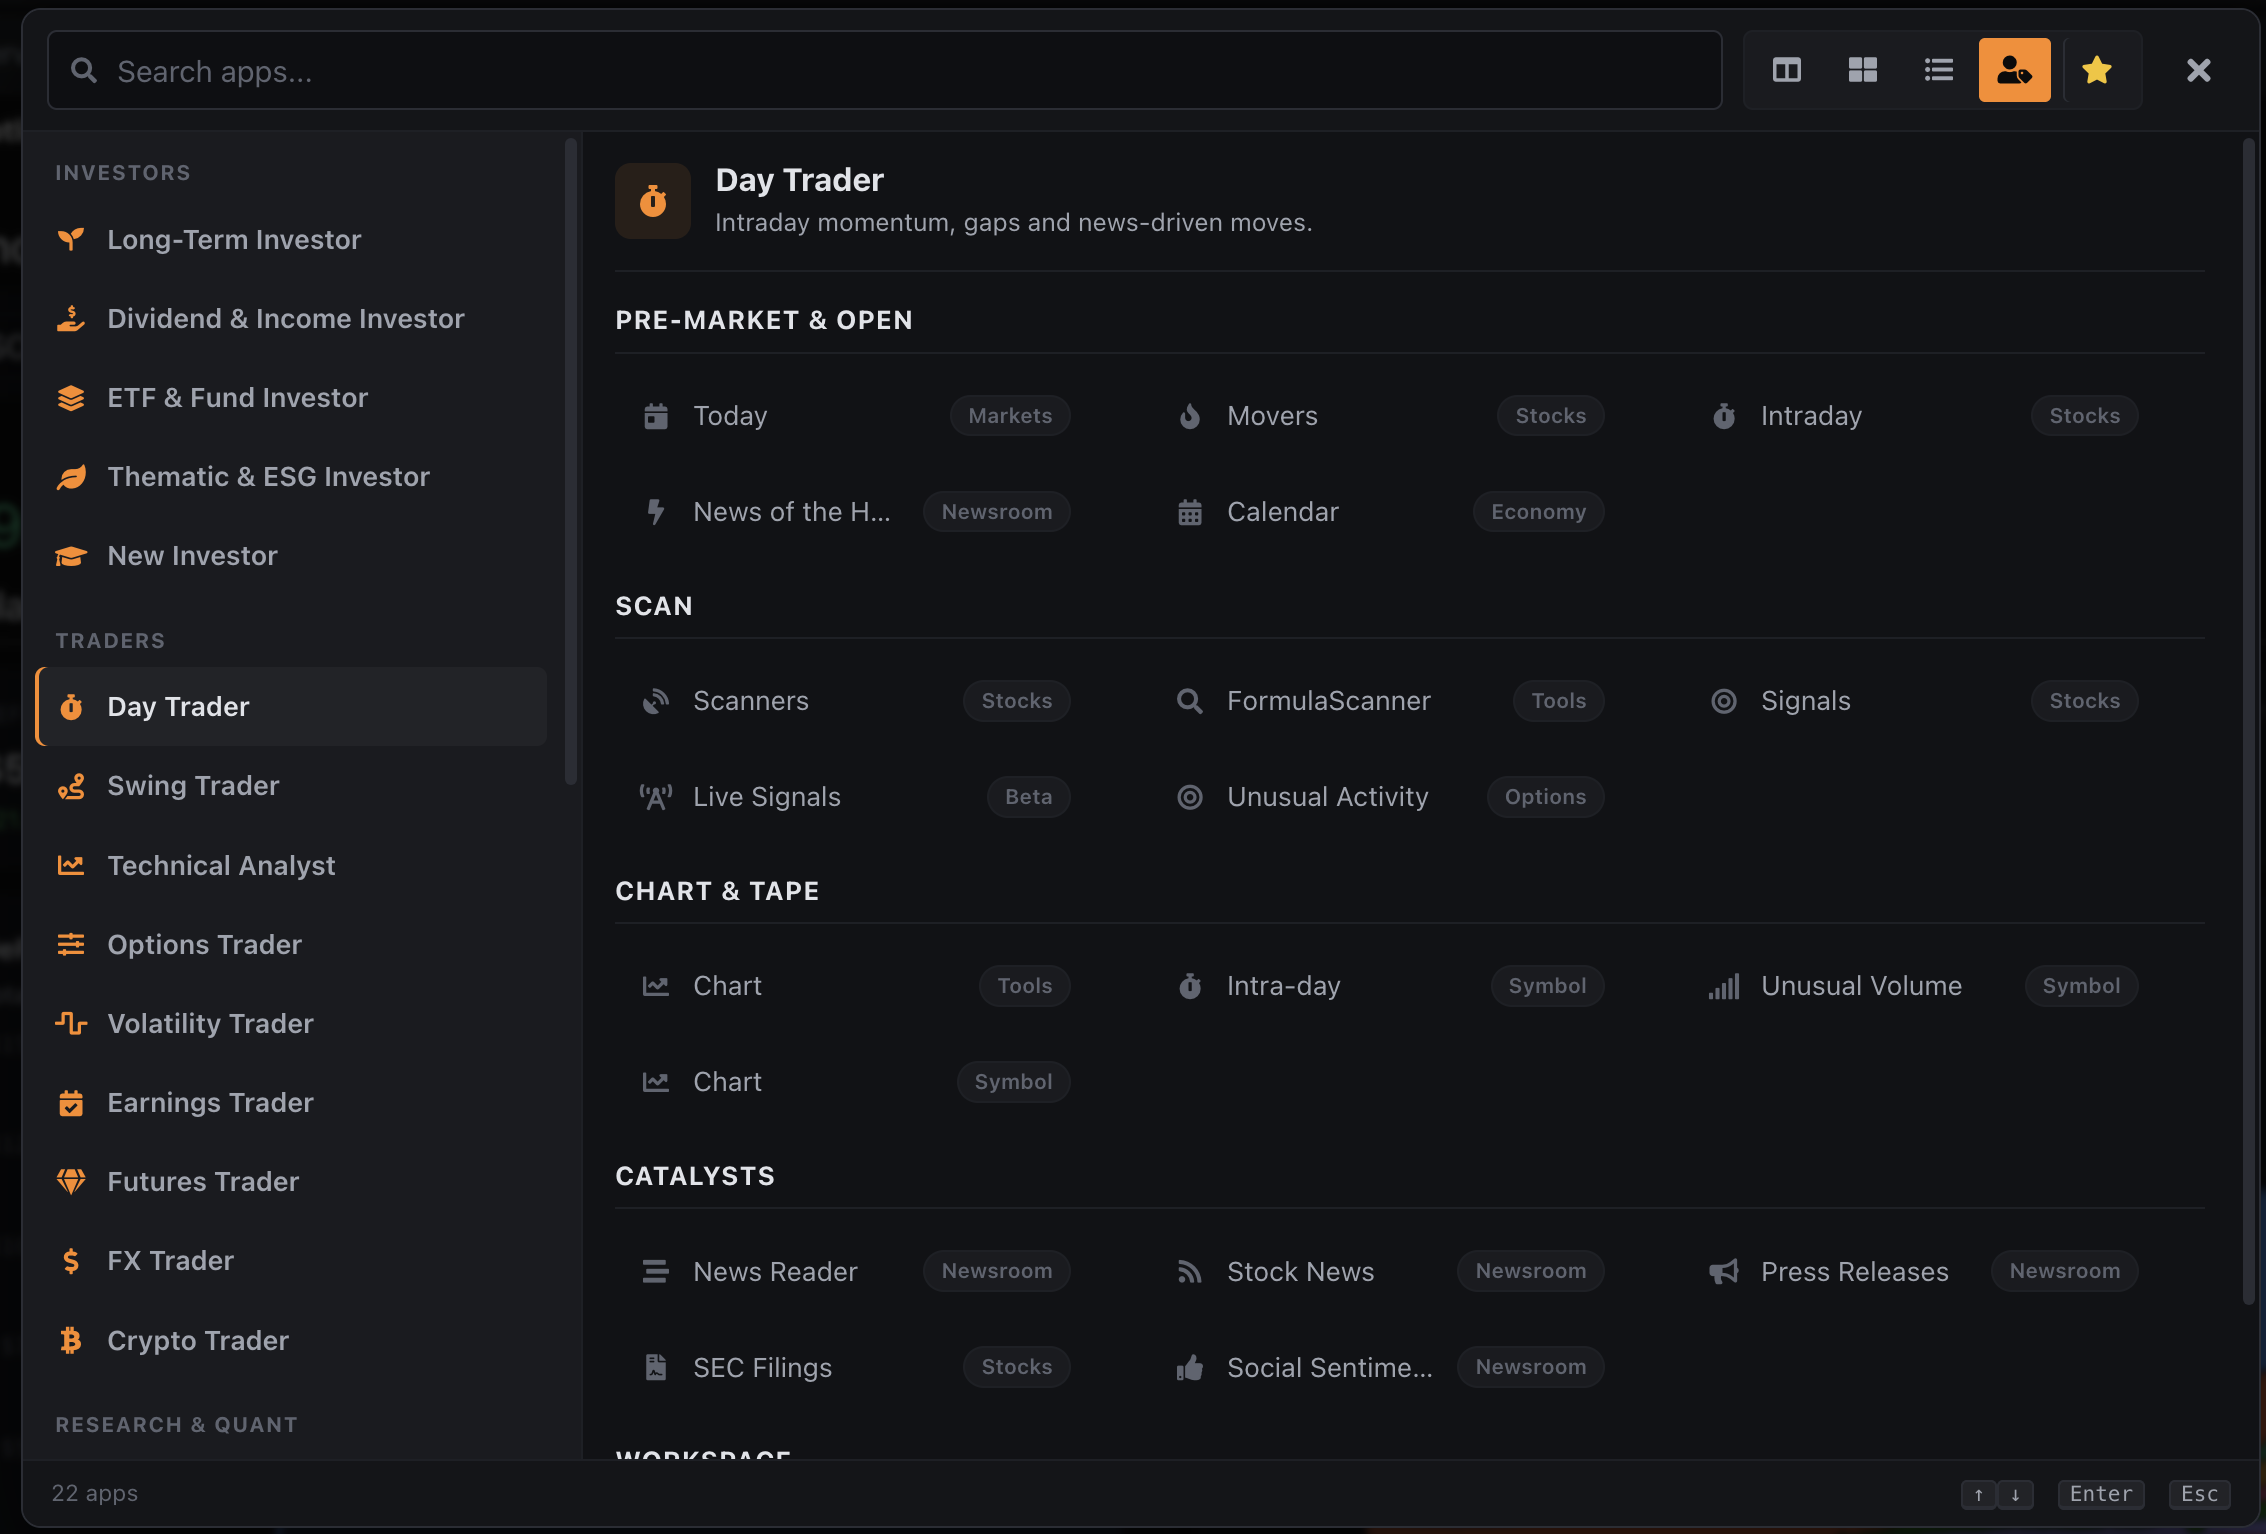
KlickAnalytics now makes it easier to discover the most relevant tools for your role in the financial markets.
In addition to searching through every available app, you can now also browse purpose-built collections organized by Market Player, including:
-
Portfolio managers
-
Traders
-
Equity research analysts
-
Quantitative analysts
-
Investment bankers
-
Hedge funds
-
Private equity professionals
-
Risk managers
-
Wealth managers
-
Economists and market strategists
Each Market Player view brings together the apps, analytics, reports, and workflows most relevant to that role—from portfolio analysis and trade research to company comparisons, valuation, risk, screening, market monitoring, and AI-powered intelligence.
Whether you are researching a company, monitoring a portfolio, preparing an investment committee review, or searching for a new opportunity, KlickAnalytics helps you find the right tool faster.
Choose your role. Discover your tools. Build your workflow.
To access: Click on Menu > and then select the people icon and select your player type
Introducing Custom Series: Turn Your Data Into a KlickAnalytics Symbol
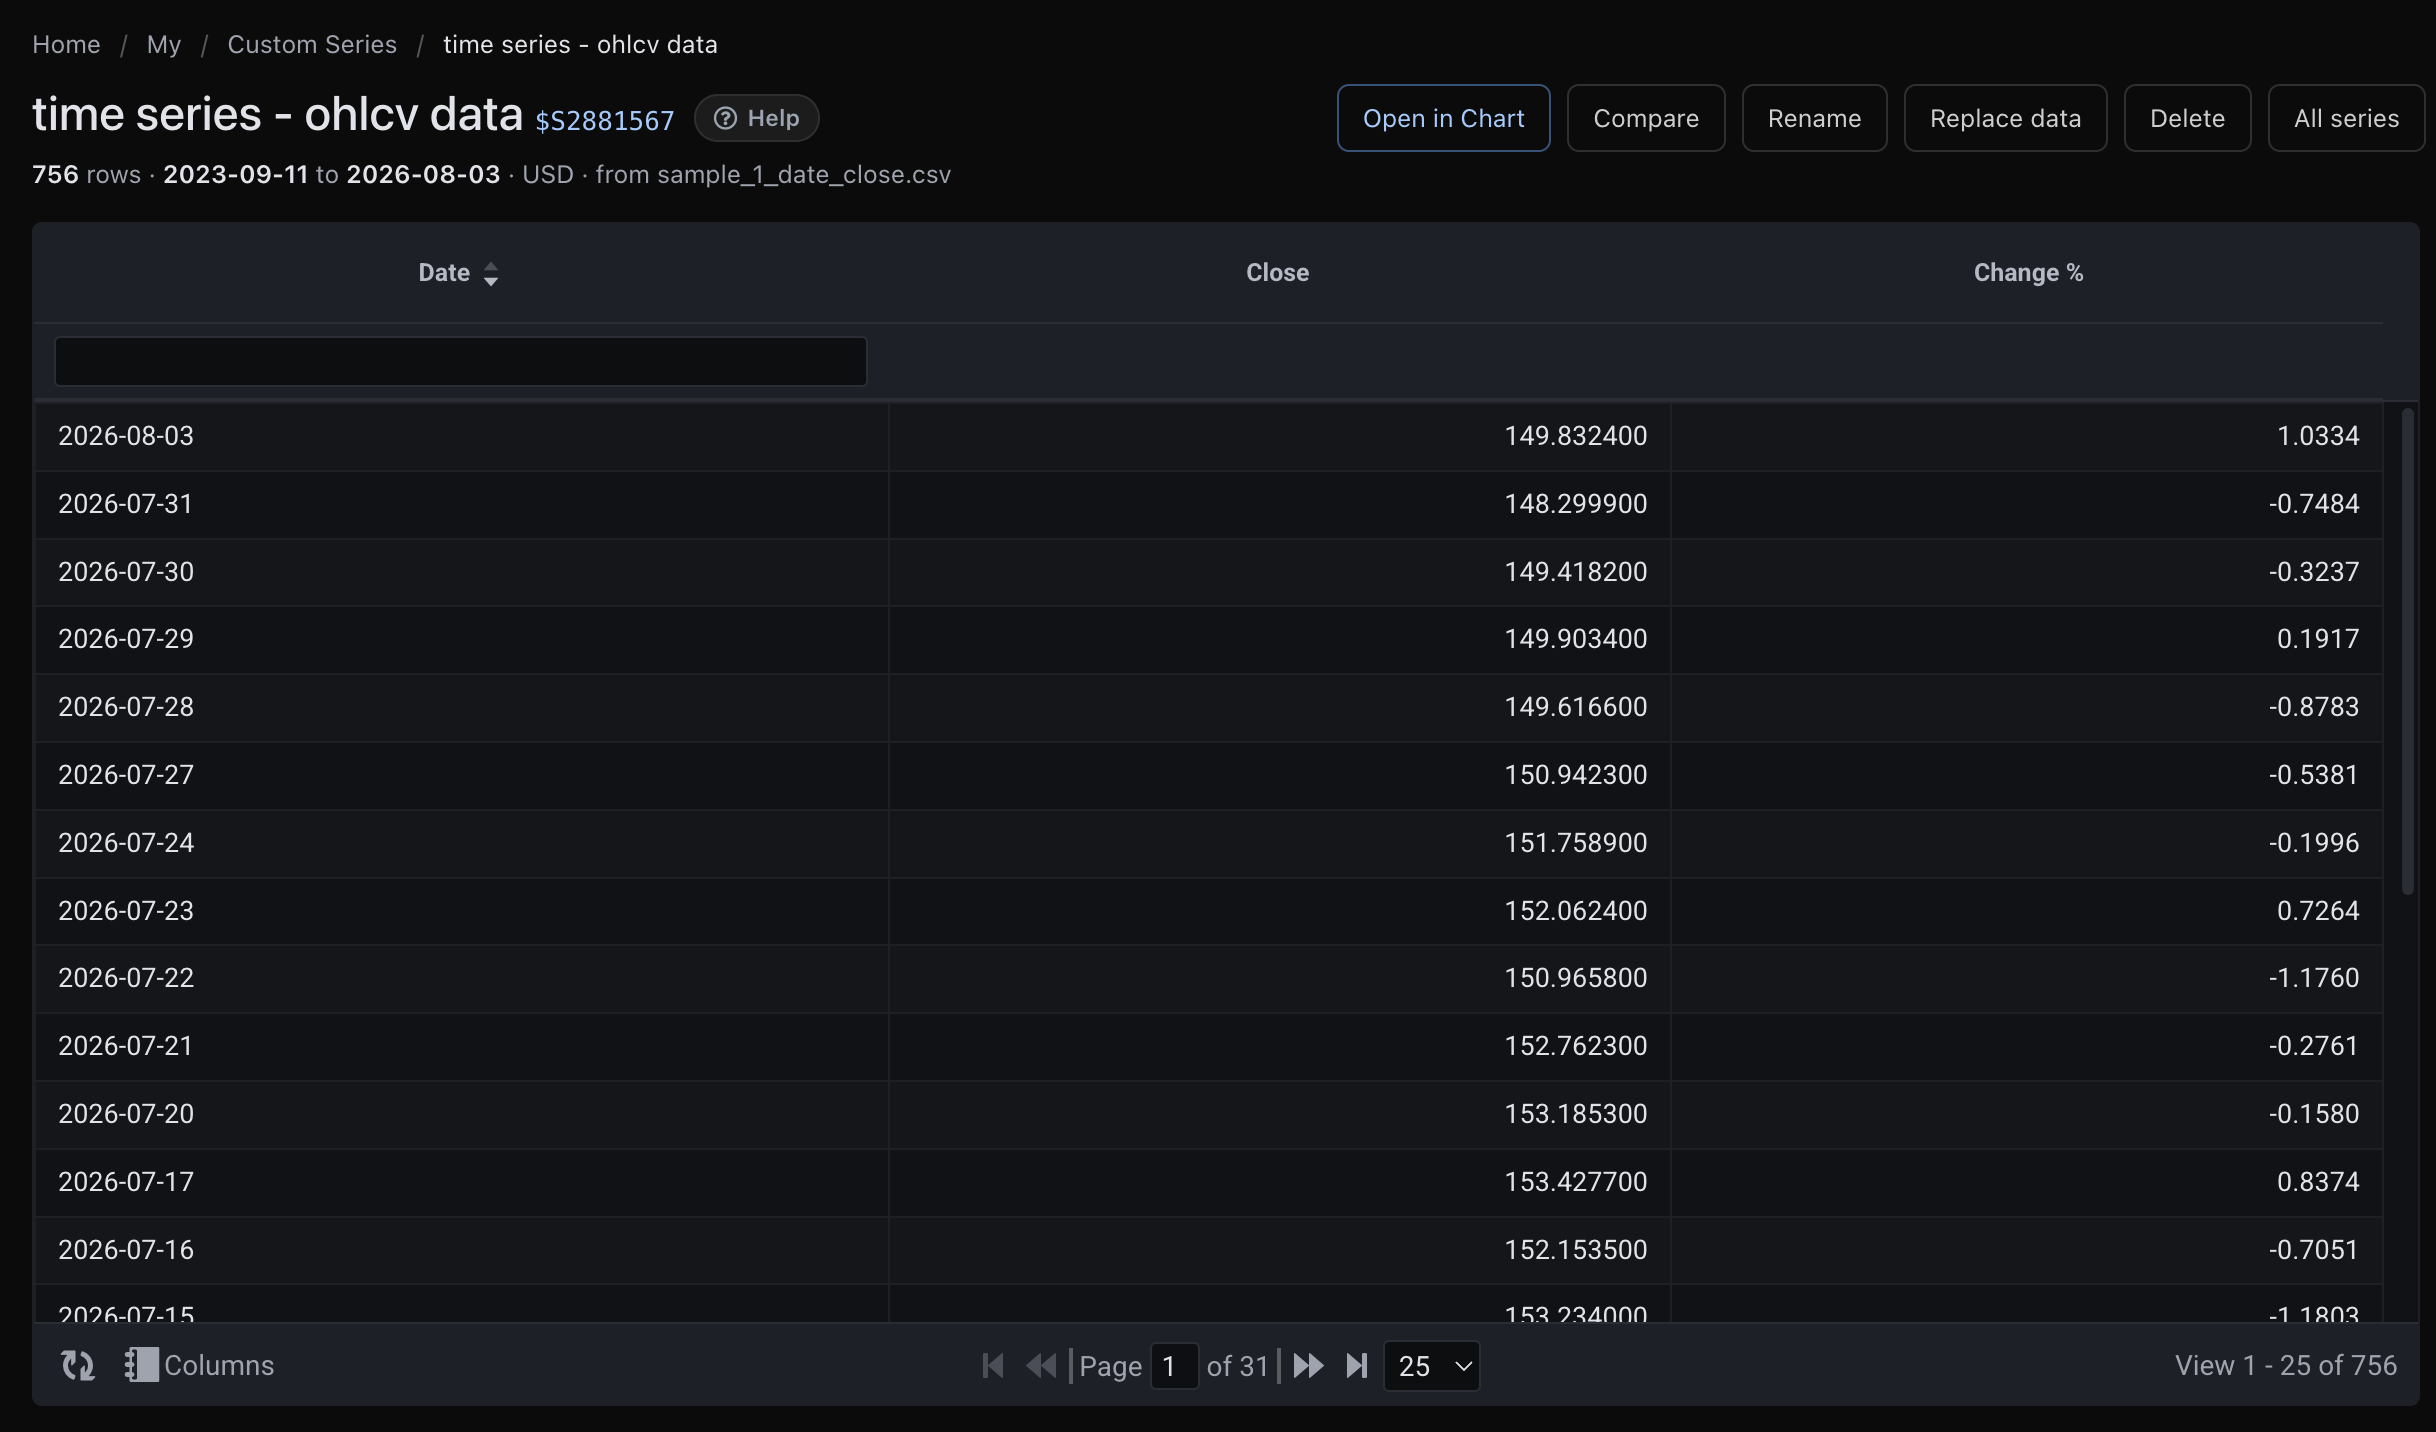
KlickAnalytics now lets you upload your own time-series data and transform it into a custom symbol that works across the entire platform.
Upload a file containing closing prices or complete OHLC data—open, high, low, and close—and KlickAnalytics assigns it a unique symbol. From that point forward, your series can be searched, charted, compared, and analyzed alongside stocks, indices, currencies, commodities, cryptocurrencies, and other market instruments.
With Custom Series, you can:
-
Upload close-only or complete OHLC time-series data
-
Create a unique symbol for every uploaded series
-
Review the imported observations, dates, prices, and percentage changes
-
Open the series directly in an interactive chart
-
Compare it with any supported market symbol
-
Use it throughout KlickAnalytics wherever custom symbols are supported
-
Rename a series without rebuilding it
-
Replace its underlying data as new observations become available
-
Organize and manage all custom series from one place
-
Apply KlickAnalytics’ analytical ecosystem to proprietary data
Custom Series can represent far more than traditional market prices, including:
-
Proprietary indices and investment signals
-
Portfolio and strategy performance
-
Alternative-data indicators
-
Economic and industry measures
-
Model outputs and forecasts
-
Healthcare, legal, climate, operational, or business data
-
Any measurable variable that changes through time
This means your internal data no longer needs to remain isolated in a spreadsheet or separate system. It can become a native analytical object inside KlickAnalytics—ready to be viewed and compared like any other symbol.
Upload a time series, which automatically create a symbol, and now Analyze it everywhere.
To access: From the Menu > My > Custome Series
Introducing KlickAnalytics Copilot — Now on Every Page
Introducing KlickAnalytics Copilot—Now on Every Page
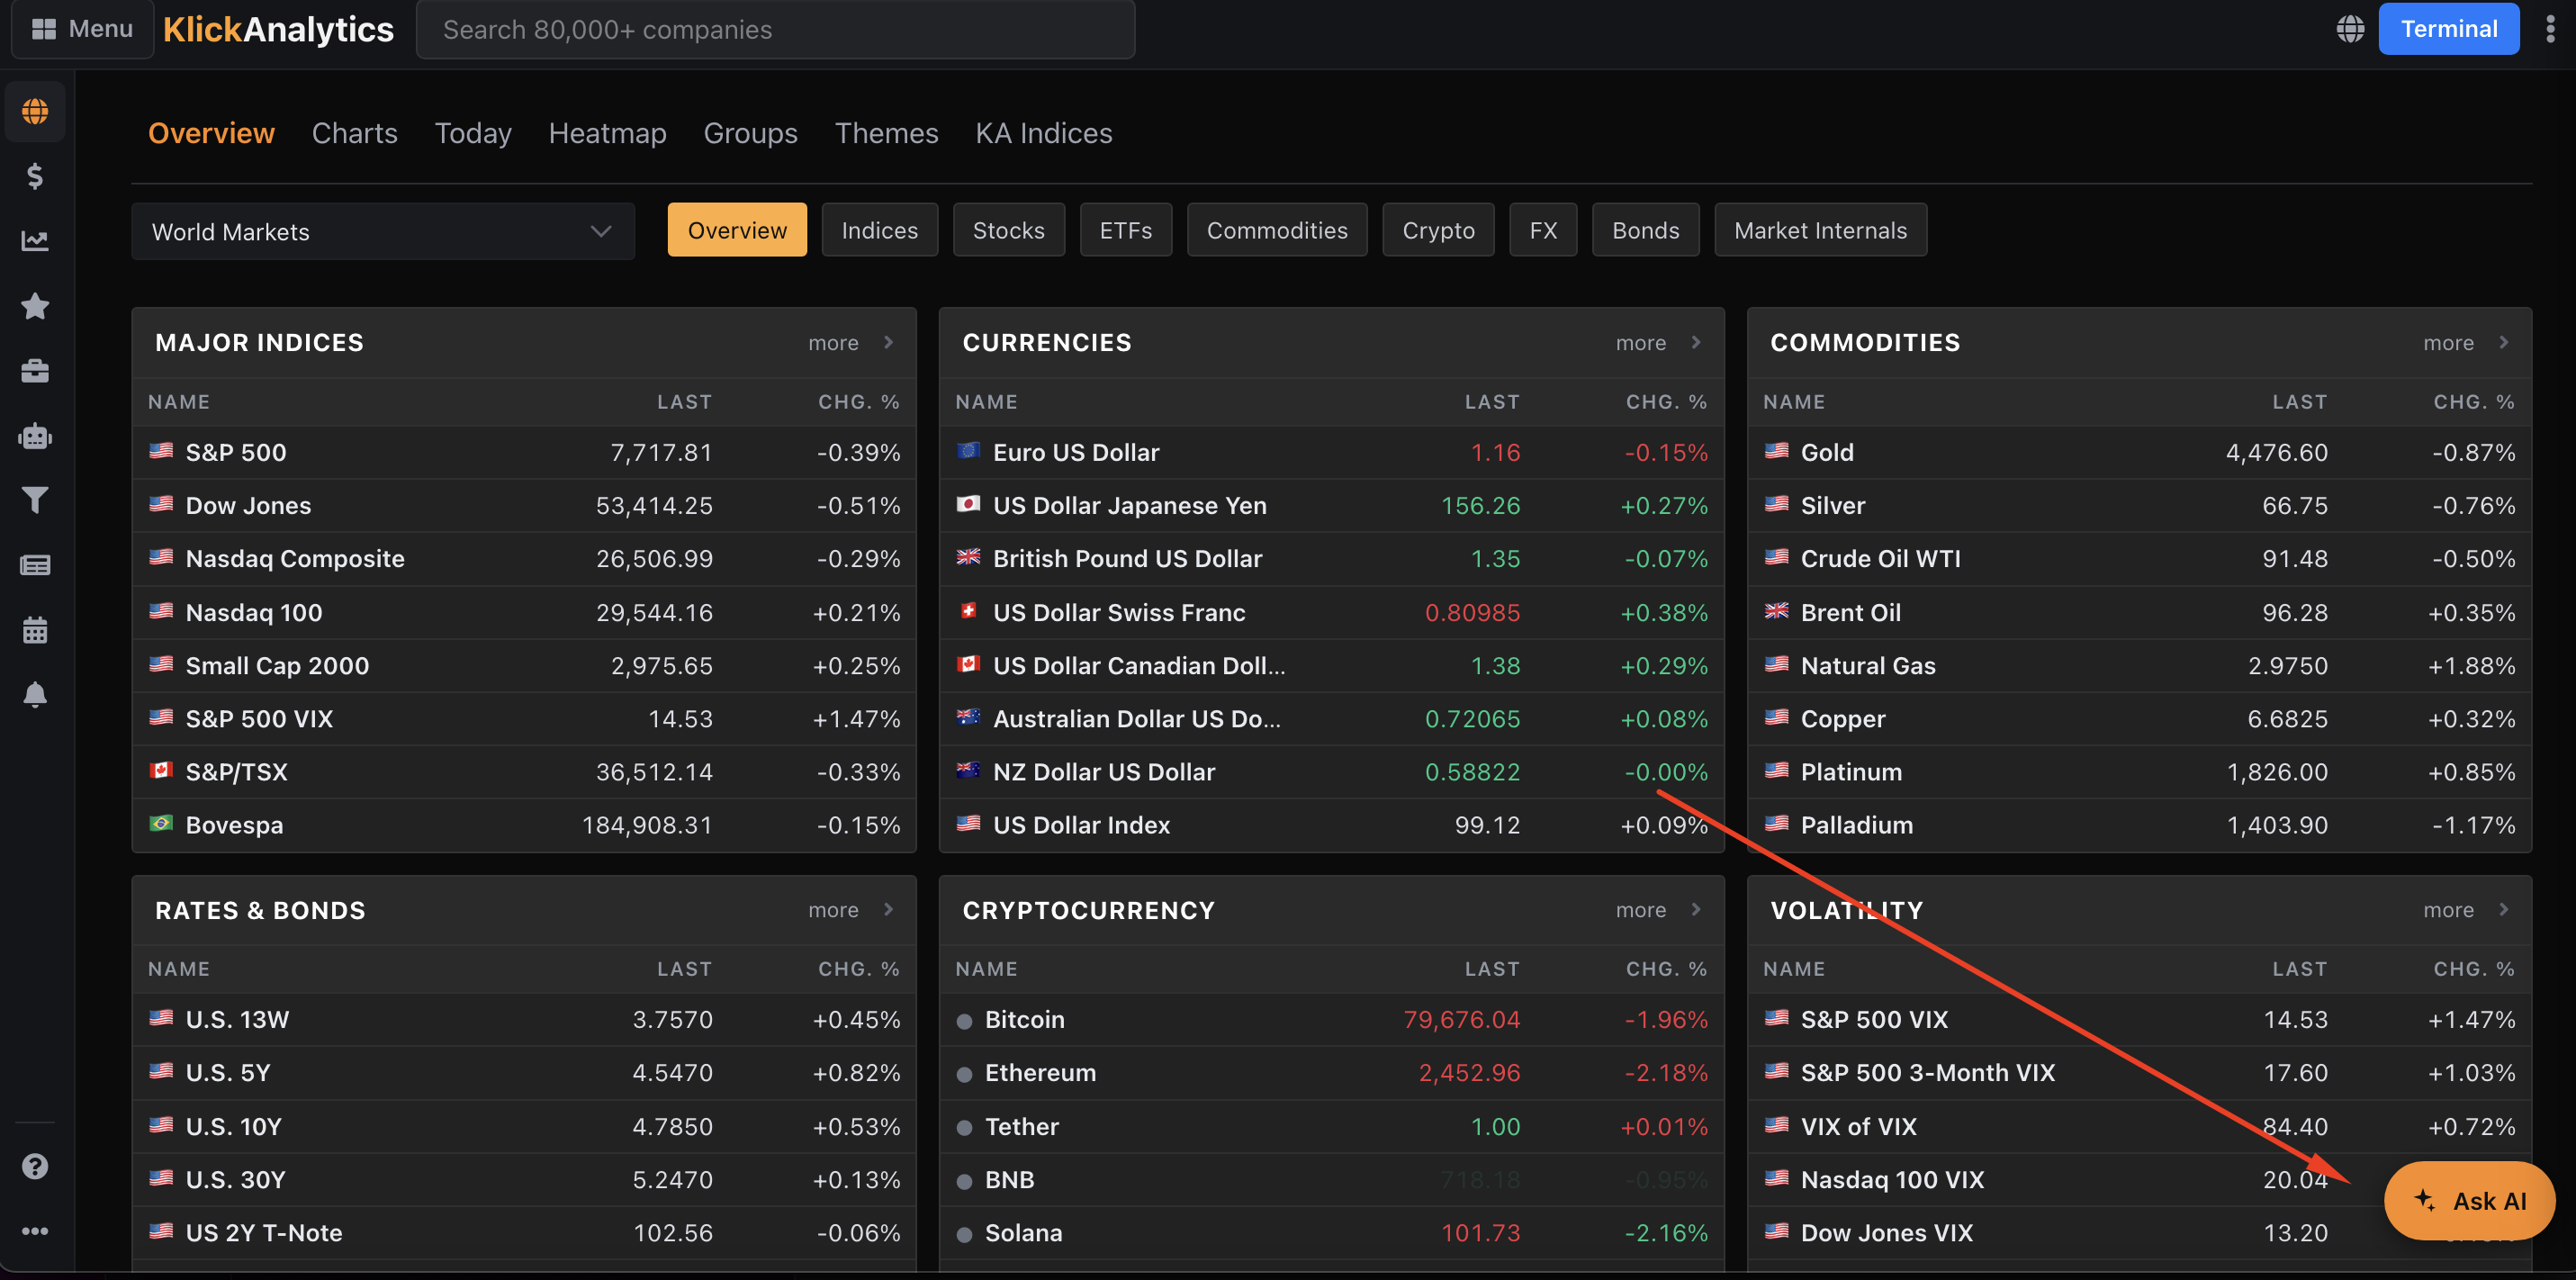
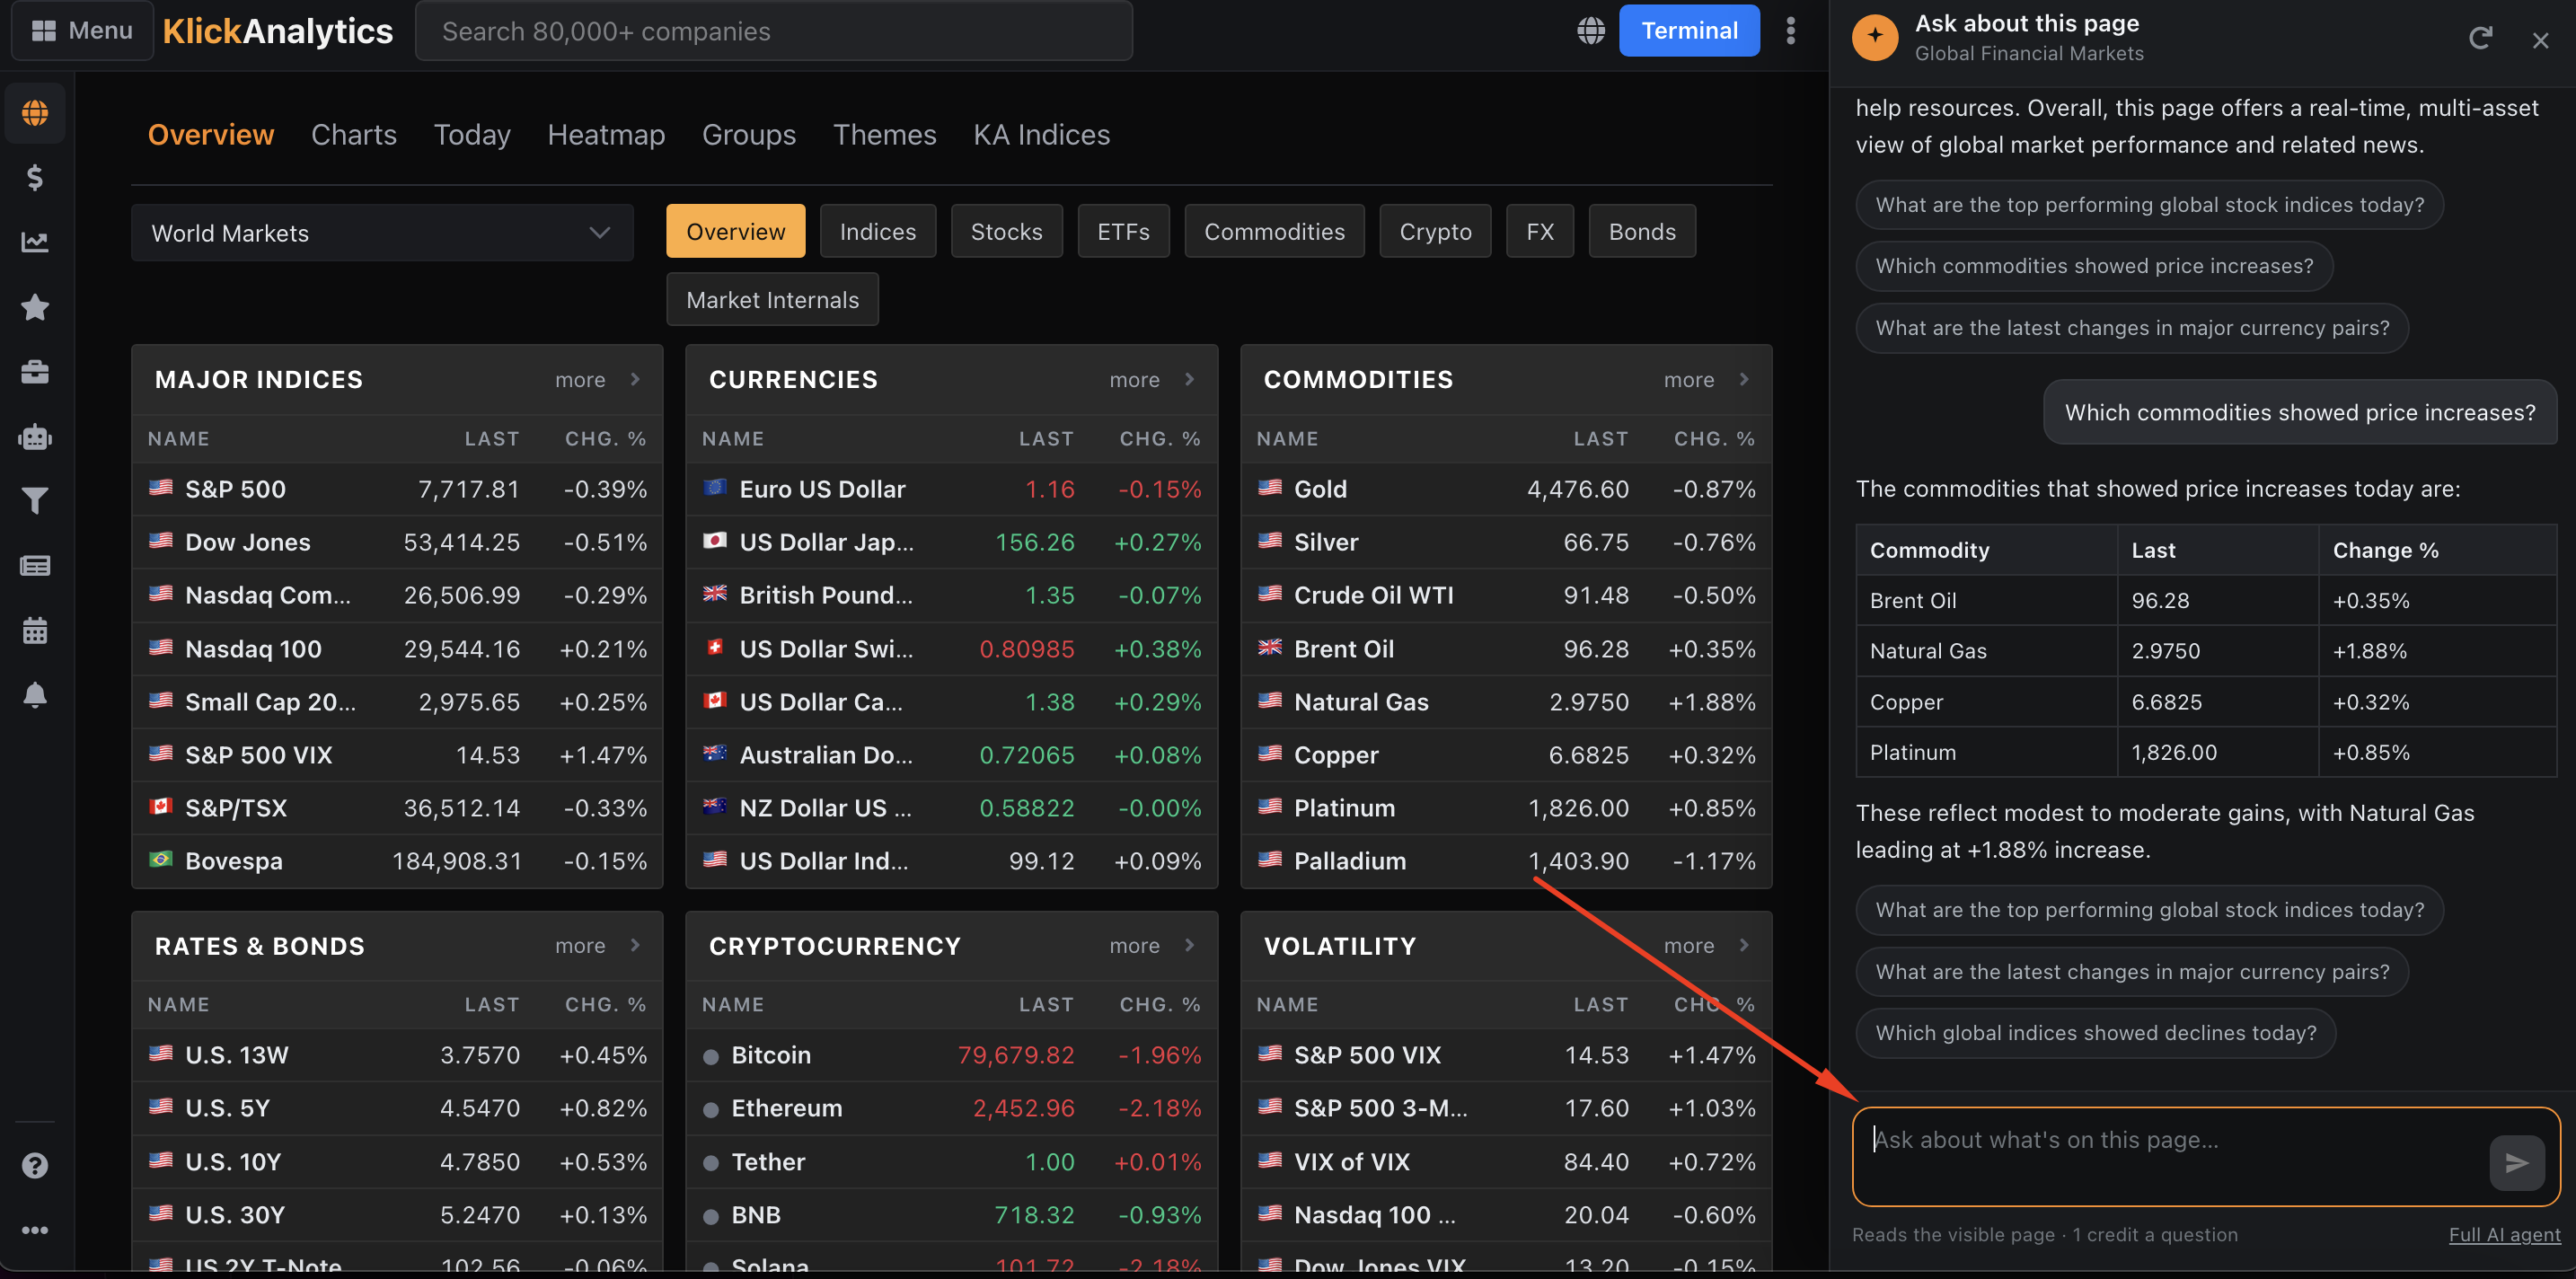
We have added a context-aware AI Copilot across KlickAnalytics, giving users a faster and more natural way to understand the information directly in front of them.
The new Ask AI button is available on every supported page. Open it, ask a question about what you are viewing, and Copilot reads the visible page to provide an immediate, page-specific answer.
With KlickAnalytics Copilot, users can:
-
Ask questions about the data currently displayed
-
Receive answers grounded in the visible page
-
Summarize complex tables, charts, metrics, and market activity
-
Identify leaders, laggards, trends, risks, and unusual movements
-
Compare instruments or categories shown on the page
-
Use suggested questions to begin exploring immediately
-
Ask follow-up questions while maintaining the page context
-
Turn displayed data into clear tables and concise explanations
-
Move to the full AI agent when broader or deeper research is required
For example, while viewing World Markets, a user can ask:
-
Which global indices are performing best today?
-
Which commodities are gaining?
-
What changed across the major currency pairs?
-
Where is volatility increasing?
-
What are the most important cross-market signals on this page?
The Copilot adapts to where the user is working. On a symbol page, it can explain company-specific data. On a screener, it can interpret the visible results. On a portfolio, it can help identify concentration and performance drivers. On market pages, it can summarize movements across asset classes.
Users no longer need to leave the page, copy figures, or explain what they are looking at. The context is already there.
Every page is now interactive. Every dataset can become a conversation.
See it. Ask it. Understand it—with KlickAnalytics Copilot.
To access: click on the floating button called 'Ask AI'
Introducing Matrix: A New Way to Conduct Financial Research
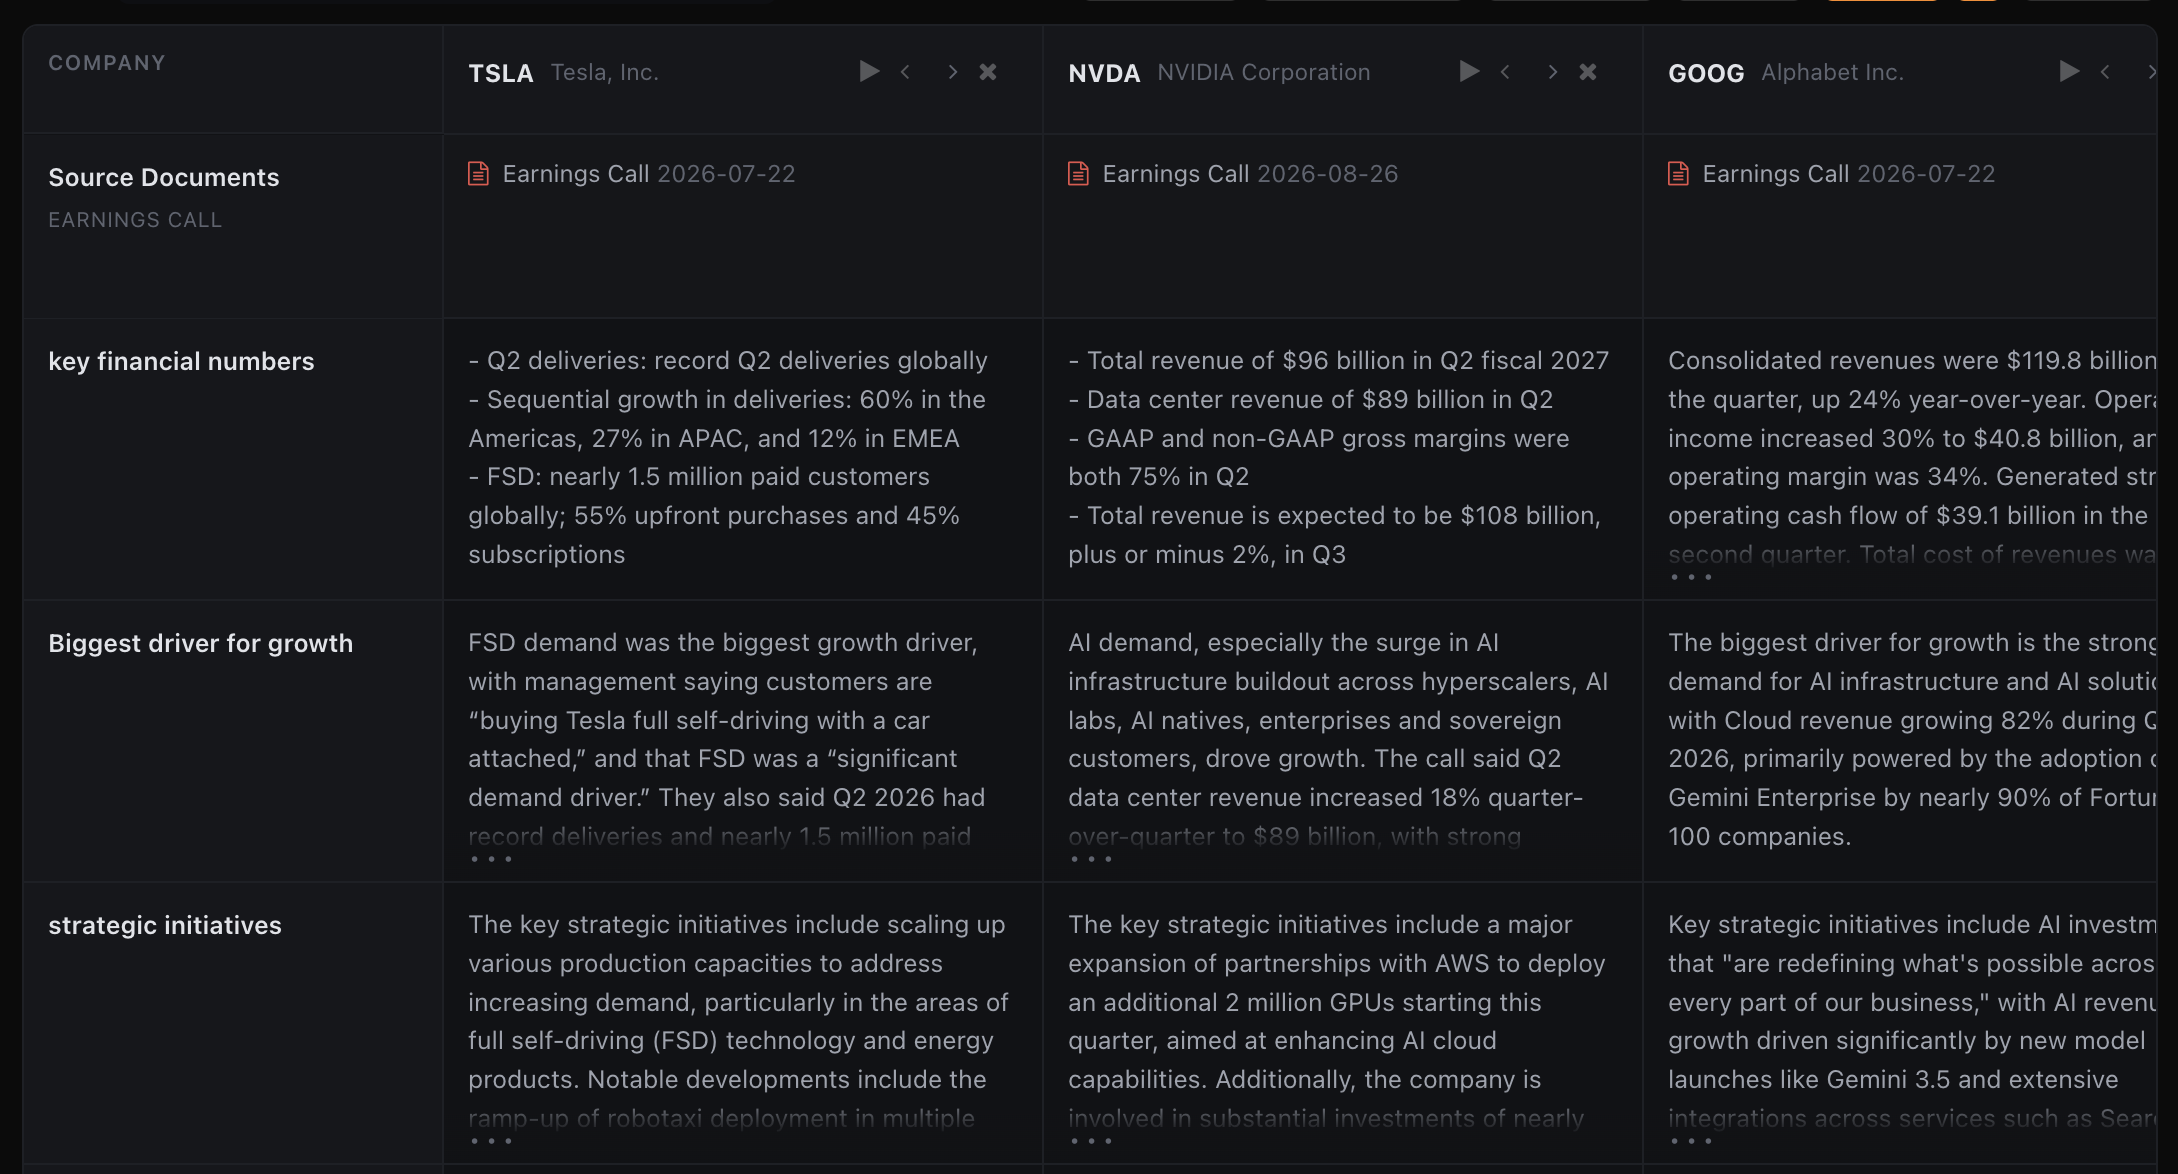
This is one of the most significant updates we have introduced to KlickAnalytics.
Matrix transforms complex, multi-company research into a structured, source-grounded comparison workspace.
Place companies across the columns. Add research questions down the rows. Matrix then analyzes each company using its own filings, earnings calls, financial data, and selected source documents—producing consistent answers that can be compared side by side.
Instead of opening documents individually, repeating the same questions, and manually assembling findings, you can now build an entire research framework once and run it across every company.
With Matrix, you can:
-
Compare multiple companies side by side
-
Add your own research questions and analysis criteria
-
Analyze earnings calls, filings, and selected documents
-
Incorporate financial and market data
-
Run individual cells, selected sections, or the complete Matrix
-
Compare key financial numbers, growth drivers, strategic initiatives, risks, guidance, management commentary, and more
-
Apply the same question consistently across every company
-
Expand the Matrix by adding companies, documents, analysis, and data
-
Chat with the completed research to investigate findings further
-
Save work as a draft or publish and share it with others
-
Reopen and update a Matrix as new information becomes available
Each row becomes a like-for-like comparison. Each column becomes a structured company research profile. Each cell connects a precise question with evidence from the relevant company’s own materials.
Matrix can support powerful workflows such as:
-
Earnings-call reviews
-
Peer and competitor analysis
-
Investment screening and due diligence
-
Portfolio-company monitoring
-
Industry landscape research
-
Management and guidance comparisons
-
Risk-factor analysis
-
Strategic initiative tracking
-
Financial KPI benchmarking
-
Investment committee preparation
Inspired by the emerging generation of AI research systems such as Hebbia Matrix, the KlickAnalytics Matrix is built specifically around financial-market intelligence—connecting company documents, structured data, analysis tools, and collaborative research in one environment.
This is more than another research feature. It is a new operating layer for financial analysis.
Companies across the top. Questions down the side. Evidence inside every answer.
One Matrix. An entire research process.
To access: From the menu, click AI > Matrix
Terminal > Follow Live News From Your Terminal
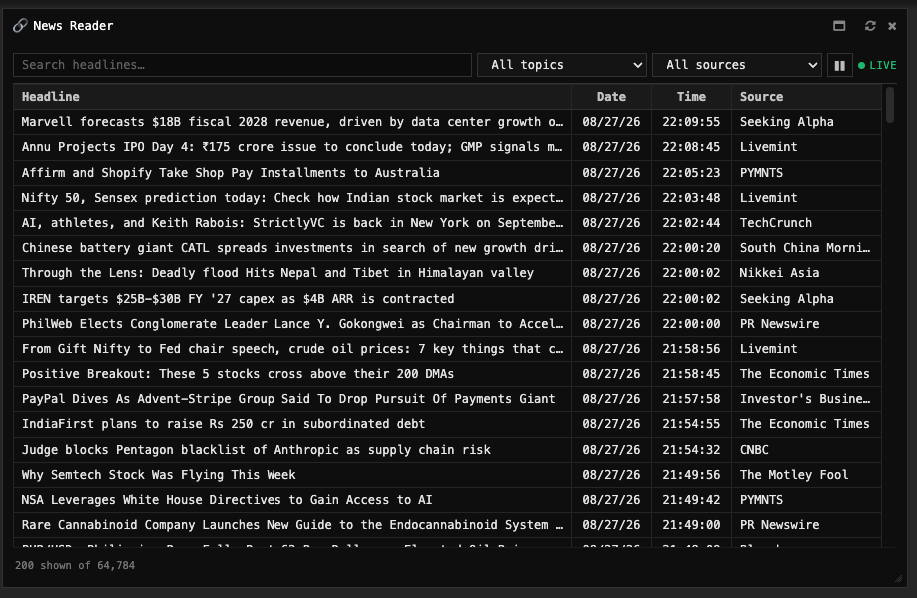
KlickAnalytics has added a new News Reader widget, bringing continuously updated financial, business, technology, and global headlines directly into your Terminal workspace.
With the News Reader widget, you can:
-
Monitor live headlines as they are published
-
Search thousands of stories by company, market, event, or keyword
-
Filter coverage by topic
-
Select individual news sources
-
See the publication date, exact time, and source for every headline
-
Pause and resume the live news feed
-
Review hundreds of sources in one consolidated view
-
Keep news beside charts, portfolios, watchlists, screeners, calendars, and analytics
-
Investigate possible catalysts without interrupting your workflow
From company announcements and earnings developments to macroeconomic events, technology trends, and global market news, the News Reader helps you discover what is happening while you continue analyzing the market.
Live headlines. Multiple sources. One connected Terminal.
Terminal > Keep Your Quick Notes Inside the Terminal
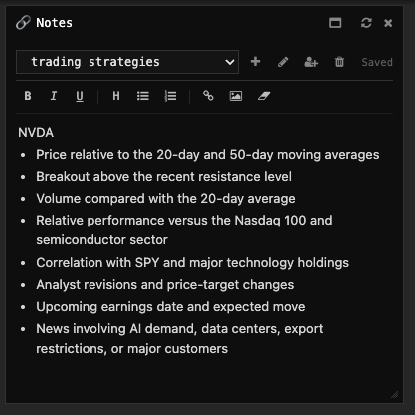
KlickAnalytics has added a new Notes widget, allowing you to capture ideas, observations, and trading plans directly alongside your market data and analysis.
With the Notes widget, you can:
-
Create multiple notes for different strategies, symbols, portfolios, or research topics
-
Quickly switch between saved notes
-
Write and format detailed market observations
-
Add headings, lists, links, and images
-
Rename, organize, share, or delete notes
-
Record trade setups, catalysts, risks, and follow-up questions
-
Keep notes beside charts, screeners, portfolios, calendars, news, and other Terminal widgets
-
Save your work for continued research later
No more moving between your market terminal and a separate note-taking application. Your thinking can now remain connected to the data that inspired it.
See the market. Capture the idea. Keep your research connected.
Terminal > Monitor Global Currency Pairs From Your Terminal
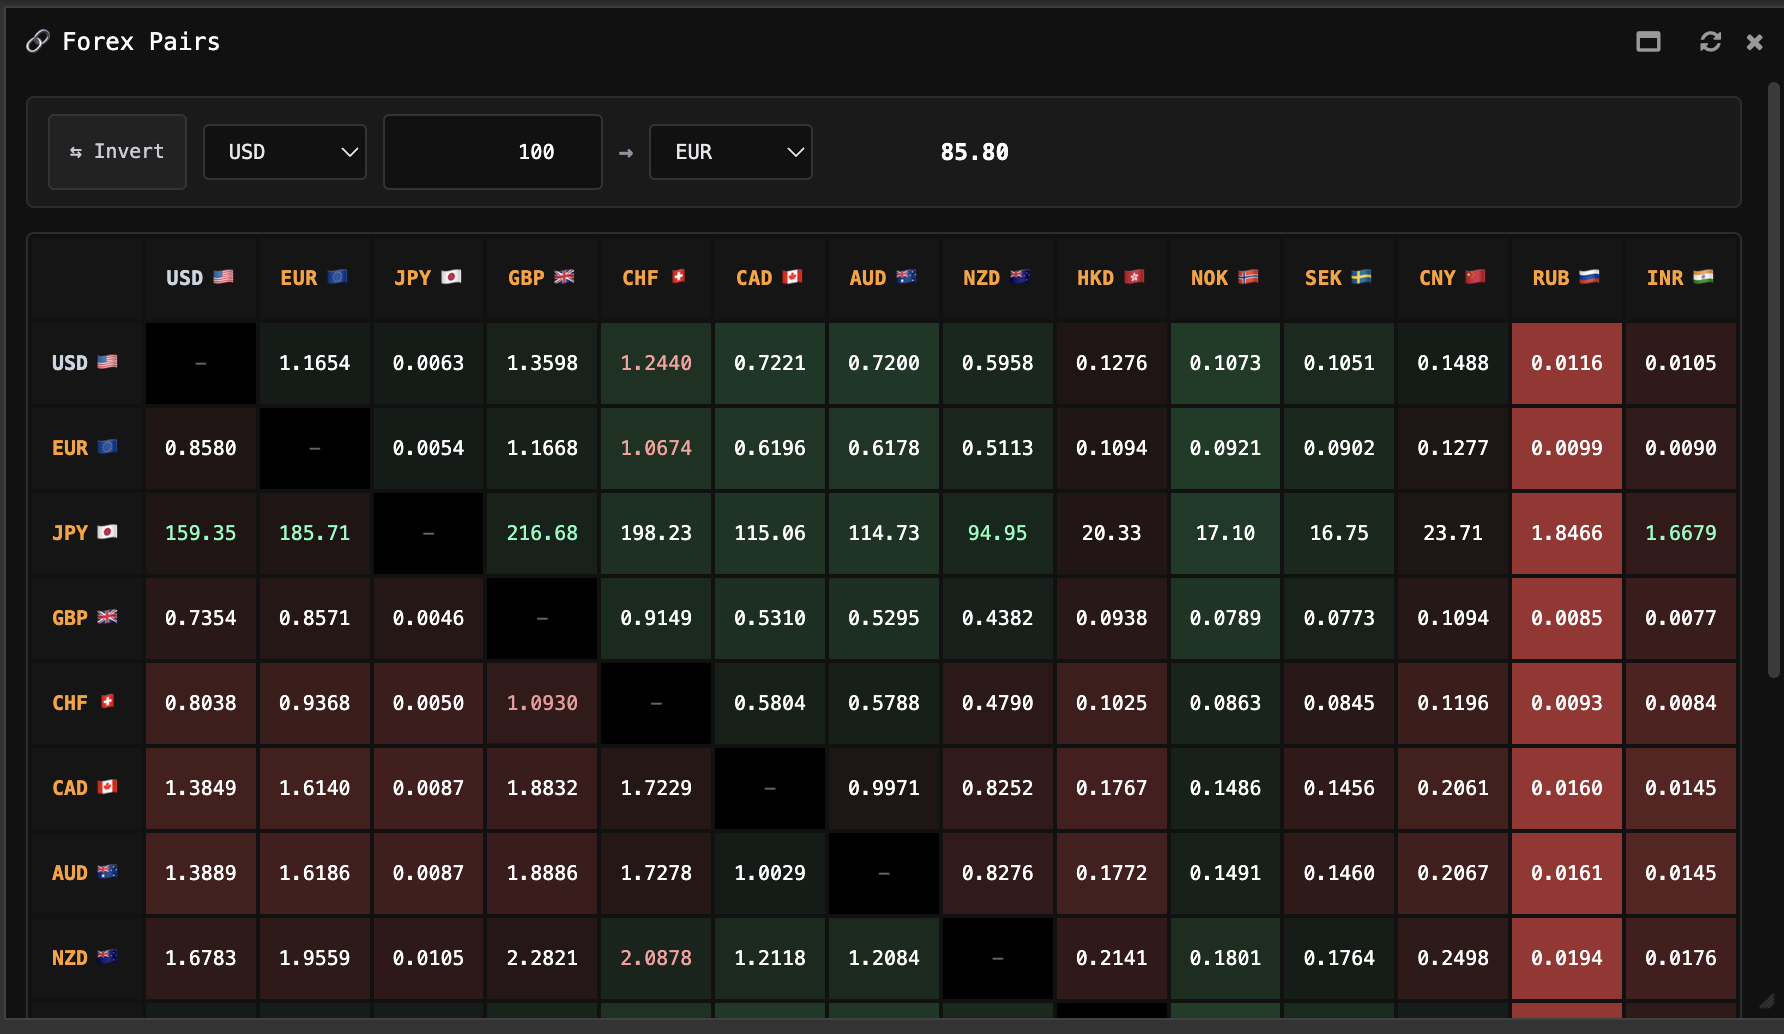
KlickAnalytics has added a new Forex Pairs widget, giving you a fast, visual way to monitor exchange rates and convert currencies directly inside your Terminal workspace.
With the Forex Pairs widget, you can:
-
Convert any amount between selected currencies
-
Instantly invert the conversion direction
-
Compare major and international currencies in one view
-
Scan a color-coded cross-rate matrix
-
View both directions of every currency relationship
-
Monitor currencies including USD, EUR, JPY, GBP, CHF, CAD, AUD, NZD, CNY, INR, and more
-
Keep foreign-exchange rates beside global markets, charts, news, portfolios, and economic events
-
Refresh the widget as market rates change
Whether you are monitoring global markets, evaluating international investments, or checking currency exposure, the Forex Pairs widget keeps essential exchange-rate information within immediate reach.
Global currencies. Instant conversion. One connected Terminal.
Terminal > Compare Market Correlations Inside Your Terminal
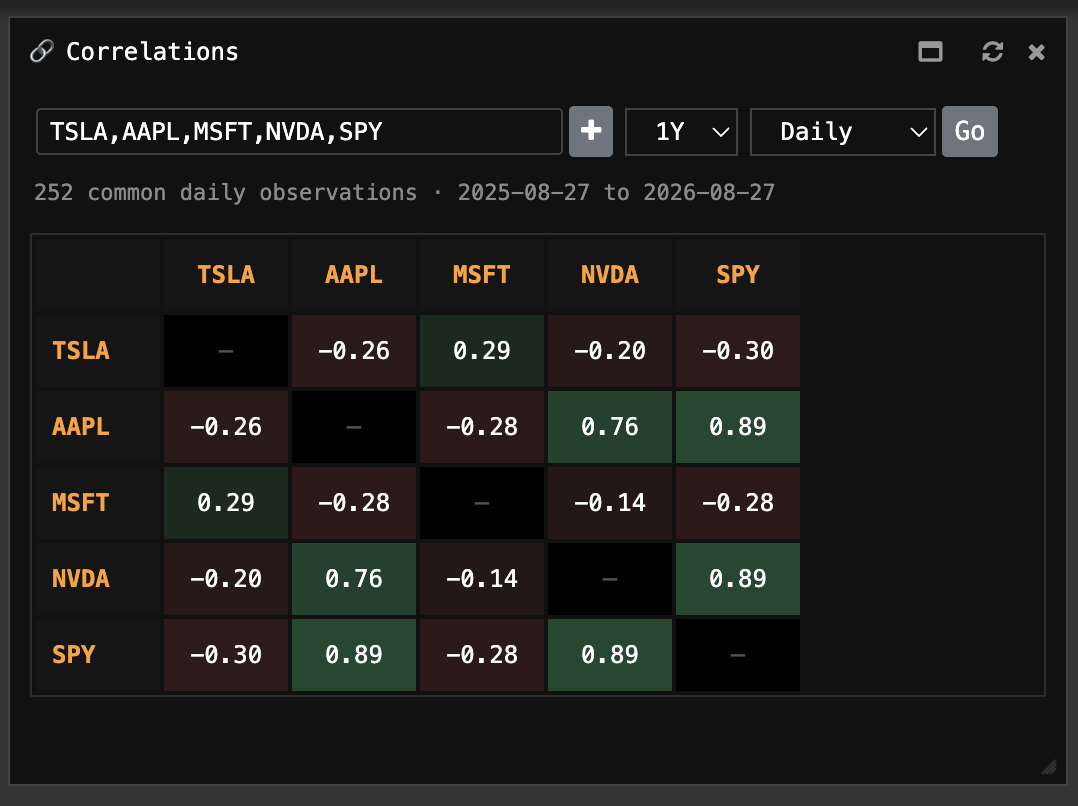
KlickAnalytics has added a new Correlations widget, making it easier to understand how stocks, ETFs, indices, and other instruments have moved in relation to one another.
With the Correlations widget, you can:
-
Enter and compare multiple symbols
-
Add or remove instruments as your analysis changes
-
Select different historical periods
-
Choose the observation frequency
-
View the number of common observations and exact analysis dates
-
Identify strong positive and negative relationships through a color-coded correlation matrix
-
Compare individual holdings with a market benchmark
-
Evaluate portfolio concentration and diversification
-
Identify instruments that may behave similarly during changing market conditions
Place the Correlations widget alongside portfolios, watchlists, charts, news, and research tools to understand not only how each instrument is performing—but how they may move together.
Compare relationships. Reveal concentration. Build with greater awareness.
Terminal > Screen the Market Directly From Your Terminal
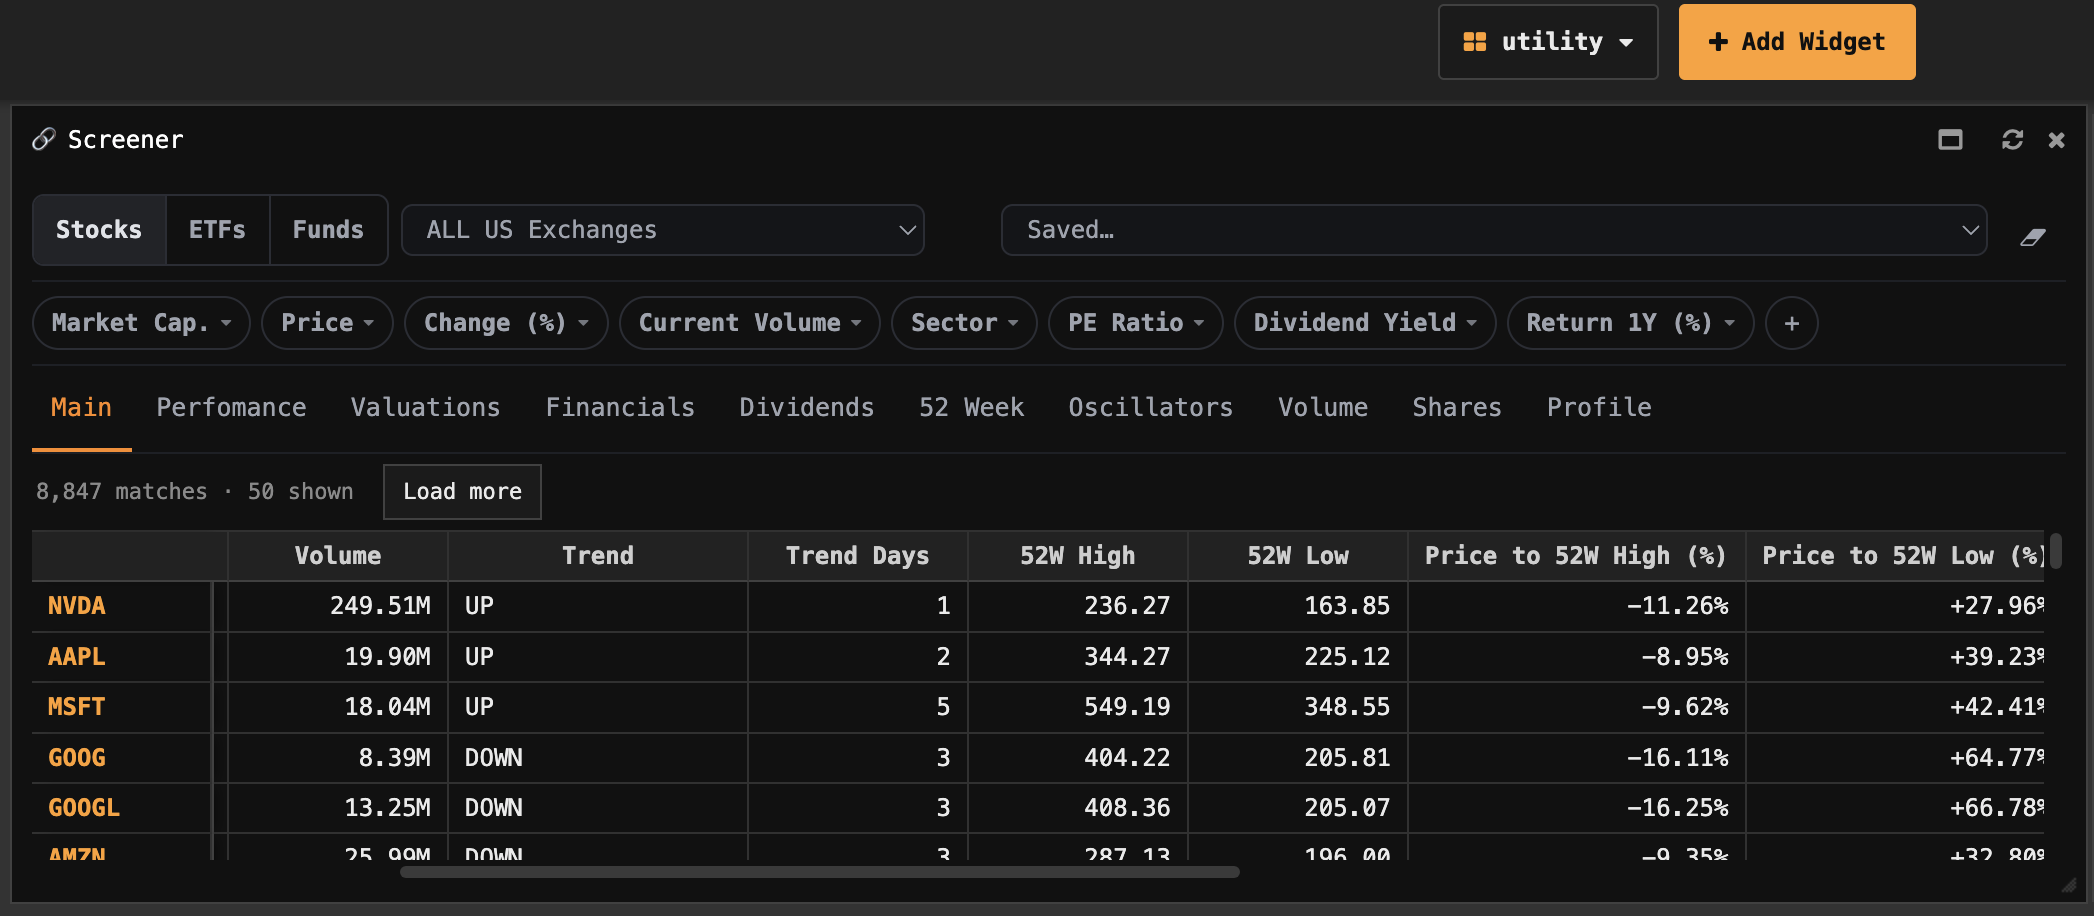
KlickAnalytics has added a powerful new Screener widget, allowing you to discover and compare investment opportunities without leaving your customized Terminal workspace.
With the Screener widget, you can:
-
Screen stocks, ETFs, and funds
-
Select specific exchanges and market universes
-
Filter by market cap, price, performance, volume, sector, valuation, dividend yield, and more
-
Add multiple criteria to create highly targeted screens
-
Explore results across performance, valuation, financials, dividends, 52-week statistics, oscillators, volume, shares, and company profiles
-
Save screens for faster access and repeated analysis
-
Review market trends, trading activity, and distance from 52-week highs and lows
-
Load additional matches directly inside the widget
-
Combine screening results with charts, news, portfolios, watchlists, calendars, and research tools
Whether you are searching for momentum leaders, undervalued companies, dividend opportunities, unusual volume, or stocks approaching important price levels, the Screener widget keeps discovery connected to the rest of your workflow.
Define the criteria. Find the opportunities. Research them in one workspace.
Ask the market a question. Get a calculated answer.
The AI is not a chatbot bolted onto a document store. It calls the same analytics engine that powers every screen on this platform — so what comes back is a number it computed from raw history, with the command that produced it.
86,000+ instruments
Global equities, ETFs, funds, options, FX, commodities, crypto, economics, filings, transcripts and news — one normalised symbol universe with adjusted history.
A real analytics engine
Screening, backtesting, technicals, options analytics, correlations, seasonality and factor models — computed on demand from raw prices, never a stale cache.
It shows its working
Answers arrive with the charts, tables and tool calls behind them, so you can check the number instead of trusting a paraphrase.
Your own documents
Upload filings, decks and research. Ask across them and the answer cites the page it came from.
Agents and workflows
Multi-step research that runs the platform's tools for you — screen, pull the history, compute, compare, then write it up.
MCP, CLI and API
The same command catalogue from Claude, your own agent, a shell or your pipeline. The answer on screen is the answer your job gets at 4am.
You ask
“How does NVDA usually trade through earnings?”
It calls
→ ka.options_expected_move(NVDA)
It answers
NVDA has averaged a 9.2% absolute move on the day after earnings and closed higher 67% of the time. Two in three reactions land between −4.2% and +16.3% — the distribution is skewed right, not symmetric.
Every figure computed live from our own history — not scraped, not summarised.
Or start with