What's New
Product updates, improvements and fixes across the KlickAnalytics platform.
142 updates · clear
Quick Chart Access
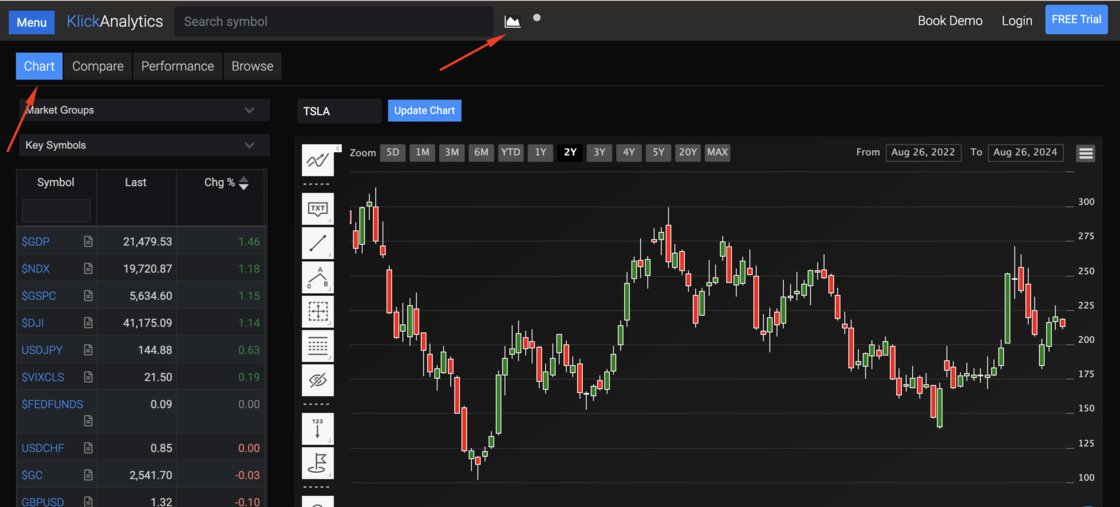
We are thrilled to introduce a powerful new feature designed to enhance your trading experience! You can now instantly access our comprehensive charting tool with just a single click of the chart icon located on the top menu. This streamlined access allows you to quickly dive into market movers, explore key instruments, or even browse through your personalized watchlist—all in one place! Whether you're analyzing trends or tracking your favorite assets, this new feature puts the tools you need right at your fingertips, making your market analysis faster and more efficient than ever before!
Explore companies financial key metrics and trends!
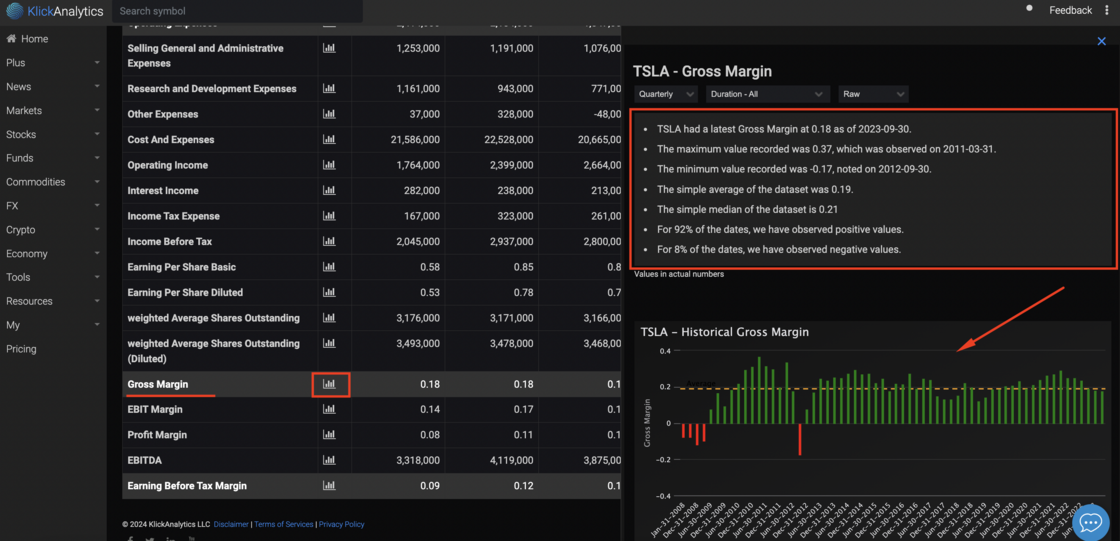
In response to user feedback and evolving industry standards, we're excited to introduce new features and enhancements to our financial statement analysis application. These updates are designed to provide users with more comprehensive insights, improved usability, and enhanced visualization capabilities.
1. Expanded Line Item Analysis:
Users can now view a wide range of financial statement line items such as gross margins, operating expenses, net income, and more. This expanded coverage allows for a deeper understanding of key financial metrics crucial for decision-making.
2. Historical Trends:
Our application now offers historical trend analysis, enabling users to track the performance of selected line items over time. From quarterly to annual views, users can identify trends, spot anomalies, and make informed projections based on past performance.
3. Flexible Observation Filters:
To cater to diverse analytical needs, users can filter observations based on customizable timeframes ranging from the last 3 months to the last 12 months or view all available data. This flexibility allows for focused analysis and quick comparisons across different periods.
4. Key Statistics:
We've introduced a new feature that provides users with key statistics for selected line items. From mean and median values to standard deviations and percentiles, users can gain deeper insights into the distribution and variability of financial data.
5. Enhanced Visualization:
A new historical bar chart visualization has been added to the application, allowing users to visualize positive and negative values over time. This dynamic visualization helps users identify trends, patterns, and outliers at a glance, enhancing the interpretability of financial data.
Conclusion:
With these updates, our financial statement analysis application empowers users to conduct comprehensive analyses, uncover valuable insights, and make well-informed decisions. We remain committed to continuously improving our platform to meet the evolving needs of our users and provide them with the tools they need to succeed in financial analysis.
To access: Search for a company say TSLA, then from the symbol menu, select Financials > Fundamentals > and then click on any of the chart icon against any line item like Gross Margin to view the analysis.
Post Earning Drift
We are very excited to showcase our new app called 'Post Earning Drift'. The app allows a users to;
- View Post Earning Price Analysis
- Showcase a visual chart on all historical earning price drifts
- The current price drift
- All the main statistics per each earning dates like Min/Max, Averages, Standard Deviations and much more.
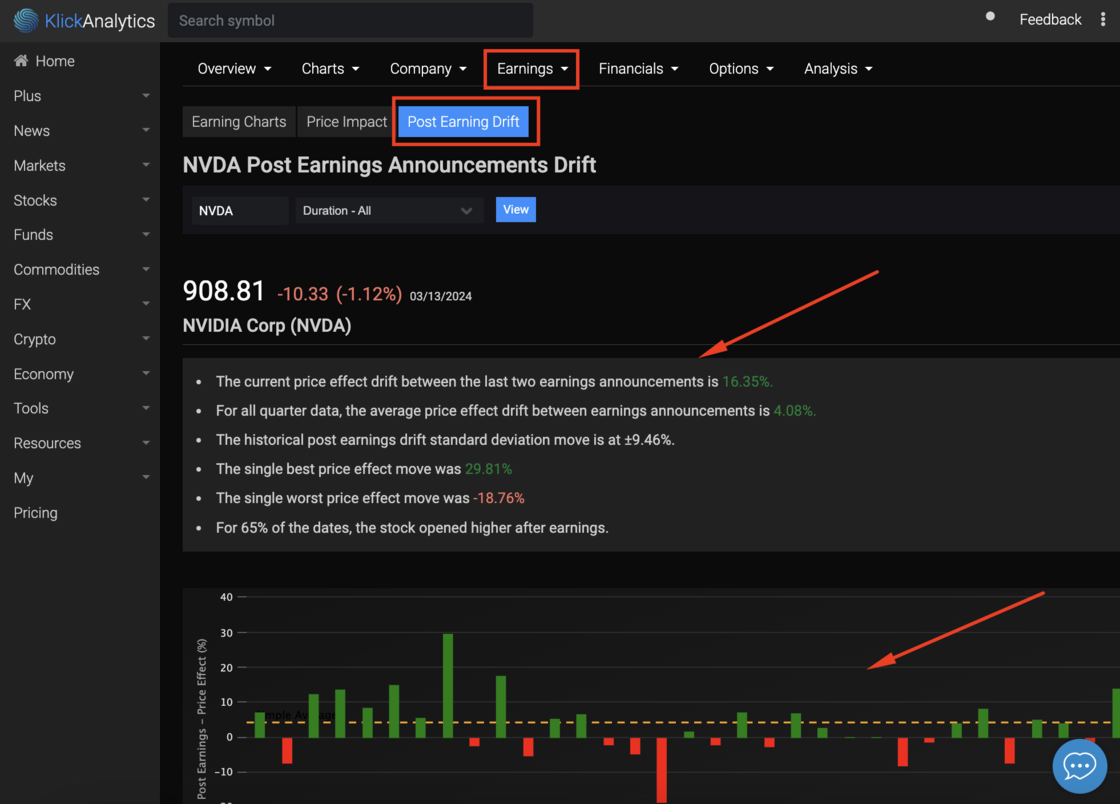
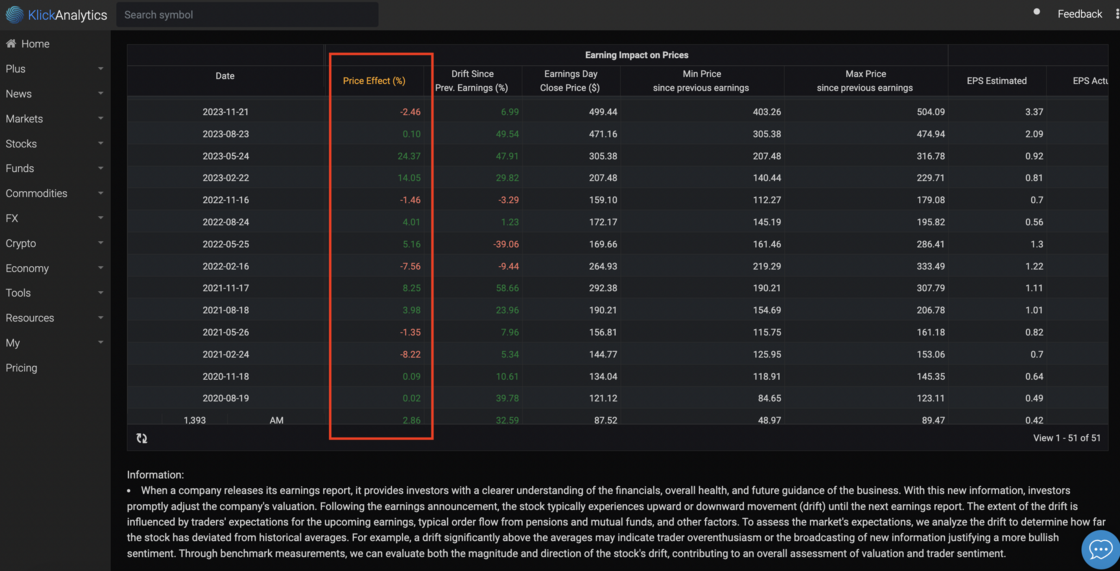
When a company reports earnings it gives investors more clarity into the financials, overall health, and forward guidance of the business. Given the new information, investors can quickly reprice the company's value. After earnings, the shares typically move up or down (drift) until the next earnings announcement. The magnitude of the drift will be based on traders' expectations of the next earnings, typical order flow from pensions and mutual funds, etc. In order to gauge the market's expectations, we measure the drift to determine how far away the stock has moved from historical averages. For instance, if the drift is way above the averages, it can indicate trader over enthusiasm or that new information has been telecast to warrant a more bullish sentiment. By measuring benchmarks, we can assess the magnitude and direction of the stock's drift as part of the overall valuation and trader sentiment.
To access: Search for any company say NVDA, and then from the top symbol menu, select Earnings > Price Impact > Post Earning Drift
Earning Historical Charts
We've added a new app 'Earning Historical Charts' which allows a user to quickly view a company historical earning performances in a visual chart style. The app allows to view historical earnings based on;
- Earnings - Opening Gaps
- Earnings - Actual Moves on earning date
- Earnings - Returns (%) on earning date
- Earnings - Open to Close (%) on earning date
- Earnings - High to Open (%) on earning date
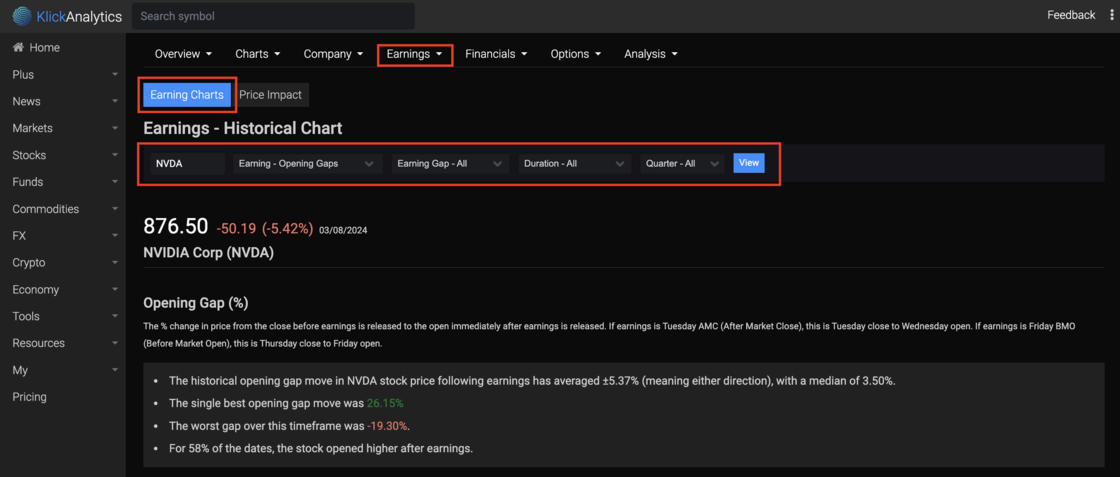
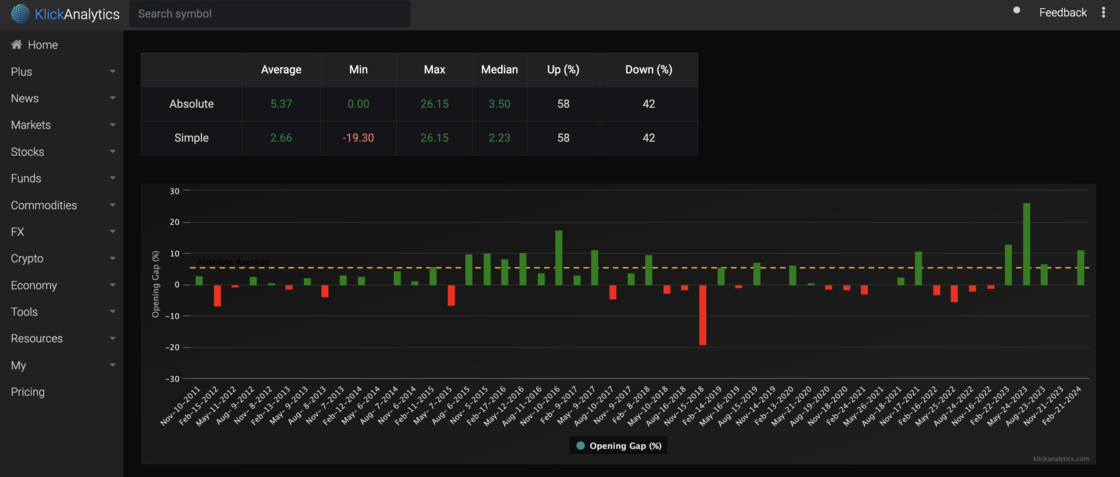
The above app will help the user to find trade oppourtunities within earning season for a company and much more.
To access: Search for a company say NVDA, and then from the top menu, select Earnings > Earning Charts
View all price targets by an analyst!
Our users now have the ability view all price targets by an analyst.
- View all price target ratings by an analyst
- View all companies covered by an analyst
- View the upside potential by a company and more.
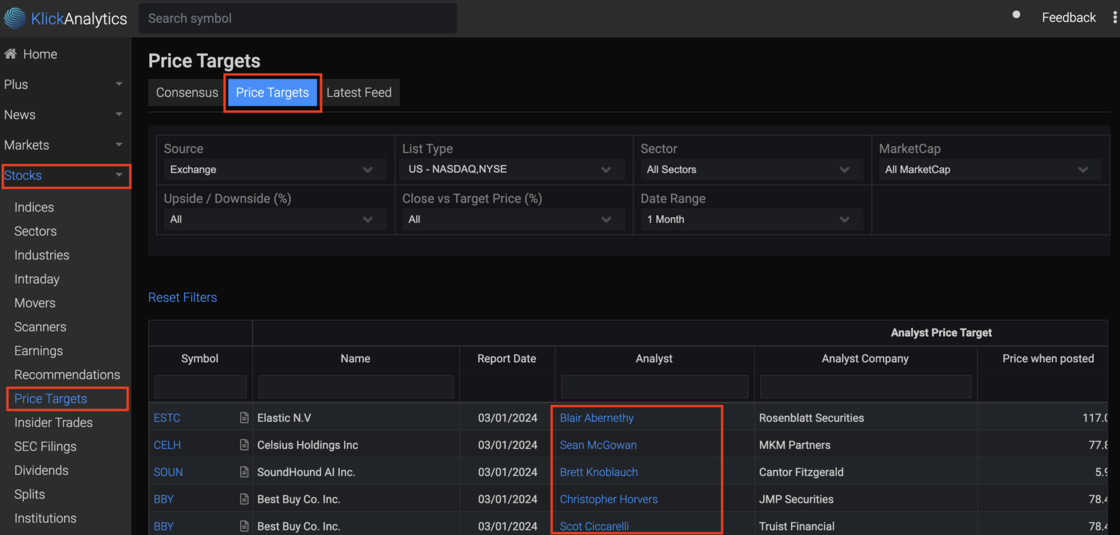
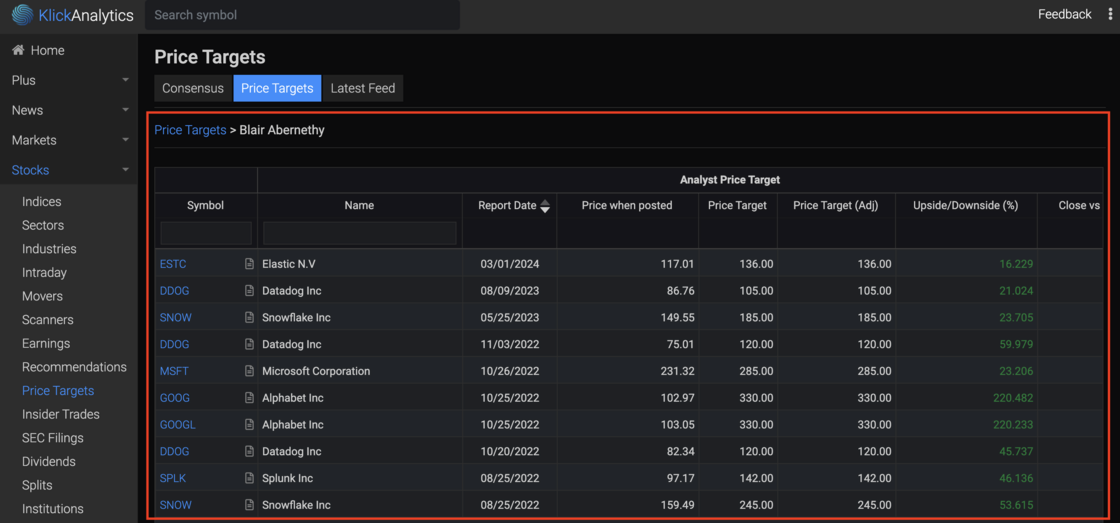
To view: From the left menu > Stocks > Price Targets > and then click on any of your analyst name.
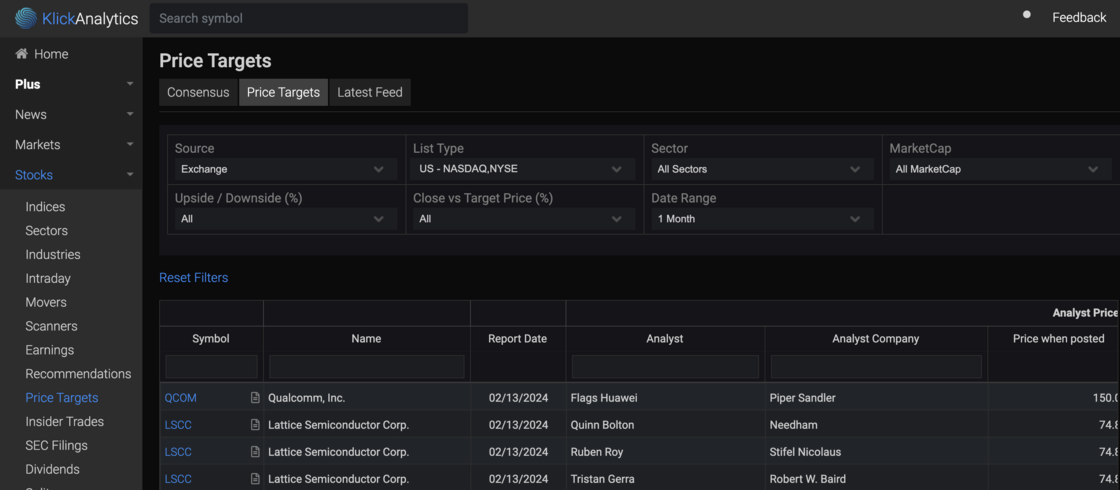
Unlock the power of Price Targets
📈 Unlock the Power of Price Targets! 🚀
In this video, we dive into the fascinating world of company price targets, providing you with a powerful toolkit to navigate the stock market intelligently. Whether you're a seasoned investor or just starting, our exploration covers a range of features to enhance your analysis.
https://www.youtube.com/watch?v=zyCLJ-XncqY&t=1s
🔍 Key Features:
Filter by Exchanges, Index, ETFs: Explore companies based on various criteria, including stock exchanges, indices, and ETFs.
Sectors and Industries: Dive deep into sectors and industries to make informed investment decisions.
Watchlist Management: Learn how to manage your watchlists efficiently, keeping an eye on the companies that matter most to you.
Sorting and Filtering: Easily sort and filter information to streamline your research process.
Analyst Insights: Discover what analysts are saying and filter information based on analyst recommendations and companies.
Percentage Analysis: Quickly identify companies with the current vs target price (%), understanding upside/downside potential.
To access: From the left menu, select Stocks > Price Targets
Historical Spread Calculator
📊 Unveiling Spread Analyzer - Your Ultimate Global Instruments Comparison Tool! 🌐
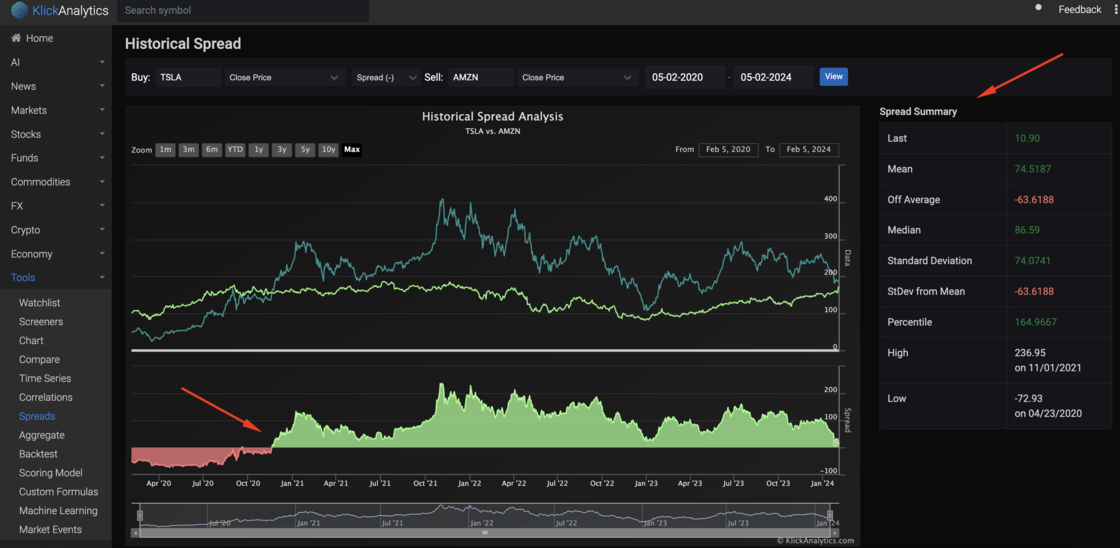
Exciting news for traders and investors! We're thrilled to present Spread Explorer, an advanced app that empowers you to select any two global instruments and conduct a comprehensive historical spread analysis. Here's what this versatile tool offers:
Instrument Flexibility:
Select any two global instruments of your choice for a detailed analysis of their historical spread dynamics.
Spread Calculation Options: Utilize diverse spread calculation methods, including ratio, division, and multiplication, to gain valuable insights into the relationship between the chosen instruments.
Spread Summary:
Uncover detailed spread statistics, featuring the last recorded spread, mean spread, off-average spread, median spread, standard deviation, StDev from Mean, percentile spread, as well as the highest and lowest spreads with their respective dates.
Key Spread Stats:
- Last Spread
- Mean Spread
- Off Average Spread
- Median Spread
- Standard Deviation
- StDev from Mean
- Percentile Spread
- Highest Spread (with date)
- Lowest Spread (with date)
Spread Explorer provides a wealth of information to aid in making informed decisions about global instrument investments. Whether you're a seasoned trader or a novice investor, this tool enhances your analytical capabilities.
Make data-driven investment choices by understanding the historical spread dynamics between any pair of global instruments. Download Spread Explorer now and elevate your analytical capabilities to make more informed investment decisions! 📈🌐
To access: From the left menu, click on Tools > Spreads
View all the main traders stats!
🚀 Introducing Trader Stats - Your Ultimate Trading Companion! 📈
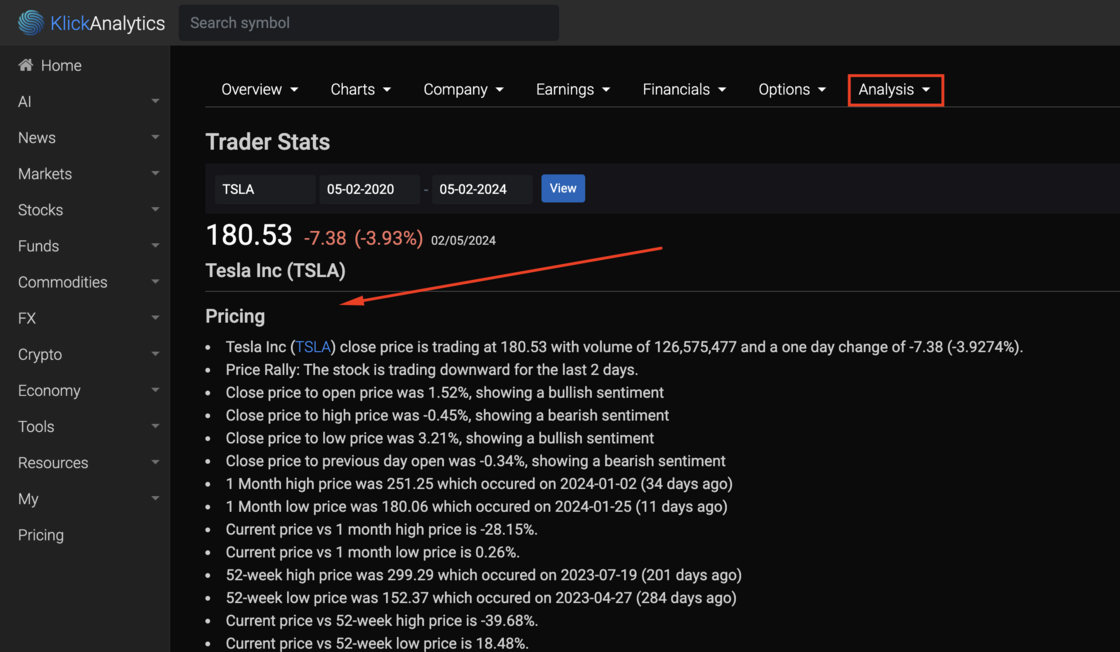
Exciting news! We're thrilled to introduce our latest app, Market Insights, designed to provide investors with a robust set of tools for analyzing market trends across various securities. Here's a glimpse of what our app offers:
Pricing Overview: Explore real-time pricing data for your chosen security, including close price, trading volume, and one-day percentage change. Gain valuable insights into price movements and sentiments with indicators like price rally, close price to open, high, low, and previous day open.
Historical Performance: Track the security's historical journey over different timeframes, including one month and 52 weeks. Evaluate the current price against highs and lows, and delve into historical returns and relative volume for a comprehensive understanding of its performance.
Technical Indicators: Analyze short-term, medium-term, and long-term moving averages to identify potential trends. The app provides SMA signals, close price comparisons, and technical indicators to aid in making well-informed trading decisions.
Volatility and Volume Analysis: Dive into volatility trends over various durations and explore volume statistics. Whether it's the highest or lowest volume in the last 7, 30, 60, 90, 180, or 365 days, Market Insights keeps you informed about market dynamics.
Market Indicators and Analysis: Discover trend insights based on SMA 50/200, RSI, Bollinger Bands, MACD, ADX, CCI, and more. Uncover potential buy or sell signals, trend strength, and volatility metrics applicable to a wide range of securities.
Market Insights is your all-in-one tool for thorough market analysis, providing a wealth of information to enhance your trading decisions across various securities. Download the app now and elevate your investment strategy!
To access: Search for any symbol say TSLA, and then from the symbol menu, select Analysis > [Trader Stats](https://klickanalytics.com/symbol_trader_stats?s=TSLA)
View pre and post market movers
We are so excited to announce that we've added a new app called 'Pre and Post Movers' which display pre and post markets movers.
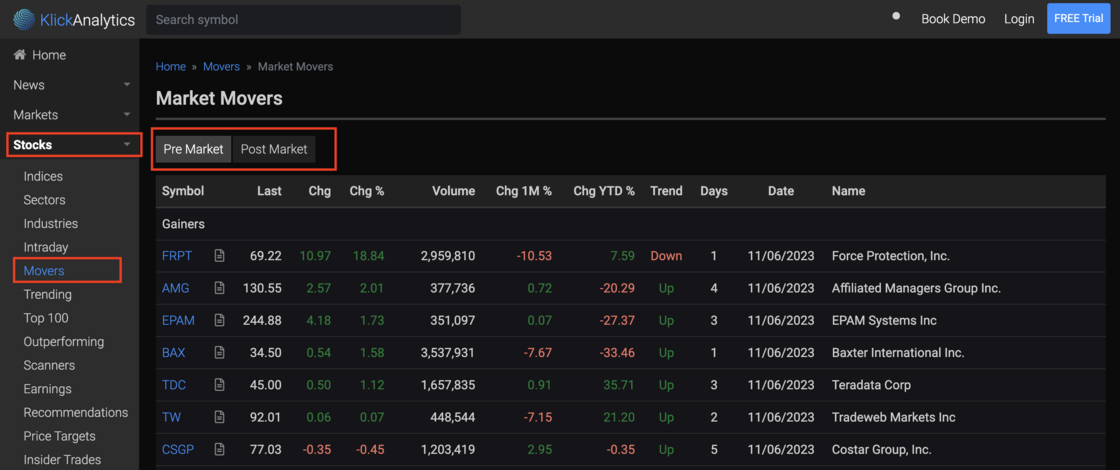
Understanding pre and post-market movers stock information is crucial for investors and traders. Firstly, it provides insight into early market sentiment, helping individuals make informed decisions before the regular trading session begins. This data can alert investors to potential price gaps and trends, minimizing unexpected losses. Secondly, it aids in risk management by allowing traders to adjust their positions or execute orders after hours, ensuring they respond to breaking news or events that may impact stock prices. Finally, pre and post-market data can unveil new opportunities and reveal valuable market intelligence, giving traders a competitive edge and improving their chances of success in the fast-paced world of stock trading.
To access:
From the left menu, click on Movers > Pre Market
More Stock News added
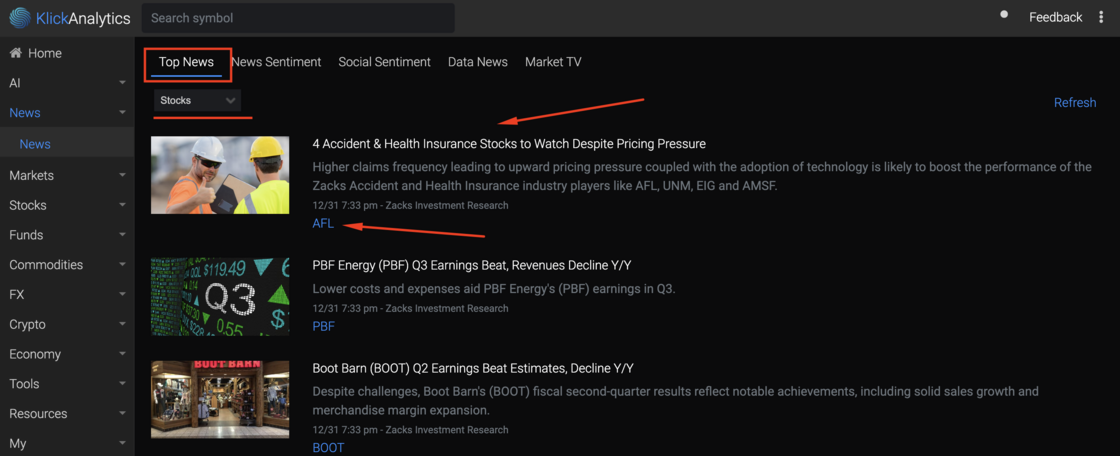
We are delighted to announce a significant enhancement to our news stories section, featuring a comprehensive selection of stock news. This curated selection offers users access to major news updates concerning all stocks traded on the US exchange. Furthermore, users can conveniently access succinct news summaries alongside the corresponding company symbols, providing a streamlined and informative platform for staying up-to-date with stock market developments.
To access:
From the left menu, click on News > Top News > and select drop down "Stocks"
Ask the market a question. Get a calculated answer.
The AI is not a chatbot bolted onto a document store. It calls the same analytics engine that powers every screen on this platform — so what comes back is a number it computed from raw history, with the command that produced it.
86,000+ instruments
Global equities, ETFs, funds, options, FX, commodities, crypto, economics, filings, transcripts and news — one normalised symbol universe with adjusted history.
A real analytics engine
Screening, backtesting, technicals, options analytics, correlations, seasonality and factor models — computed on demand from raw prices, never a stale cache.
It shows its working
Answers arrive with the charts, tables and tool calls behind them, so you can check the number instead of trusting a paraphrase.
Your own documents
Upload filings, decks and research. Ask across them and the answer cites the page it came from.
Agents and workflows
Multi-step research that runs the platform's tools for you — screen, pull the history, compute, compare, then write it up.
MCP, CLI and API
The same command catalogue from Claude, your own agent, a shell or your pipeline. The answer on screen is the answer your job gets at 4am.
You ask
“How does NVDA usually trade through earnings?”
It calls
→ ka.options_expected_move(NVDA)
It answers
NVDA has averaged a 9.2% absolute move on the day after earnings and closed higher 67% of the time. Two in three reactions land between −4.2% and +16.3% — the distribution is skewed right, not symmetric.
Every figure computed live from our own history — not scraped, not summarised.
Or start with