What's New
Product updates, improvements and fixes across the KlickAnalytics platform.
Terminal > Monitor Your Portfolio Directly From the Terminal
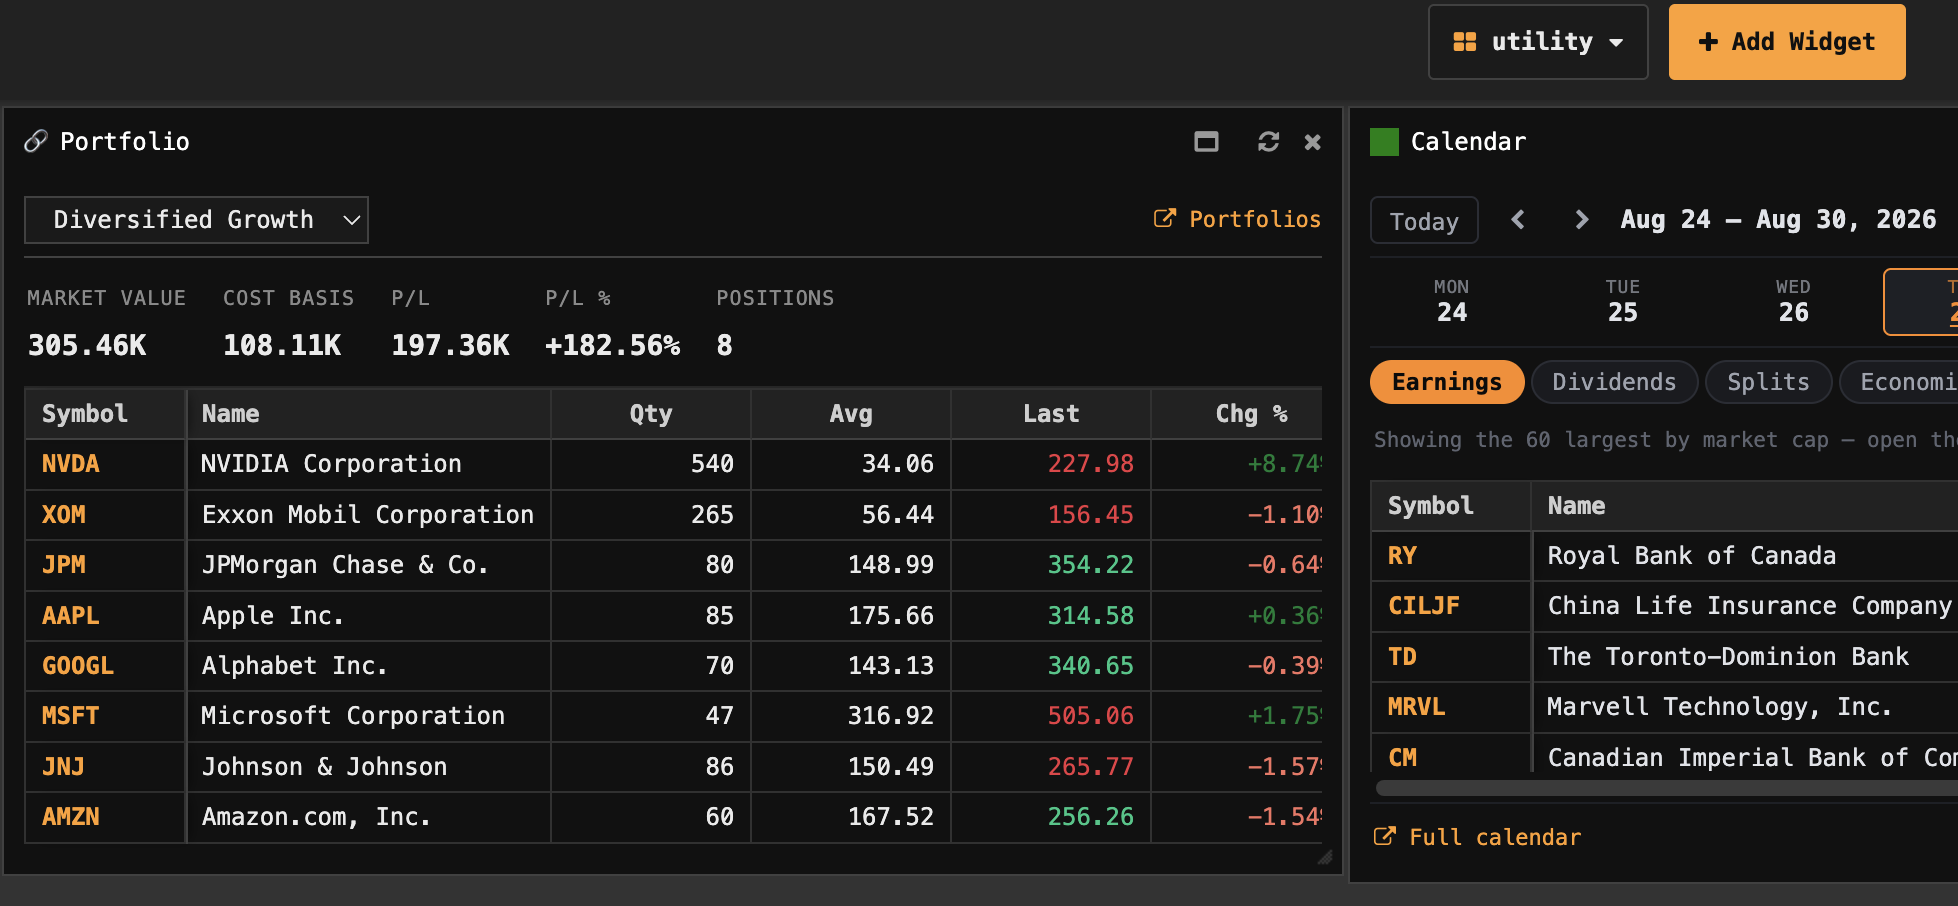
KlickAnalytics has added a new Portfolio widget, giving you an immediate view of your holdings alongside the charts, calendars, news, and market tools in your Terminal workspace.
With the Portfolio widget, you can:
-
Select and switch between your portfolios
-
Monitor total market value and cost basis
-
Track overall profit or loss in dollars and percentages
-
See the number of positions held
-
Review every holding with quantity, average cost, latest price, and daily percentage change
-
Identify portfolio leaders and laggards at a glance
-
Open the full Portfolio application for deeper analysis
-
Combine portfolio monitoring with calendars, charts, news, watchlists, and other widgets
Build a Terminal around the investments you actually own and keep portfolio performance visible while you monitor the broader market.
Your holdings. Your market tools. One connected workspace.
Terminal > Build and Manage Your Terminal More Easily
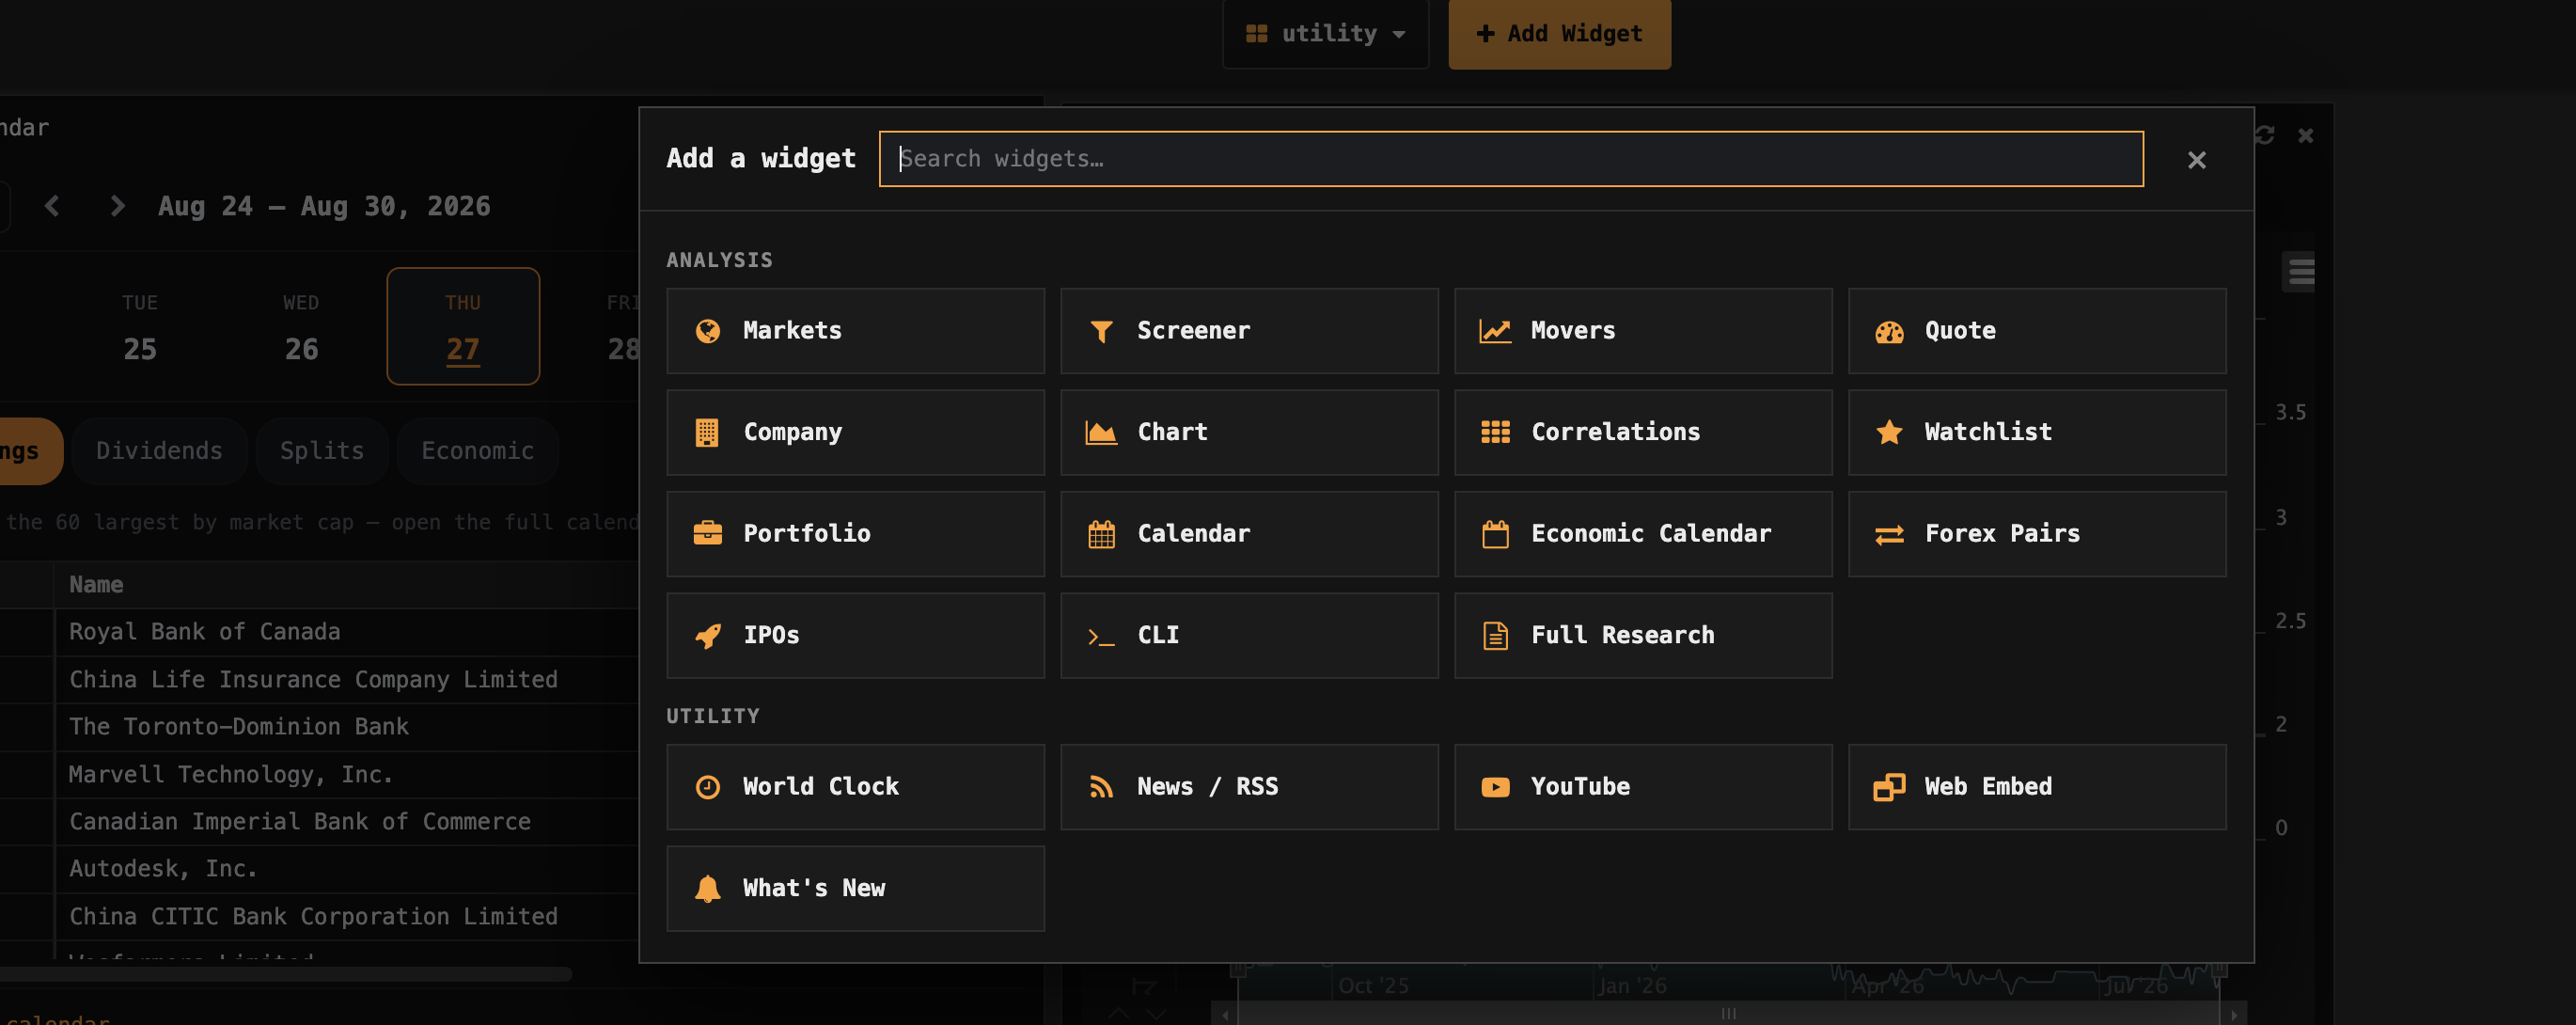
KlickAnalytics has introduced a faster, simpler way to manage Terminal workspaces and add the widgets you need.
The new widget manager lets you:
-
Search for widgets instantly
-
Browse widgets by category
-
Add market analysis, research, and utility tools with one click
-
Build specialized workspaces for trading, research, portfolio monitoring, or market surveillance
-
Quickly add charts, quotes, screeners, movers, correlations, watchlists, portfolios, calendars, news, CLI access, and more
-
Include utility widgets such as world clocks, YouTube, RSS feeds, and embedded web content
-
Organize each Terminal workspace around a specific workflow or objective
-
Update your workspace as your research needs change
Whether you need a focused symbol-analysis screen, a global-market dashboard, or a complete trading workspace, you can now assemble it quickly from one organized widget library.
Choose your widgets. Design your workflow. Make the Terminal yours.
Market Calendar on Your Terminal
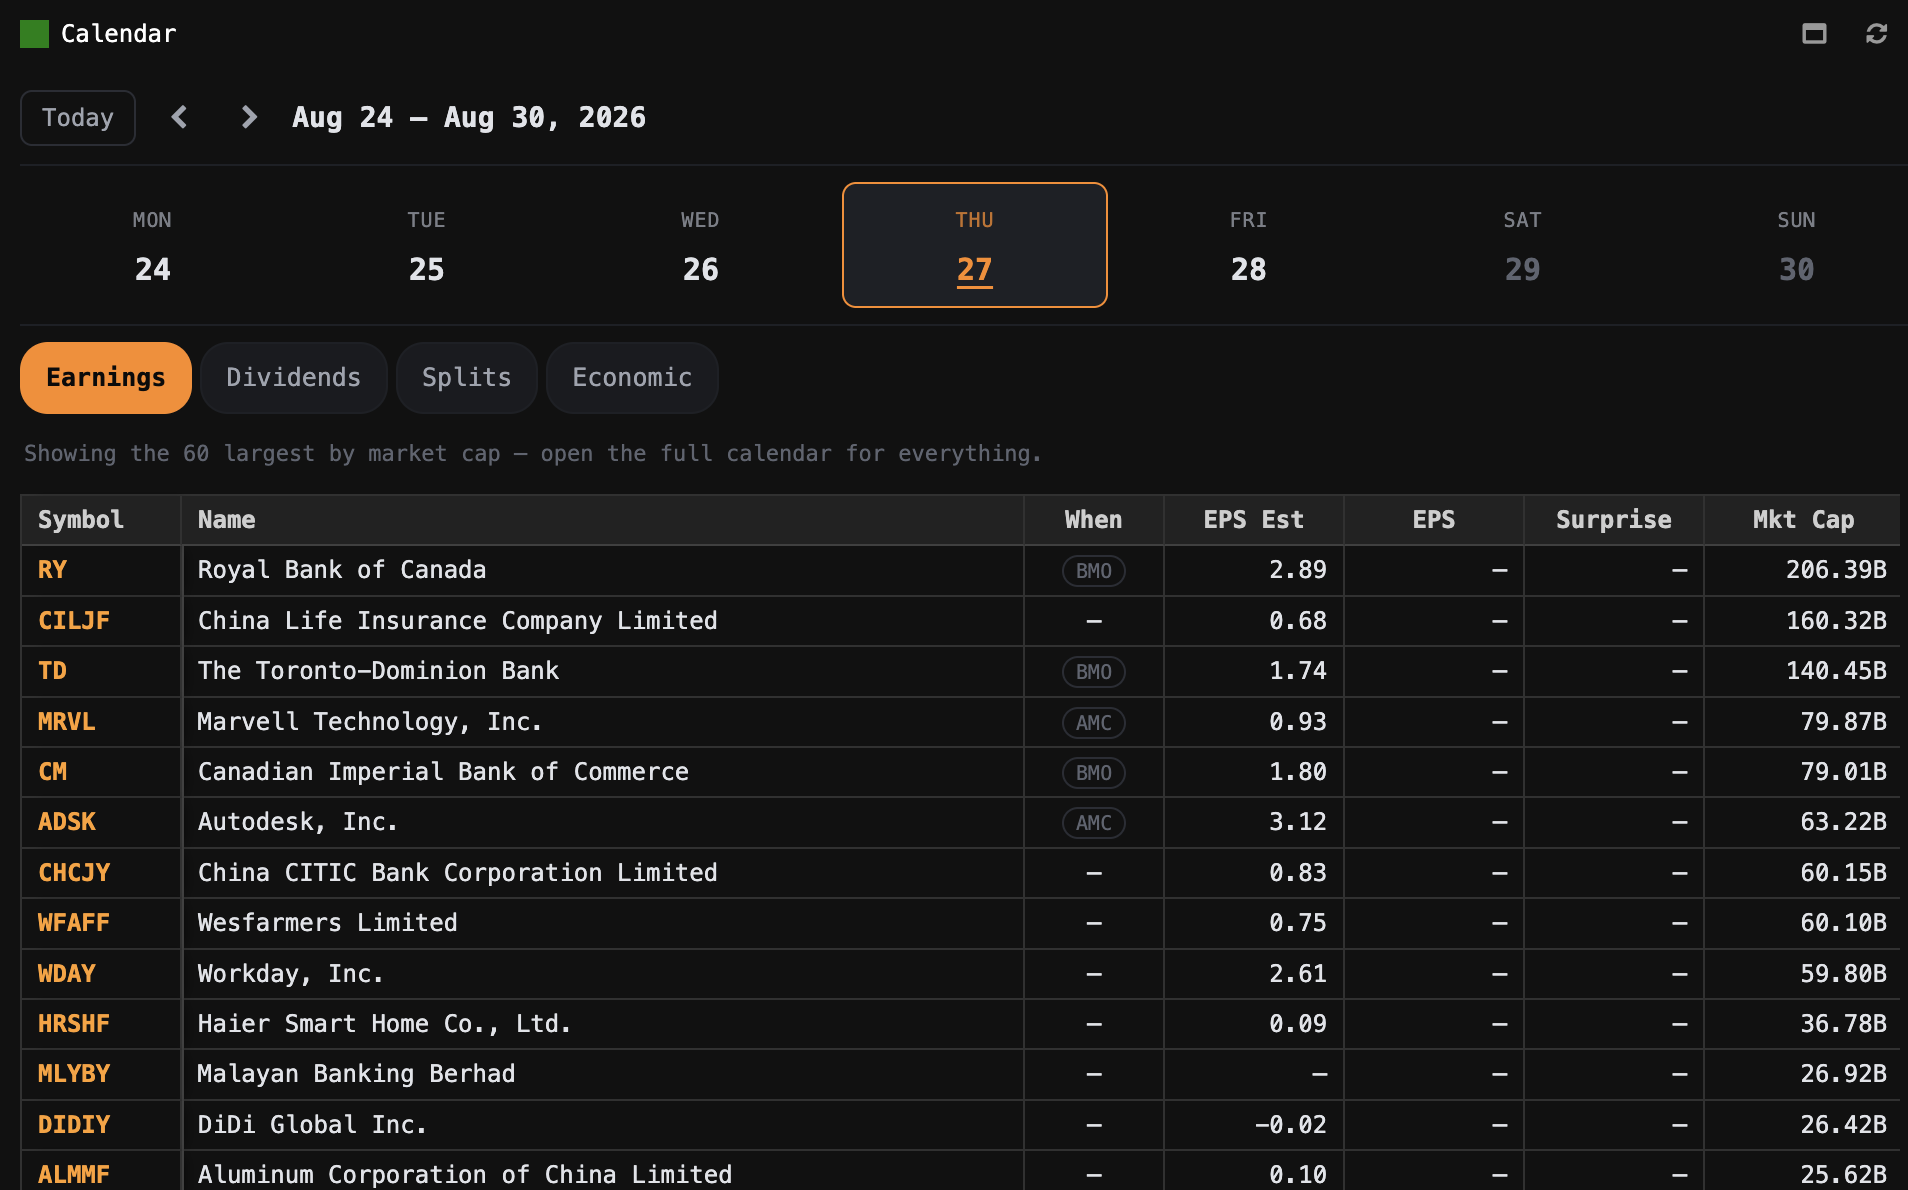
KlickAnalytics has added a new Calendar widget to the Terminal, giving you a quick view of important market events without leaving your workspace.
With the Calendar widget, you can:
-
Navigate across days and weeks
-
Monitor upcoming earnings announcements
-
View estimated and reported EPS
-
Identify earnings surprises
-
See whether earnings are expected before or after market hours
-
Track upcoming dividends and stock splits
-
Follow major economic events
-
Quickly focus on the largest companies by market capitalization
-
Open the complete calendar when you need a broader view
Keep important market dates beside your charts, watchlists, news, and analytics—so you can understand what is coming and prepare before the market reacts.
Your market. Your schedule. Always visible on the Terminal.
Advanced Seasonality—Go Beyond Simple Historical Averages
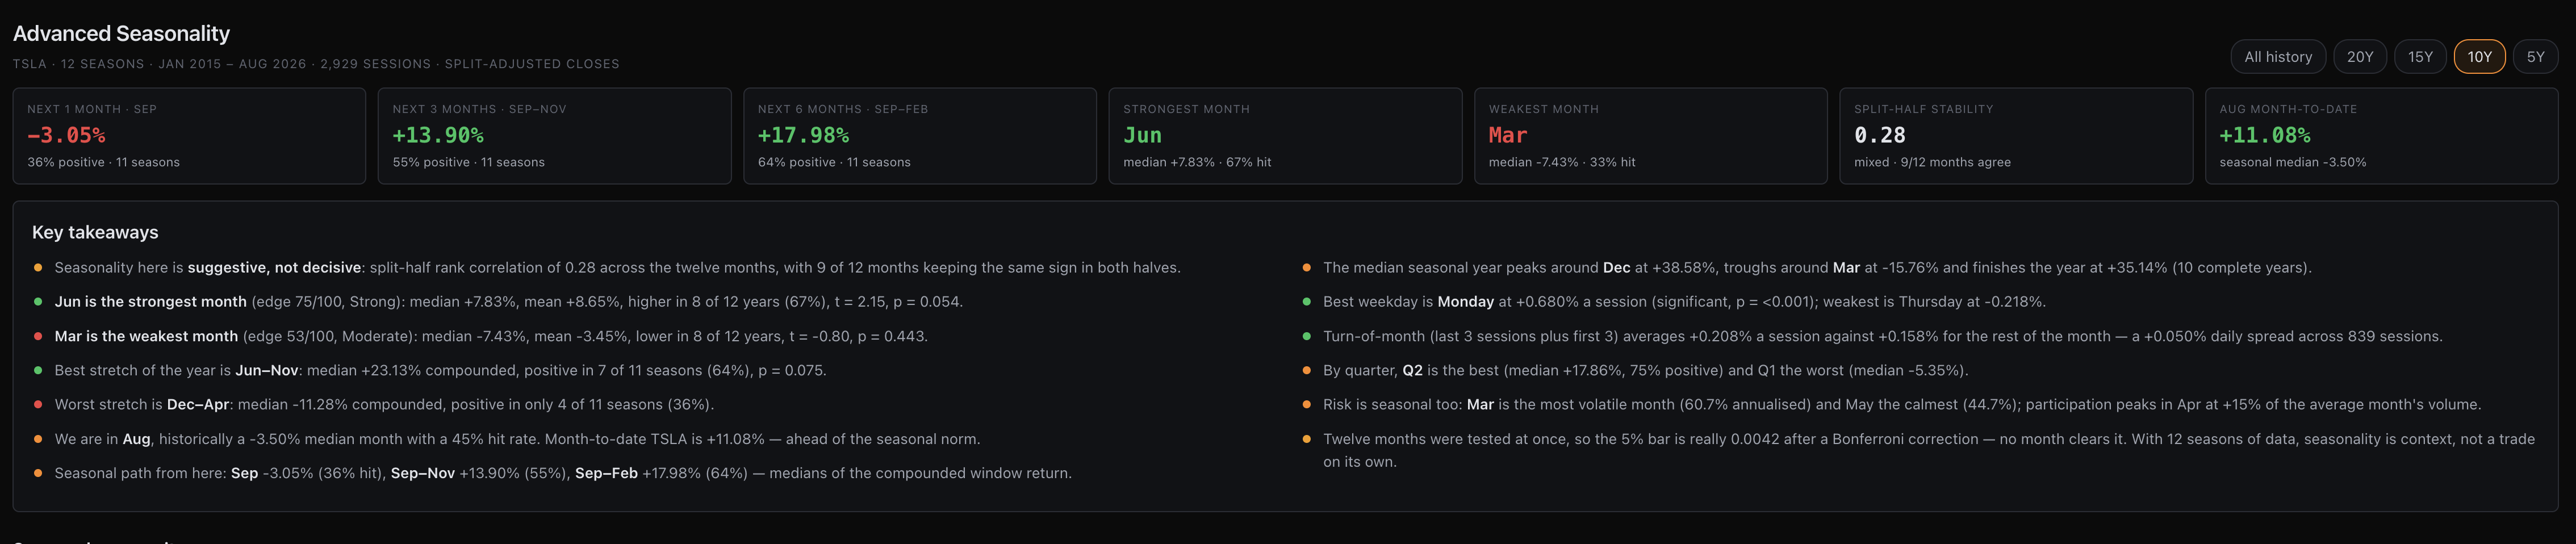
KlickAnalytics has significantly expanded its seasonality analysis, giving users a deeper and more statistically grounded view of how any symbol has historically performed across months, quarters, weekdays, and multi-month periods.
With Advanced Seasonality, you can now:
-
View expected performance for the next one, three, and six months
-
Identify the historically strongest and weakest months
-
Compare median and average returns, positive-year hit rates, and best and worst outcomes
-
Measure whether seasonal patterns remained stable between the first and second halves of history
-
Review statistical significance, volatility, risk-adjusted returns, and seasonal-edge scores
-
Discover the strongest and weakest contiguous seasonal windows
-
Compare quarterly and weekday performance
-
Analyze turn-of-the-month behavior
-
See which months historically experienced the greatest volatility and trading activity
-
Compare the current month’s performance with its historical seasonal pattern
-
Switch between five, 10, 15, 20 years, or all available history
-
Read automatically generated key takeaways explaining the most important seasonal findings
The new Seasonal Edge rating also helps distinguish potentially meaningful patterns from weak or noisy historical relationships—making it easier to understand both the opportunity and the reliability behind each result.
Seasonality is no longer just a monthly chart. It is now a complete statistical view of when a symbol has historically performed best, when it has struggled, and how much confidence you should place in the pattern.
Find the pattern. Test its strength. Prepare for what comes next.
To access: Search for any global symbol, and then from the menu select Analysis > Seasonality
Analyze Anomalies in any global symbol...
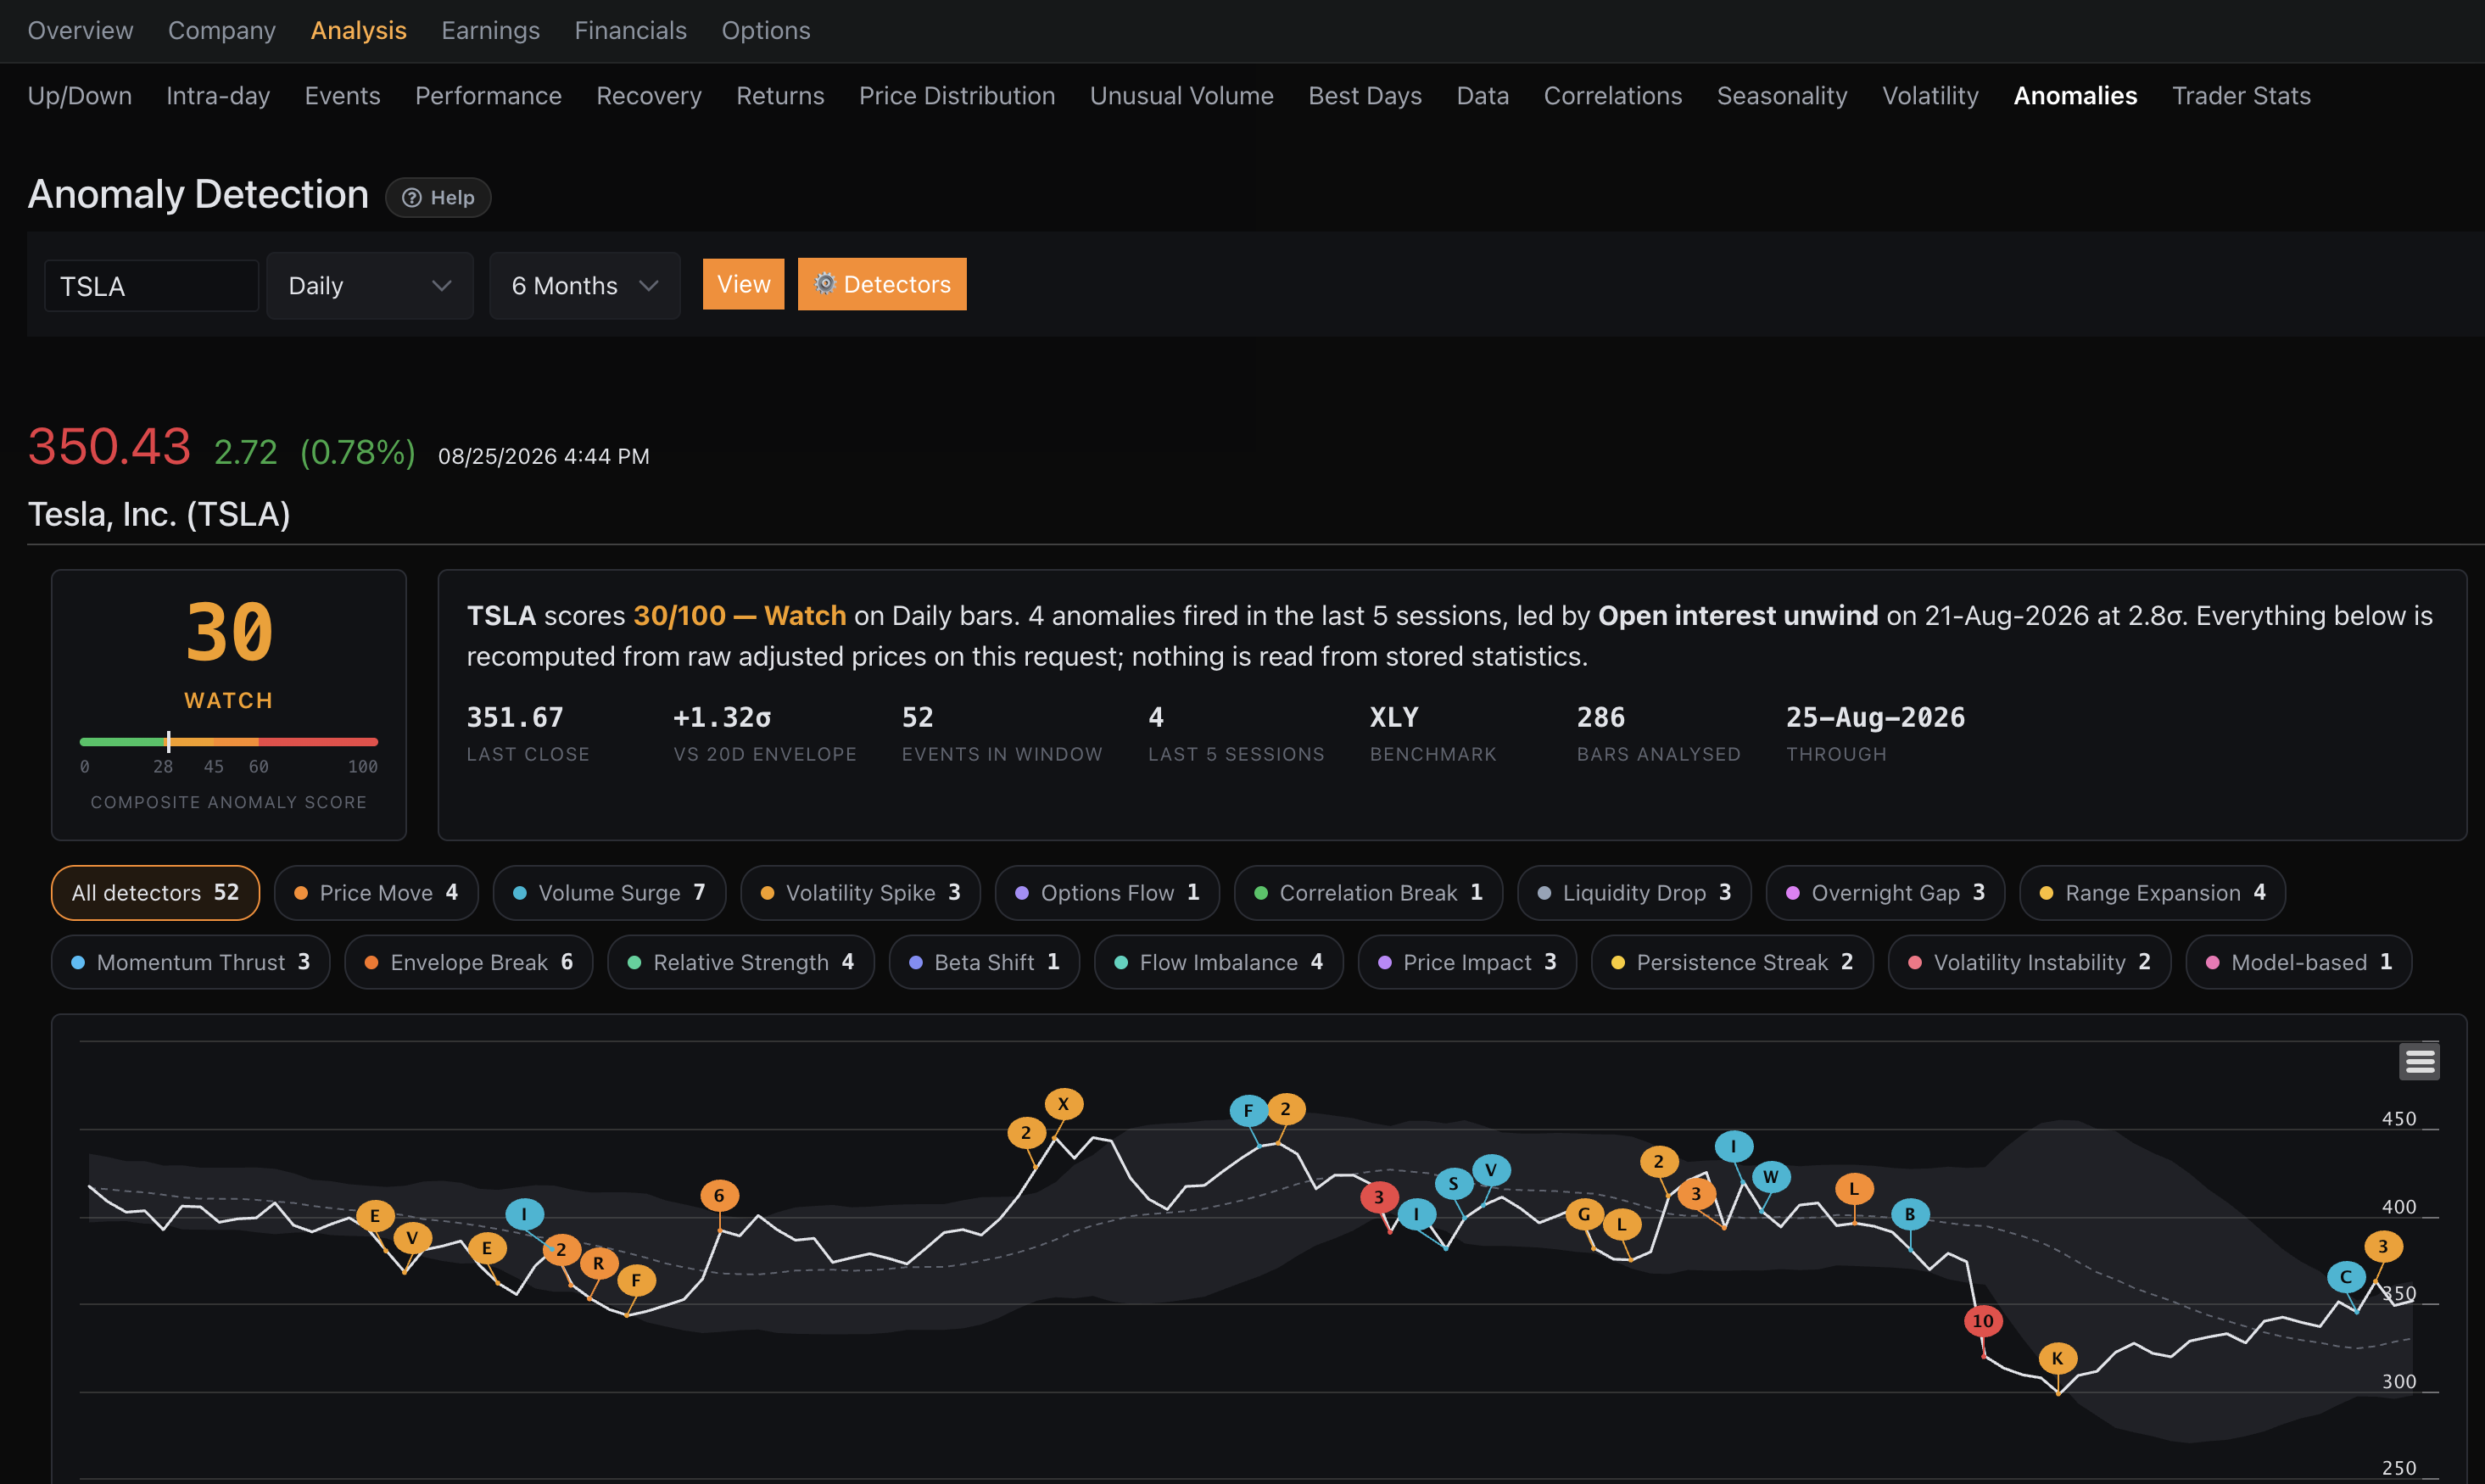
New: Symbol Anomaly Detection
KlickAnalytics introduces a powerful new Anomalies screen that helps you identify unusual market behavior—and investigate what may be driving it.
Run anomaly analysis on any symbol using daily or intraday bars. More than 25 specialized detectors continuously examine price, volume, volatility, options activity, liquidity, momentum, correlations, gaps, relative strength, flow imbalances, and other market behavior.
With Symbol Anomalies, you can:
-
Generate a composite anomaly score for any symbol
-
Analyze daily or intraday market data
-
Choose the historical period to examine
-
Detect unusual price moves, volume surges, volatility spikes, options activity, liquidity drops, correlation breaks, overnight gaps, and more
-
View every anomaly directly on an interactive price chart
-
Review a detailed event log with severity, confidence, statistical significance, and score contribution
-
Compare expected versus actual values and see the historical baseline behind each event
-
Explore news published before, during, and after the event to investigate potential catalysts
-
Customize detector triggers, thresholds, baselines, weights, and active status
Instead of simply showing that a symbol moved, KlickAnalytics helps reveal what was statistically unusual, when it happened, how significant it was, and which news may help explain it.
Detect the unusual. Investigate the catalyst. Understand the move.
To access: Search for any symbol say TSLA and then go to Analysis > Anamolies
Build Your Own Live Market Tables
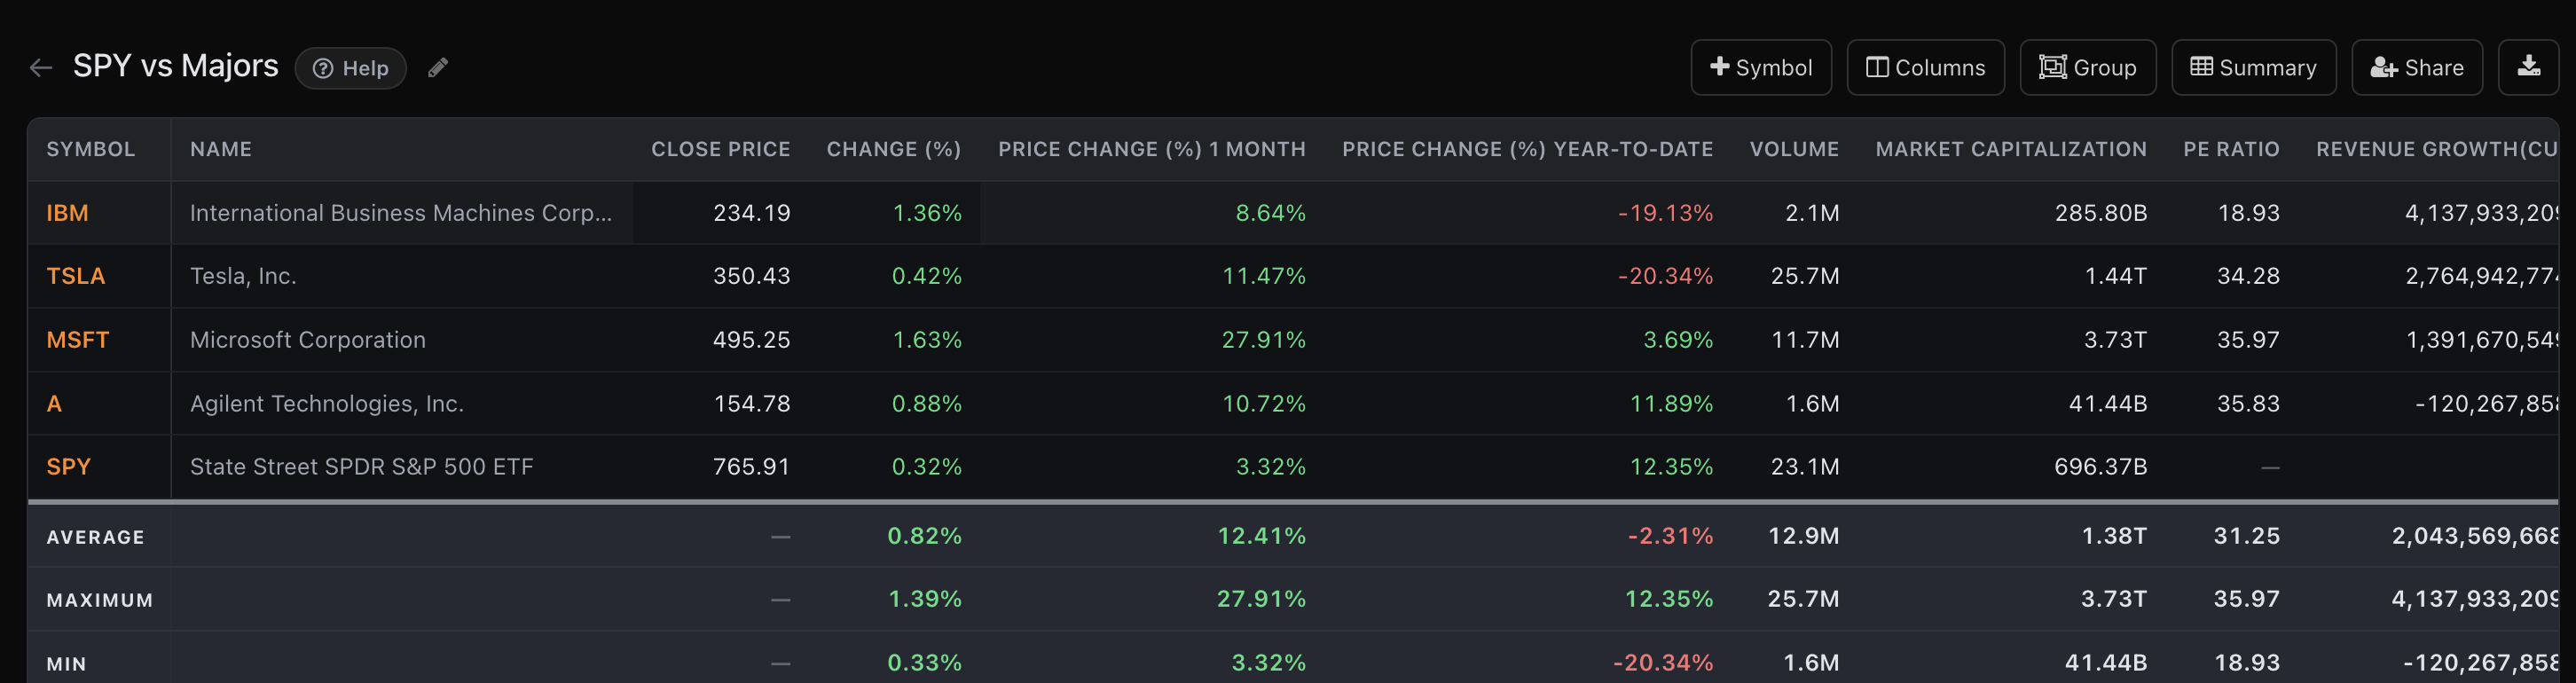
New: Build Your Own Live Market Tables
The new KlickAnalytics Table App lets you create fully customized, live market-data workspaces built around the instruments and metrics that matter to you.
With the Table App, you can:
-
Add and compare your chosen symbols
-
Select from a broad range of market, company, fundamental, technical, and corporate-action data
-
Create custom calculated columns that update with the latest data
-
Add peer-comparison columns
-
Reorder columns and apply visual shading
-
Group instruments by sector, industry, market-cap band, asset type, currency, or exchange
-
Generate instant summaries, including averages, minimums, maximums, and totals
-
Share tables with your team
-
Export table data for further analysis
Whether you are comparing stocks, monitoring a watchlist, analyzing peers, or building a specialized market view, the Table App keeps your data organized, continuously updated, and ready for analysis.
Your symbols. Your columns. Your live market workspace.
To access: From the menu, click on My > Tables
The KlickAnalytics Help Centre
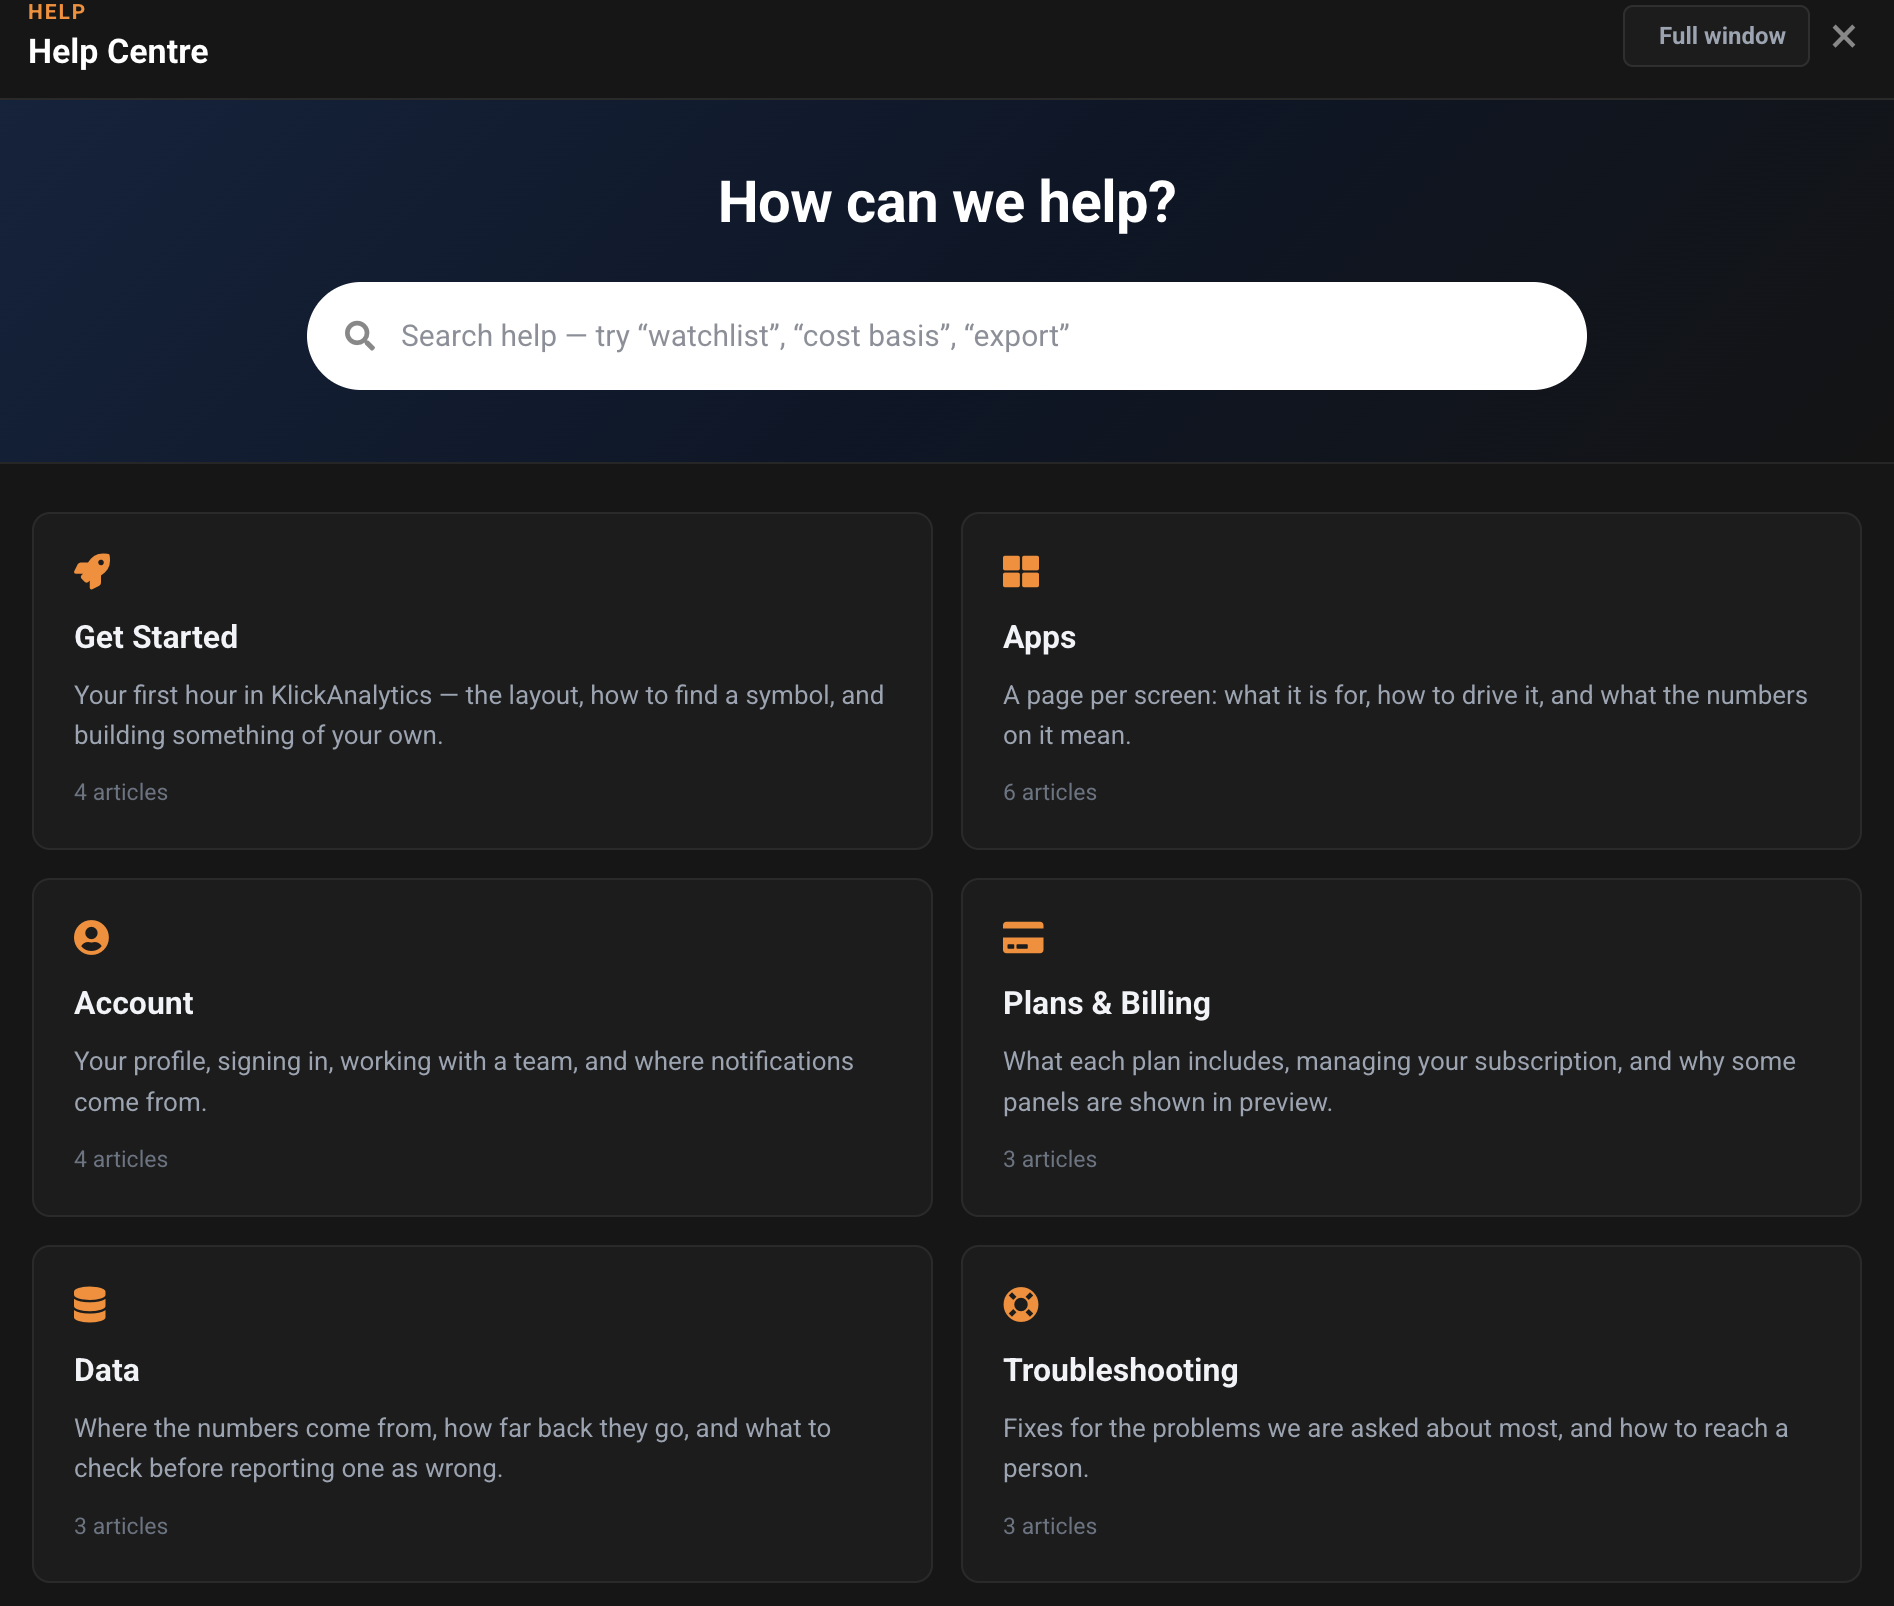
The KlickAnalytics Help Centre
Getting answers and learning how to use KlickAnalytics is now easier with our new Help Centre.
Search for help or explore organized guides covering:
-
Getting started with KlickAnalytics
-
Using individual apps and understanding their data
-
Managing your account, team, and notifications
-
Plans, subscriptions, and billing
-
Data sources, history, and validation
-
Troubleshooting common issues and contacting support
Open the Help Centre without leaving your current workspace, or expand it into a full window for a more focused experience.
Find answers faster. Learn every feature. Get more from KlickAnalytics.
Faster Access to Everything That Matters
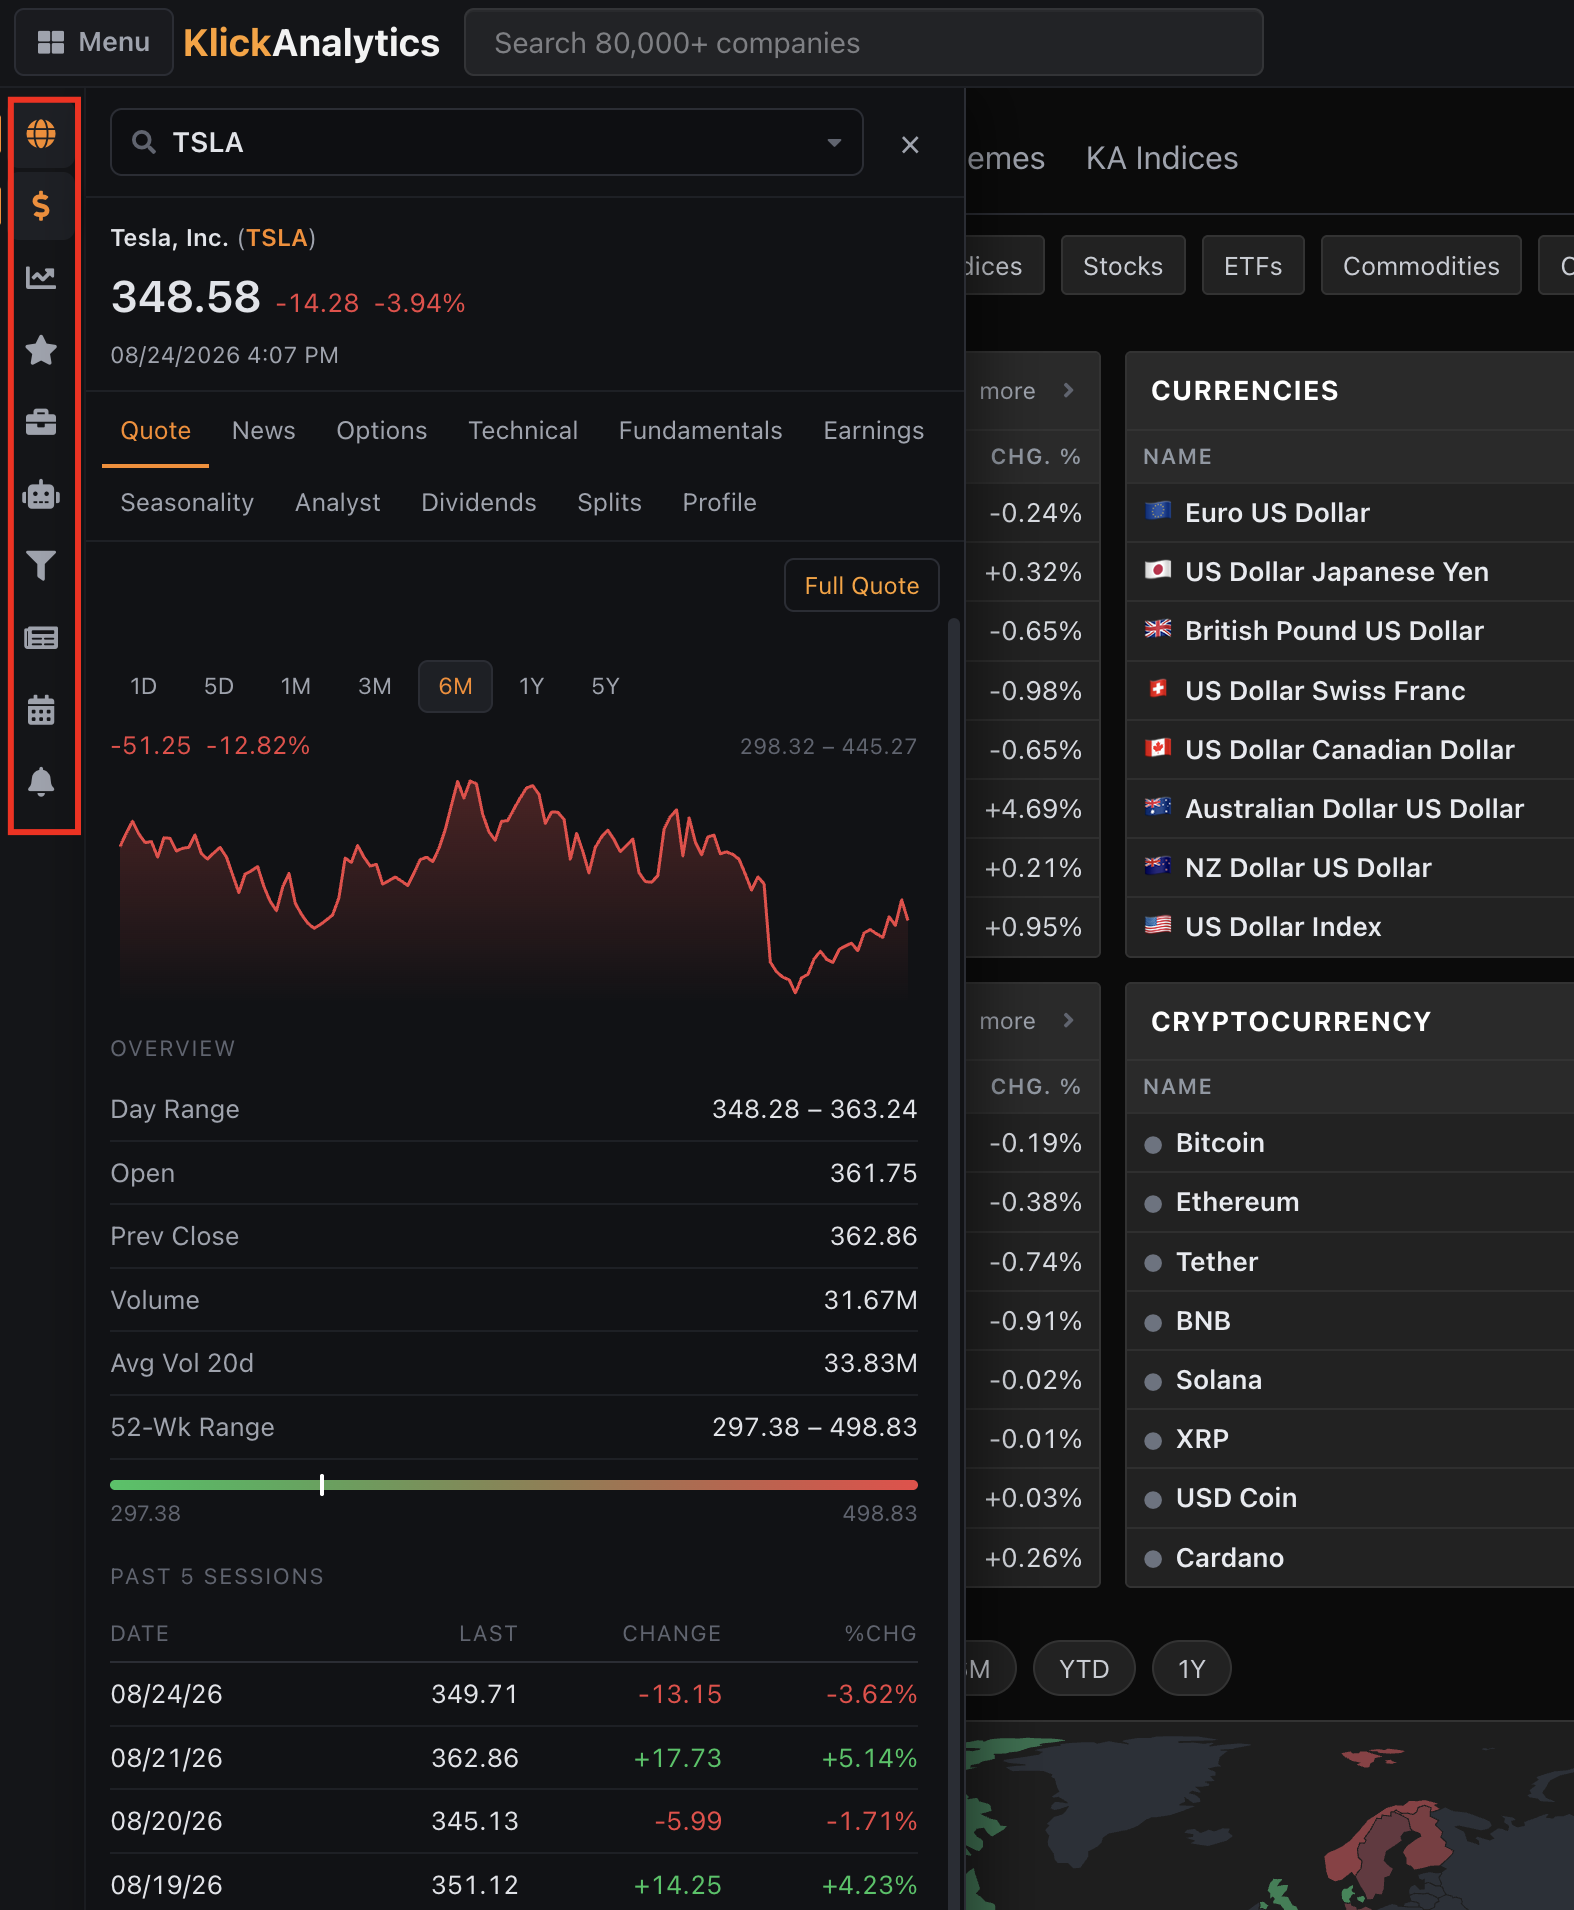
Faster Access to Everything That Matters
KlickAnalytics now makes it easier to move between your most-used market tools through a new quick-access sidebar.
With a single click, you can instantly open:
-
World markets
-
Symbol search and quotes
-
Interactive charts
-
Watchlists and portfolios
-
AI-powered market intelligence
-
Screeners and research tools
-
News and market updates
-
Economic calendars
-
Alerts and notifications
You can also search for any symbol and immediately view its price, performance chart, news, options, technicals, fundamentals, earnings, seasonality, analyst insights, dividends, splits, and company profile—without leaving your current page.
Less navigation. Faster research. Everything you need, always within reach.
World Markets—See What’s Moving Around the Globe
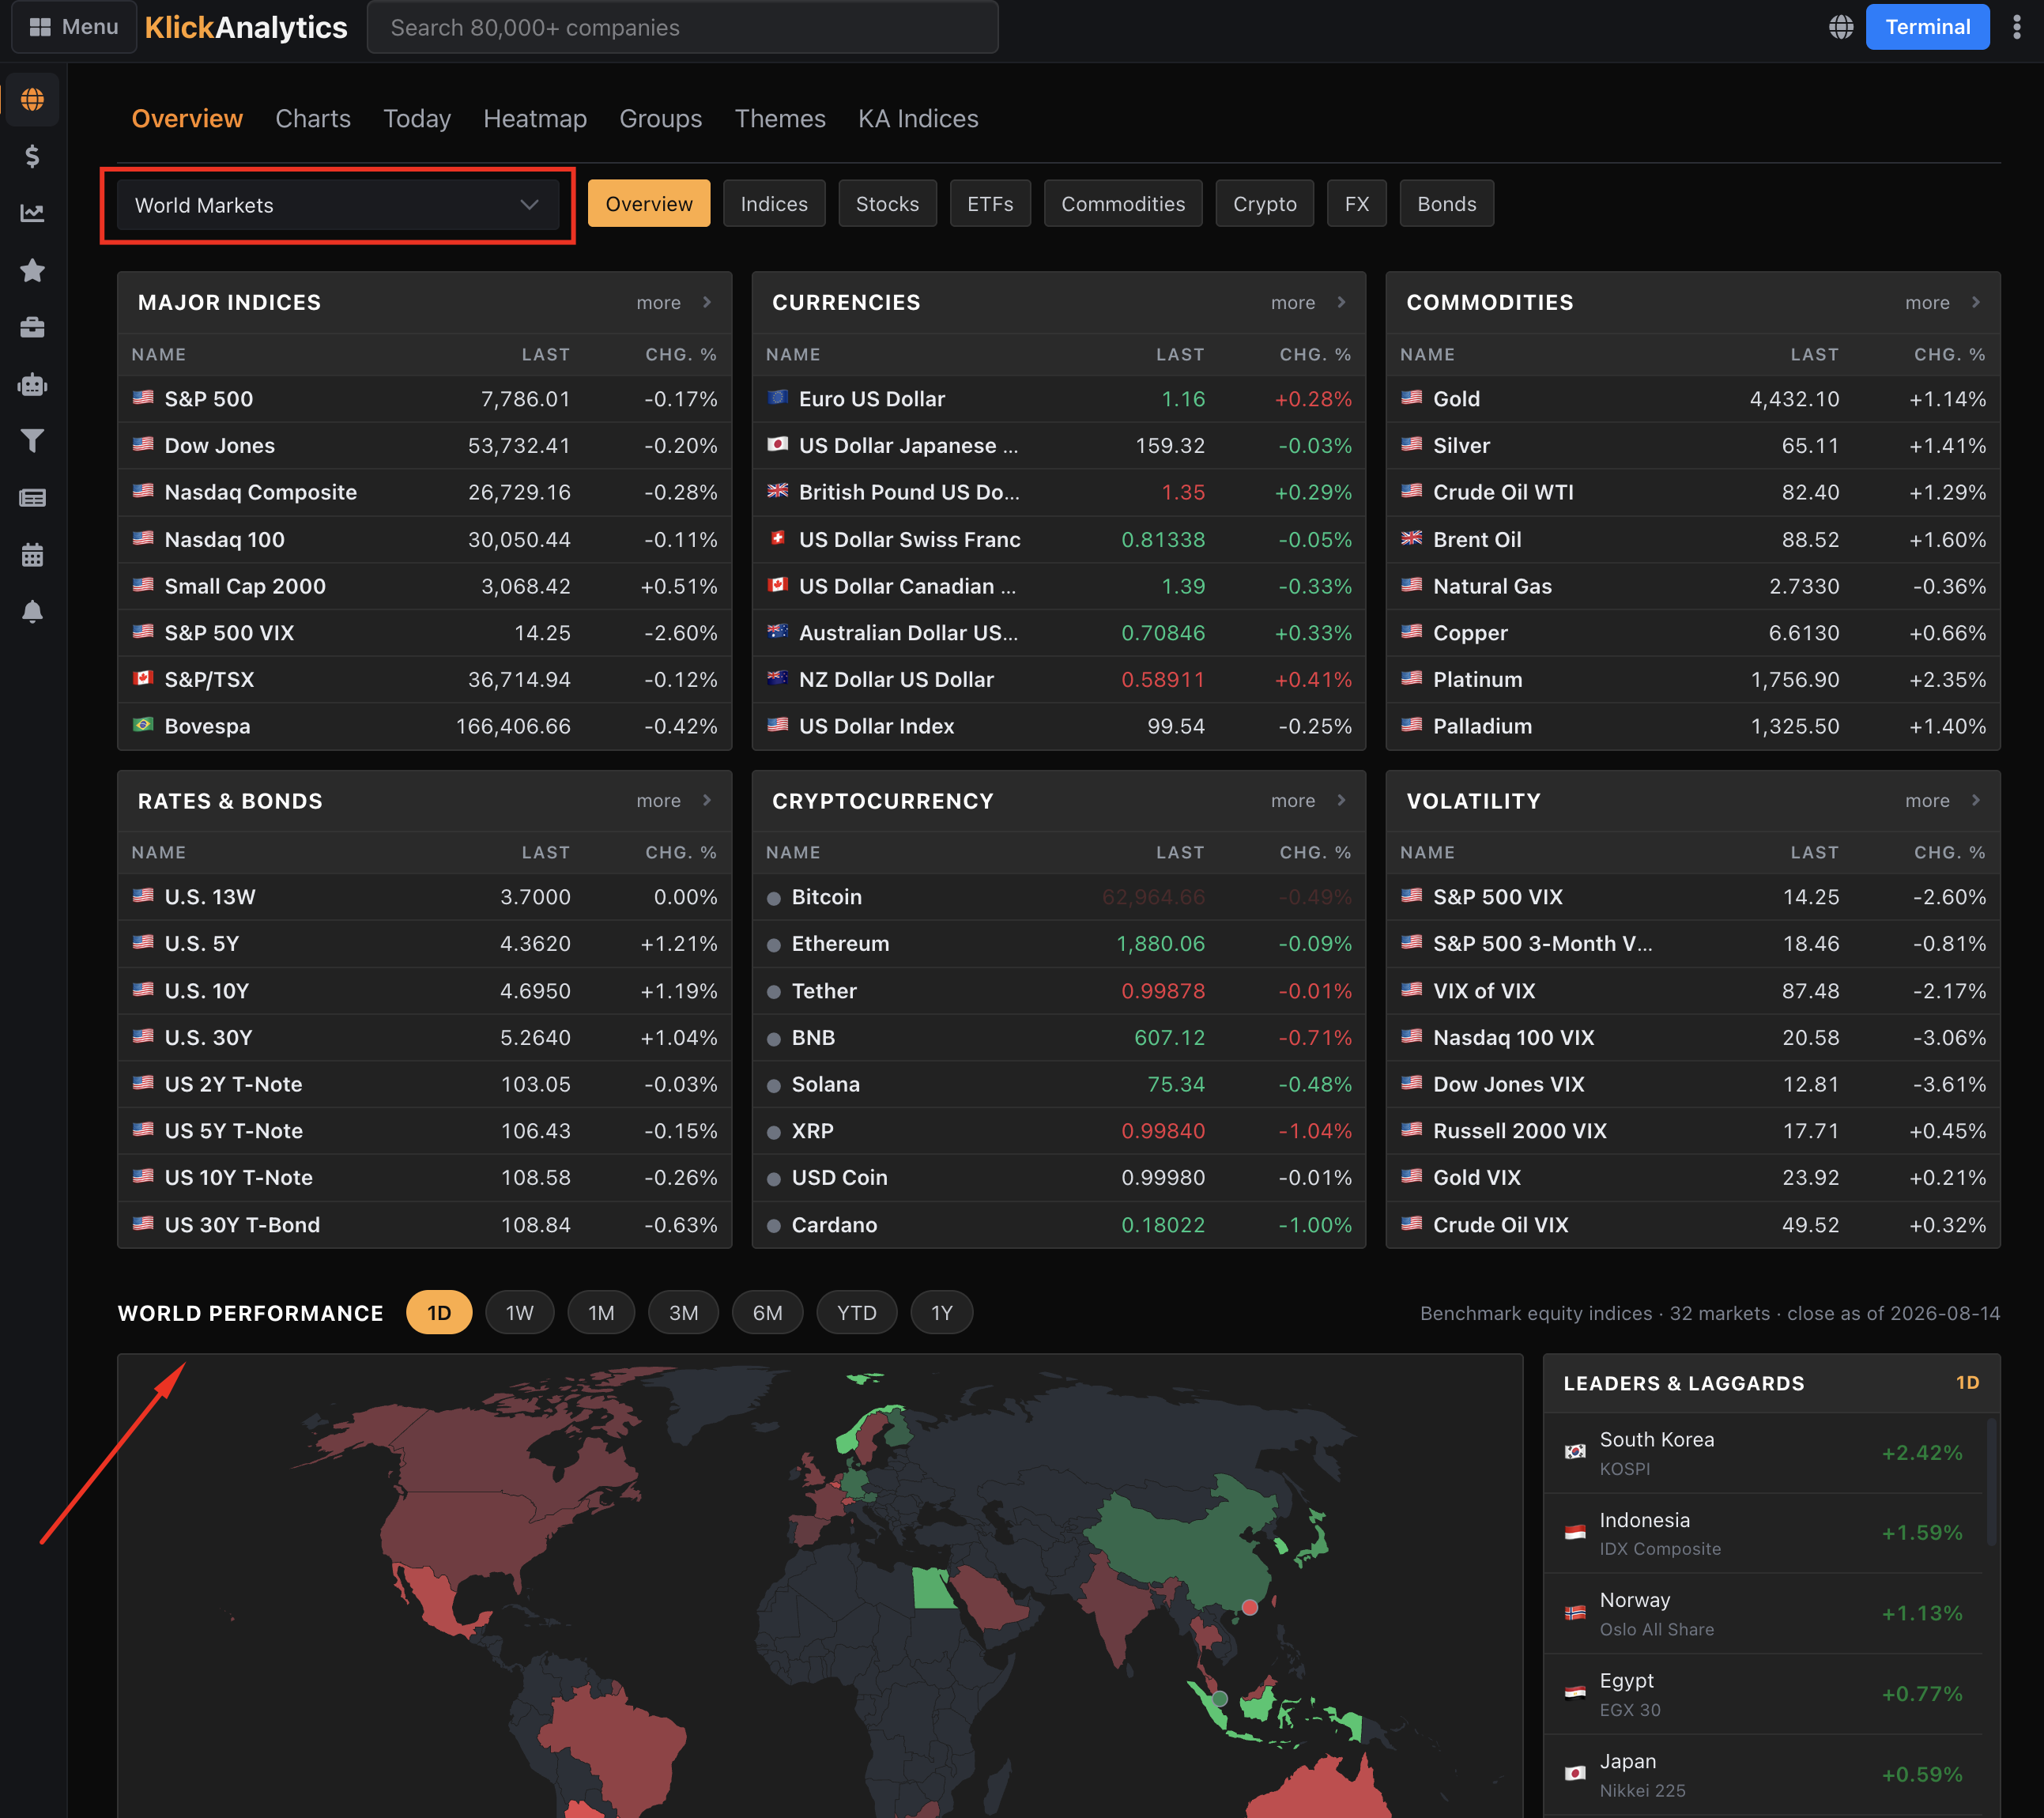
KlickAnalytics introduces World Markets, a unified view of global market activity designed to help you understand what is happening across regions and asset classes at a glance.
Quickly monitor:
- Major global indices
- Currencies and foreign-exchange pairs
- Commodities and energy markets
- Government rates and bonds
- Cryptocurrencies
- Volatility indices
- Global stocks and ETFs
The new interactive world map provides an immediate visual view of market performance across countries. Switch between time periods—from one day to one year—to see where markets are gaining or declining.
You can also identify global leaders and laggards, compare regional performance, and discover the markets driving the day’s biggest moves.
Global markets. Top movers. One powerful map.
Market TV—Financial News, All in One Place
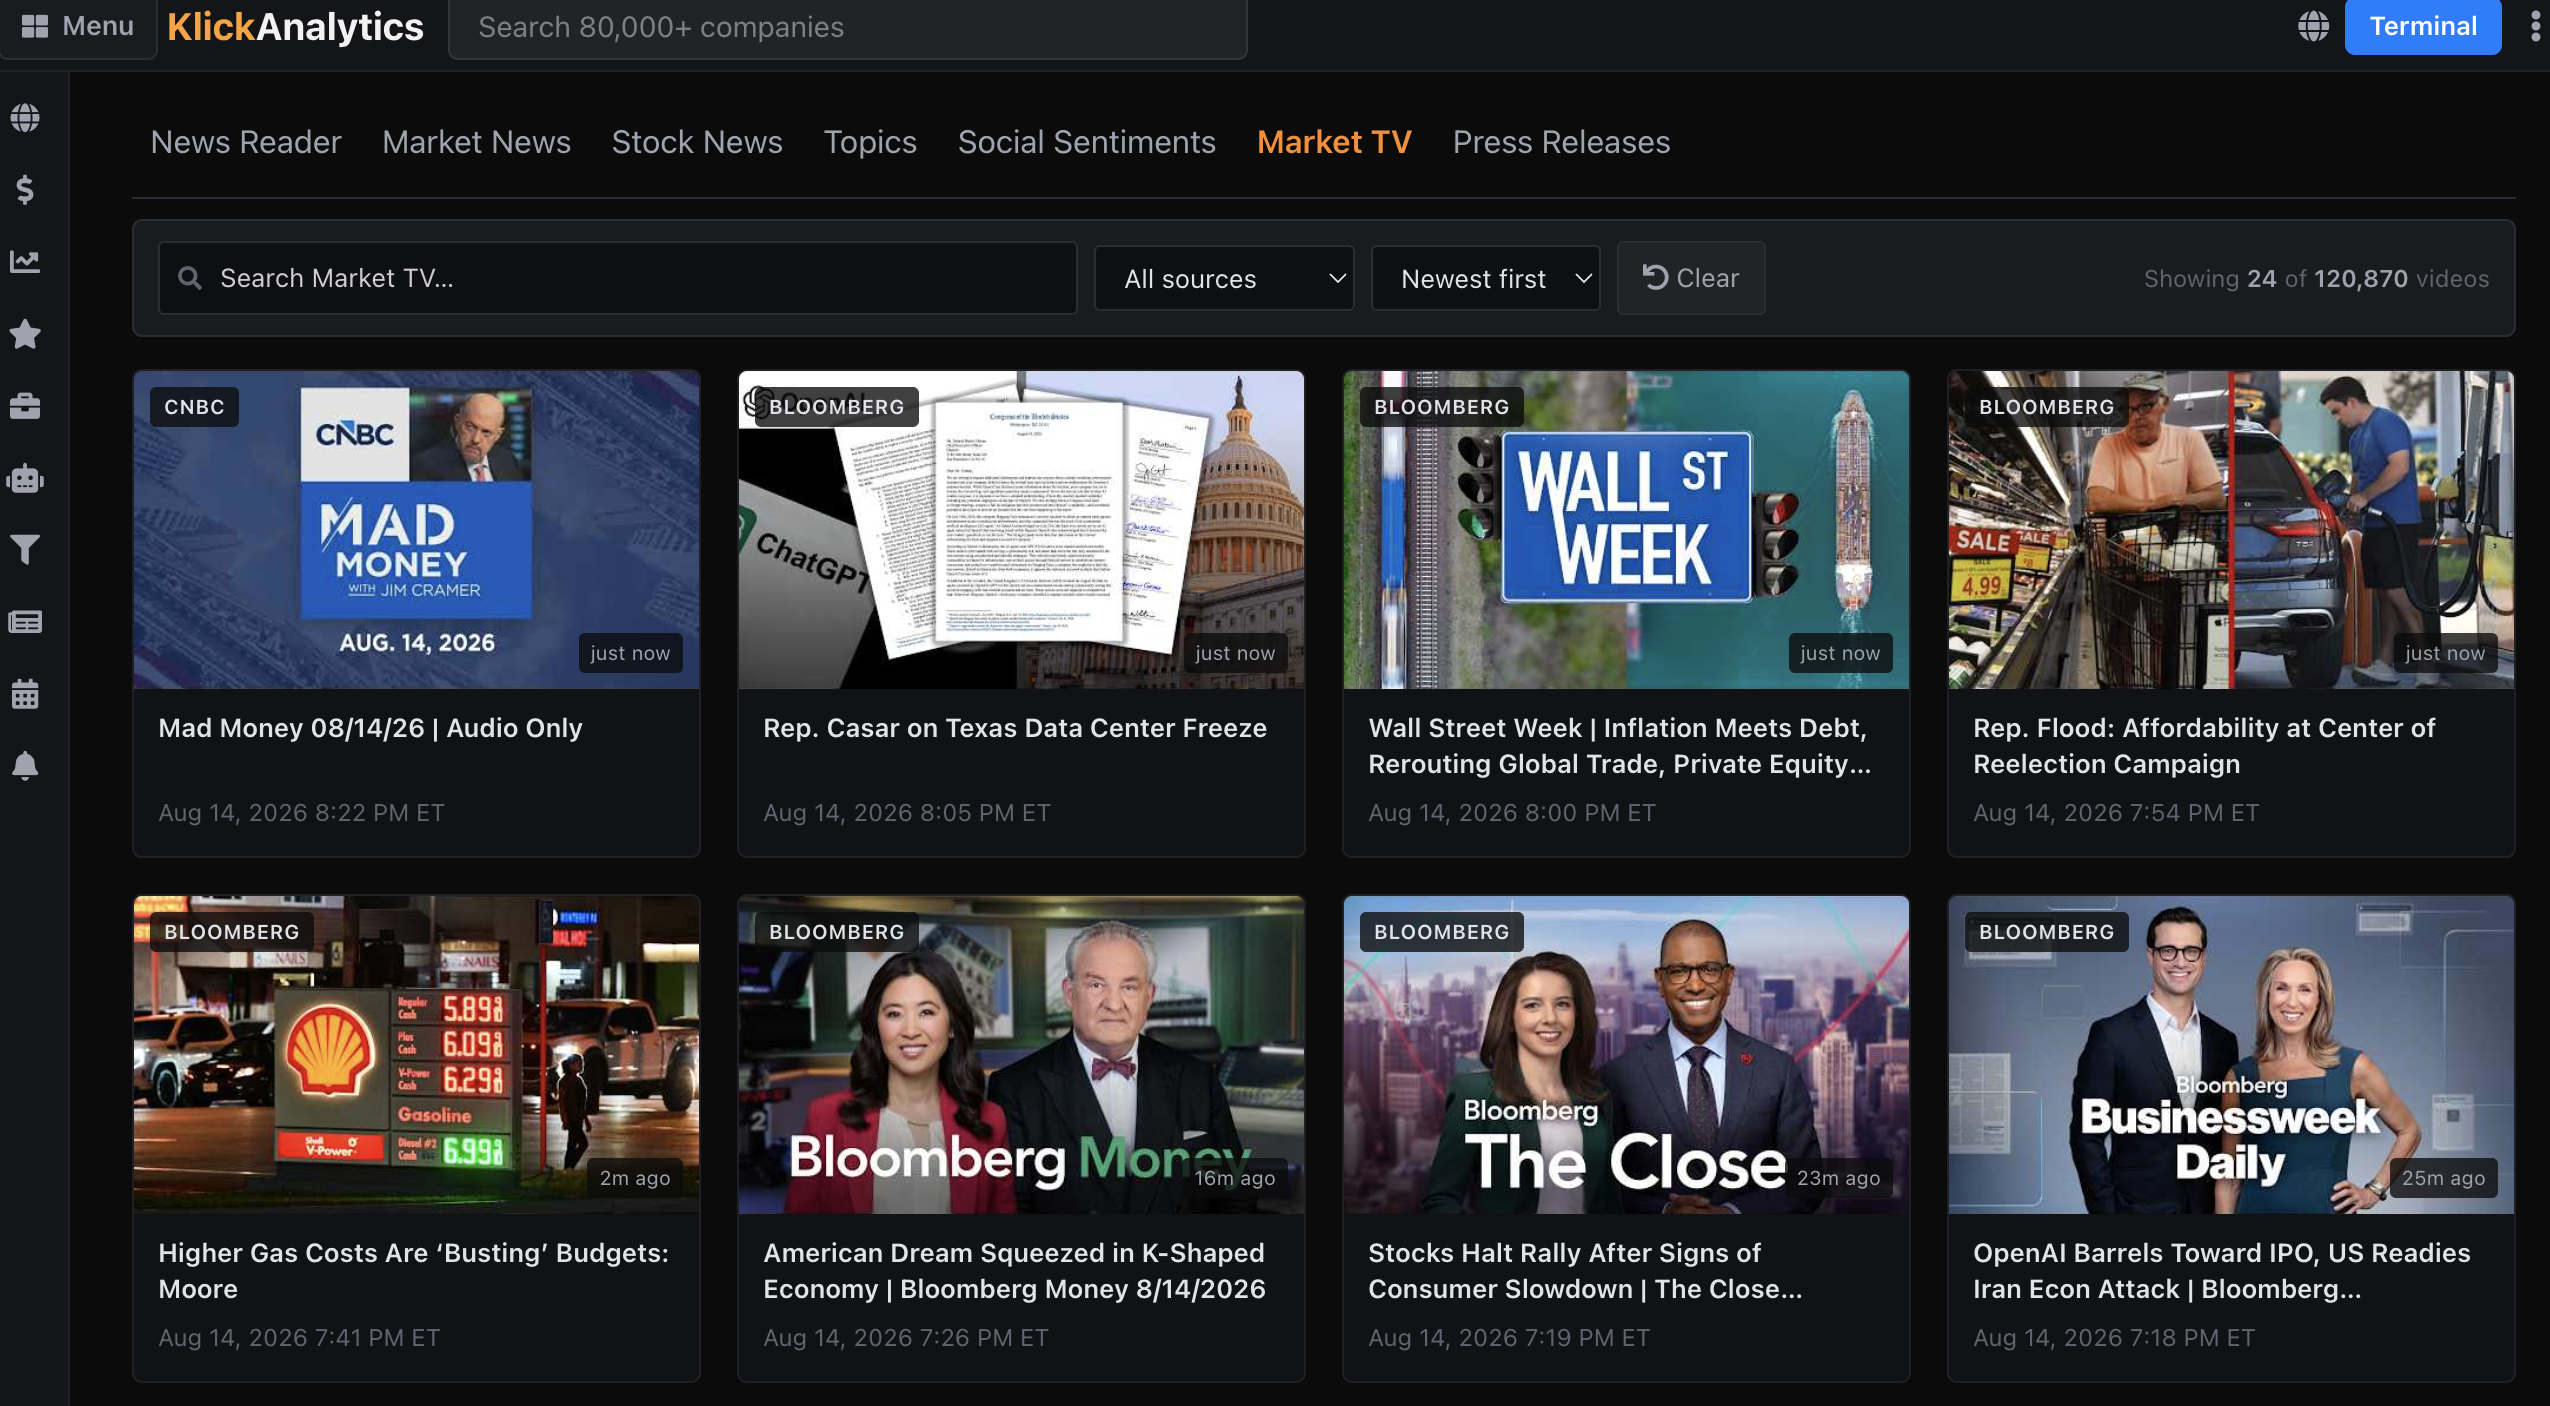
KlickAnalytics now gives you direct access to the latest financial-market videos from leading sources, including CNBC and Bloomberg.
With Market TV, you can:
- Watch the latest market news, interviews, and financial programs
- Explore more than 120,000 market-related videos
- Search for companies, topics, events, and market themes
- Filter videos by news source
- Sort coverage to find the newest updates first
- Follow breaking news, economic developments, earnings discussions, and expert market commentary
From market-moving headlines to in-depth analysis, Market TV makes it easier to stay informed without leaving KlickAnalytics.
Watch the news. Understand the markets. Make better-informed decisions.
Ask the market a question. Get a calculated answer.
The AI is not a chatbot bolted onto a document store. It calls the same analytics engine that powers every screen on this platform — so what comes back is a number it computed from raw history, with the command that produced it.
86,000+ instruments
Global equities, ETFs, funds, options, FX, commodities, crypto, economics, filings, transcripts and news — one normalised symbol universe with adjusted history.
A real analytics engine
Screening, backtesting, technicals, options analytics, correlations, seasonality and factor models — computed on demand from raw prices, never a stale cache.
It shows its working
Answers arrive with the charts, tables and tool calls behind them, so you can check the number instead of trusting a paraphrase.
Your own documents
Upload filings, decks and research. Ask across them and the answer cites the page it came from.
Agents and workflows
Multi-step research that runs the platform's tools for you — screen, pull the history, compute, compare, then write it up.
MCP, CLI and API
The same command catalogue from Claude, your own agent, a shell or your pipeline. The answer on screen is the answer your job gets at 4am.
You ask
“How does NVDA usually trade through earnings?”
It calls
→ ka.options_expected_move(NVDA)
It answers
NVDA has averaged a 9.2% absolute move on the day after earnings and closed higher 67% of the time. Two in three reactions land between −4.2% and +16.3% — the distribution is skewed right, not symmetric.
Every figure computed live from our own history — not scraped, not summarised.
Or start with