What's New
Product updates, improvements and fixes across the KlickAnalytics platform.
Candlestick Patterns Analysis
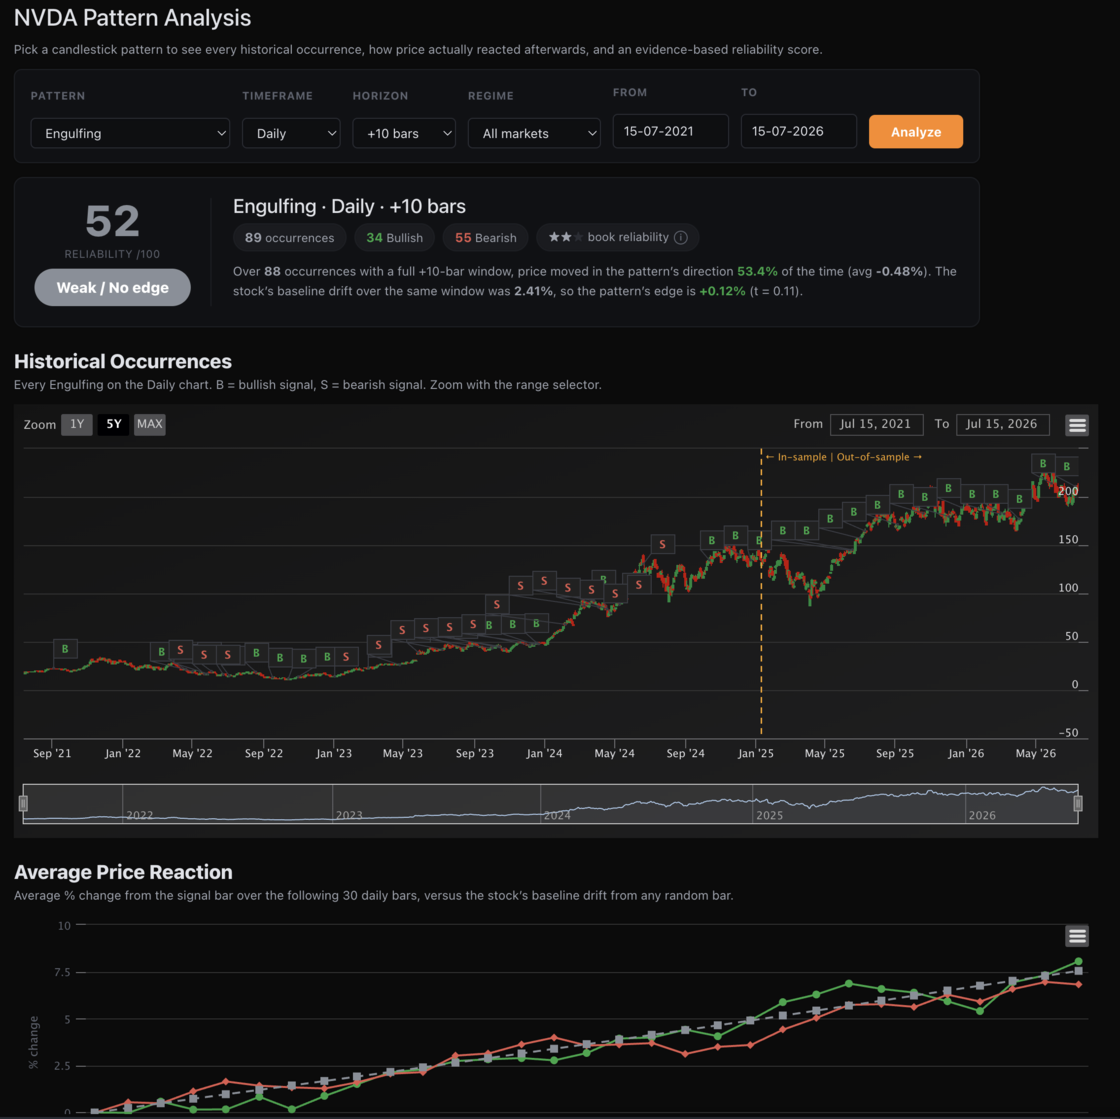
Every charting platform will tell you a Morning Star is a bullish reversal. None of them will tell you whether it has ever actually worked on the stock you're looking at.
Today we're shipping a rebuilt Technicals section — including Pattern Analysis, an evidence engine that back-tests all 24 candlestick patterns against a symbol's own price history and scores them on what really happened next.
Technicals → Overview
- Summary, Technical Indicators and Moving Averages gauge meters at a glance
- 12 indicators — RSI, STOCH, STOCHRSI, MACD, ADX, Williams %R, CCI, ATR, Highs/Lows, Ultimate Oscillator, ROC, Bull/Bear Power — each with a Buy/Sell/Neutral call
- Moving Averages (SMA + EMA, 5 through 200) and Pivot Points across five methods: Classic, Fibonacci, Camarilla, Woodie's and DeMark's
- Daily, Weekly and Monthly timeframes
Technicals → Candle Patterns
- Interactive candlestick chart with every pattern flagged directly on the bars
- 24 patterns detected across Daily, Weekly and Monthly, split into Emerging and Completed
- Filter instantly by timeframe, pattern indication, type and reliability — chart and table update together, with no page reload
Technicals → Pattern Analysis — the new engine
- Pick any pattern and see every historical occurrence marked on the chart
- Average Price Reaction — how price actually moved over the following bars, plotted against the stock's own baseline drift
- Forward Return Statistics at any horizon from +1 to +30 bars: win rate, average and median return, baseline, edge, MFE/MAE and t-statistic
- Occurrence Detail — every signal, its real forward returns, and whether it worked or failed
- Pattern Leaderboard — all 24 patterns ranked for your symbol, answering "which of these actually work here?"
- Market-regime filter — test a pattern only in uptrends or only in downtrends. Many patterns behave completely differently depending on the trend they appear in
- Custom date range — analyse any window you like
What makes this different
Most pattern tools show you a win rate and stop. A win rate is easy to fake:
- We measure edge, not just wins. A 57% win rate sounds great until you learn the stock rose 56% of the time anyway. We subtract the symbol's own baseline drift, so you see what the pattern contributed — not what the market gave you for free.
- We don't trust small samples. A pattern that went 2-for-2 isn't a 100% pattern. Scores are shrunk by sample size, and anything under 10 occurrences is flagged as untrustworthy rather than celebrated.
- We validate out-of-sample. Every pattern is fitted on the first 70% of history and re-tested on the 30% it has never seen. An edge that only exists in the data it was found in isn't an edge.
- We show you the odds of fooling yourself. Test 24 patterns and roughly one will look significant by pure chance. We print that number next to the survivor count, so you know what "significant" is actually worth.
The honest part
We ran this on TSLA. Zero of 24 patterns survived out-of-sample. One that looked outstanding in-sample — a 68% win rate and a t-statistic above 3 — collapsed the moment it met unseen data.
We could have hidden that. Instead it's the whole point. Pattern Analysis is built to tell you when a pattern is real, and — far more often — when it isn't. That's worth more than another green arrow.
Available now on any global symbol under Technicals → Pattern Analysis. Gauges, charts and pattern detection are open to all users; reliability scores, edge figures and out-of-sample validation are part of Terminal.
To view: Search for any symbol say NVDA, and then click on Overview > Technical > Chart Patterns
Read Options Sentiment at a Glance
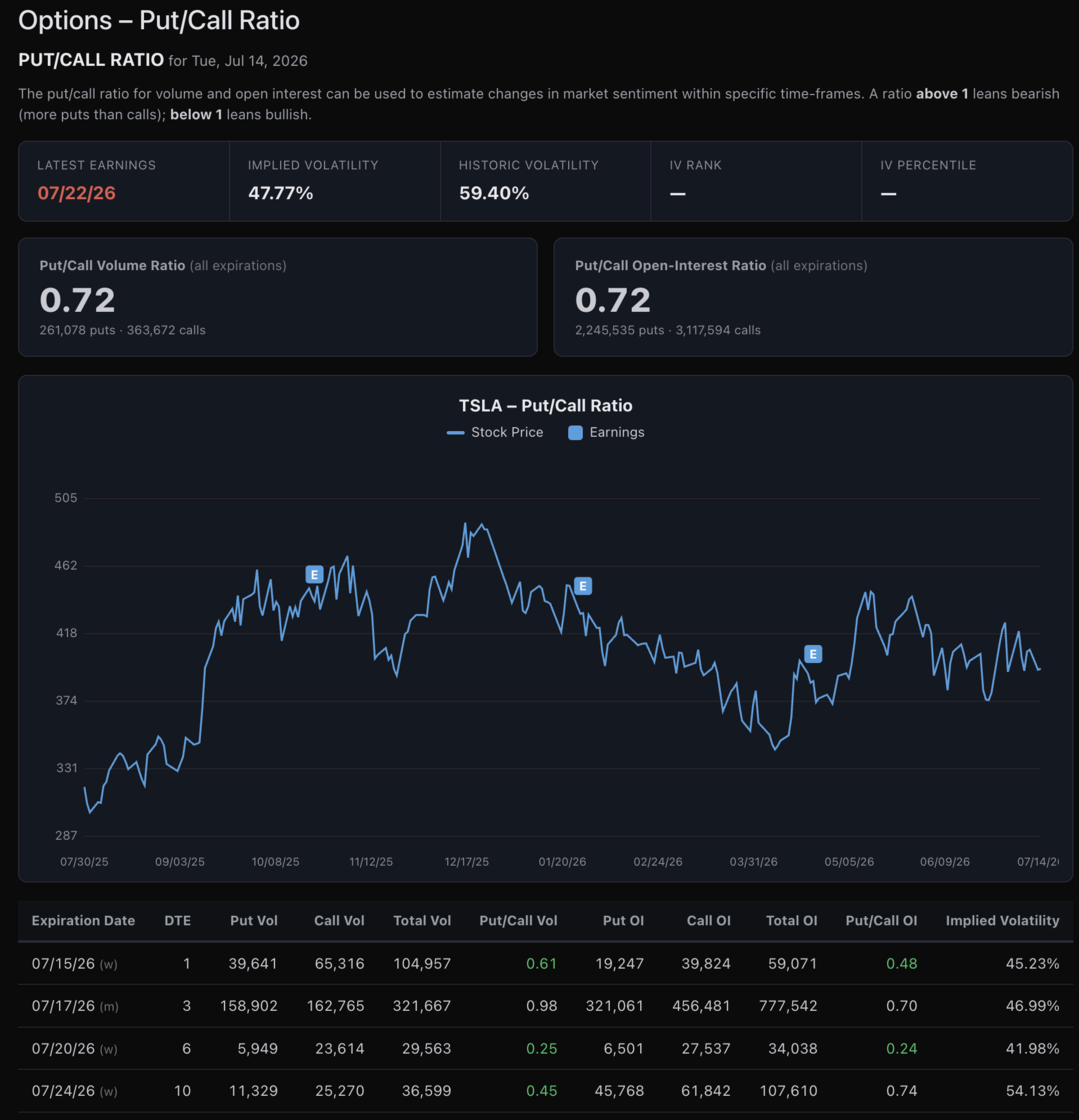
KlickAnalytics now provides a complete Put/Call Ratio analysis for any supported global symbol, helping you quickly understand whether options activity is leaning bullish or bearish.
View both the Put/Call Volume Ratio and Put/Call Open-Interest Ratio across all expirations, along with the underlying put and call totals behind each calculation.
The historical chart places current sentiment in context alongside the stock price and prior earnings events, while the expiration-level table lets you compare:
- Put and call volume
- Put and call open interest
- Put/Call ratios by expiration
- Days to expiration
- Total options activity
- Implied volatility**
A ratio above 1 generally indicates heavier put activity and a more bearish tilt, while a ratio below 1 suggests stronger call activity and a more bullish tilt.
Use it to quickly identify shifts in market positioning, unusual options activity, and differences in sentiment across upcoming expiration dates.
To View: Search for a symbol say TSLA, and the click on Analysis > Options > Put/Call Ratio
See the Expected Move Before Earnings
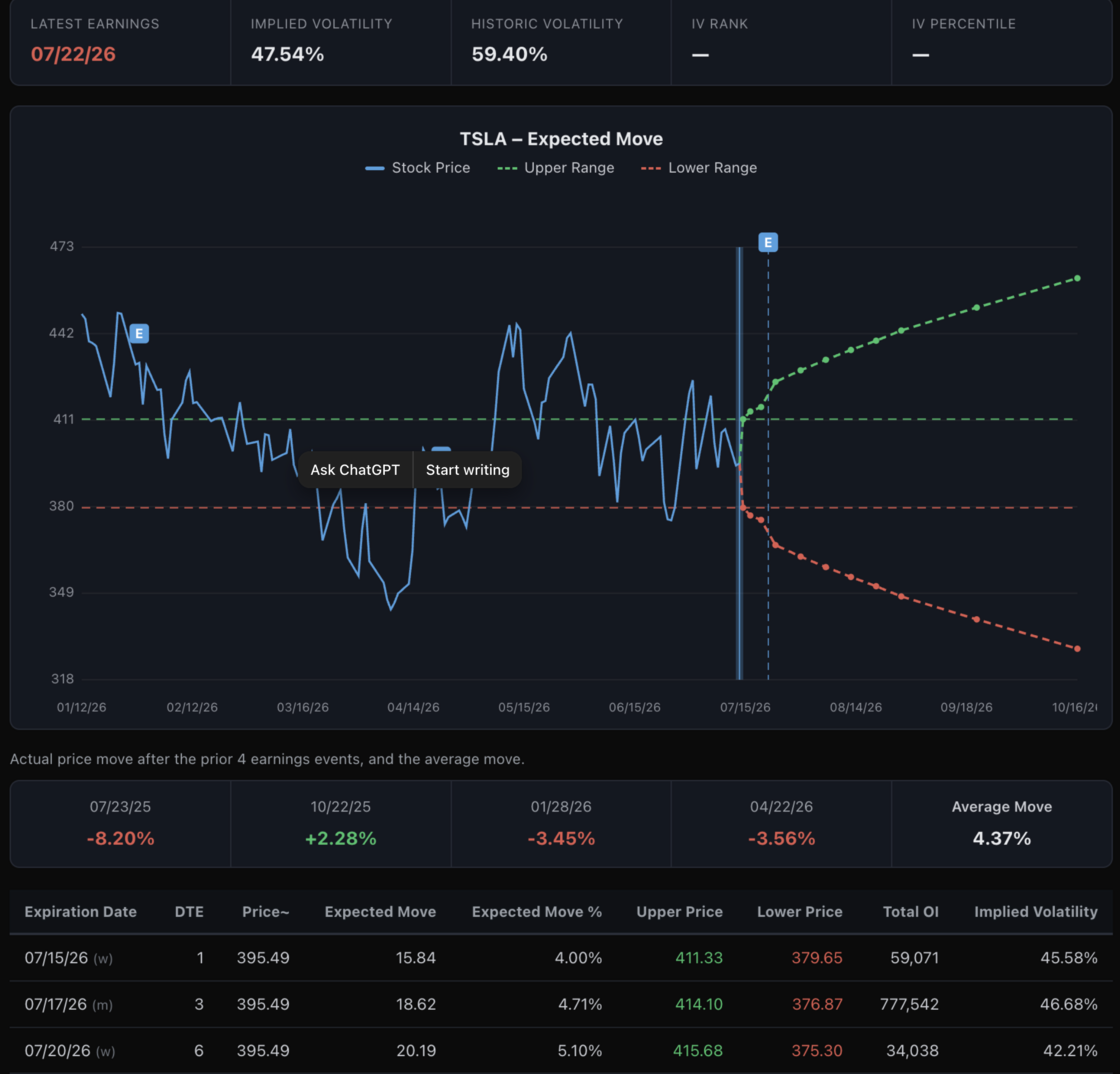
KlickAnalytics now gives you a dedicated Expected Move view for any symbol, helping you quickly understand how the options market is pricing upcoming volatility.
Track key data such as latest earnings date, implied volatility, historic volatility, IV Rank, IV Percentile, expected move amount, expected move %, upper and lower price ranges, days to expiration, open interest, and implied volatility by expiration—all in one place.
You can also view the projected move visually on the chart, compare it with the actual price moves from prior earnings events, and see the average historical move to better judge whether the current options market is pricing a bigger or smaller reaction than usual.
It’s a fast, practical way to analyze earnings risk, volatility expectations, and potential trading ranges before the event.
To view: search for any symbol say TSLA, and then click on Analysis > Options > Expected move
Track Every High, for any Global Symbol...
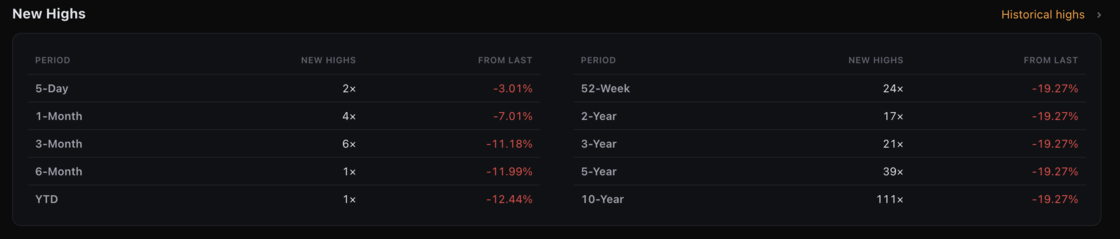
KlickAnalytics now gives you a complete New Highs overview for any global symbol.
See how often a stock, ETF, index, commodity, currency, or other market instrument has reached a new high across multiple periods—including 5-day, 1-month, 3-month, 6-month, YTD, 52-week, 2-year, 5-year, 10-year, and historical highs.
You can also instantly see how far the symbol is currently trading from its latest high, helping you identify momentum leaders, potential breakouts, and instruments that have pulled back from previous peaks—all in one clean, easy-to-read view.
To view: Search for any symbol say AMZN, and then click on Overview > Quotes
Reimagined Earning Calendar
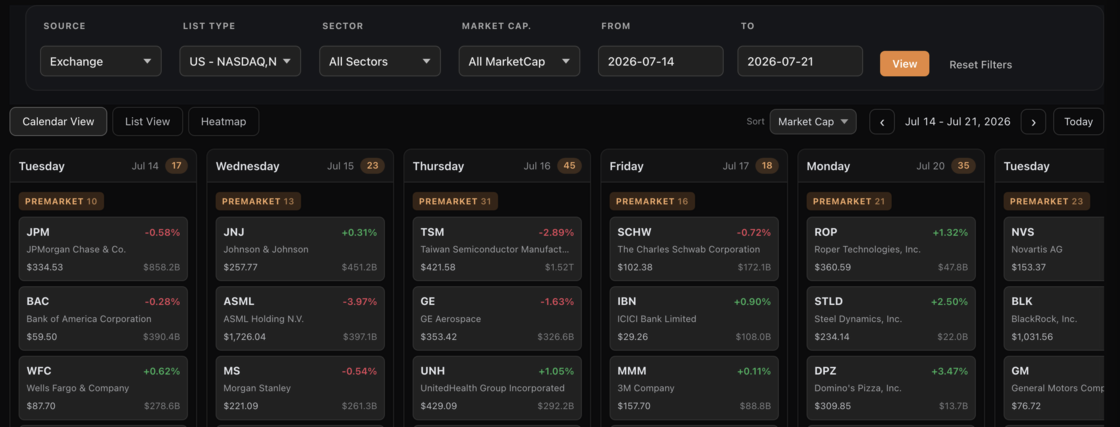
📊 New on KlickAnalytics: a completely reimagined Earnings Calendar
Knowing who reports when shouldn't take more than a glance. So we rebuilt our Earnings Calendar from the ground up — faster, smarter, and built for how traders actually work.
Here's what's new:
🗓️ Three ways to view earnings
- Calendar view — companies laid out day by day, grouped by Premarket / After Hours, sorted by market cap, % change, or volume
- List view — a fully filterable data grid
- Heatmap — an 8-week outlook that shows exactly where earnings season heats up
🎯 Filter to what matters to you
Slice the calendar by Exchange, Index, Market Groups, Collections — or your own Watchlist. Layer in Sector, Market Cap, and a custom date range to get precisely the names you care about.
🔍 Zoom into any stock
Click any company to open an instant snapshot — live quote, day / week / month / year performance, market cap, and a historical EPS chart showing beats vs. misses at a glance. Flip through companies without ever leaving the view.
⚡ Quick, clean, and fast
Jump week to week, hide the noise (parent tickers only), and get a clear read on the week ahead in seconds.
Earnings season just got a whole lot easier to navigate.
👉 To view: Click on Stocks > Earnings
One plan, everything included
We just simplified KlickAnalytics to one plan.
The entire AI + quant + research + automation stack — AI agents, backtests, real-time data, custom formulas, CLI & MCP, workflows, client & team tools — no tiers, nothing held back. 10,000 AI credits/mo included.
One plan. $500/mo. Everything.
You don't need to do anything. As an existing subscriber, you keep your current price — you're grandfathered in. This new pricing applies to new subscriptions going forward.
We're going all-in on depth: a lot of new analytics are landing coming soon, and every one of them lands in your plan automatically.
Build Options Strategies with Instant Payoff Diagrams
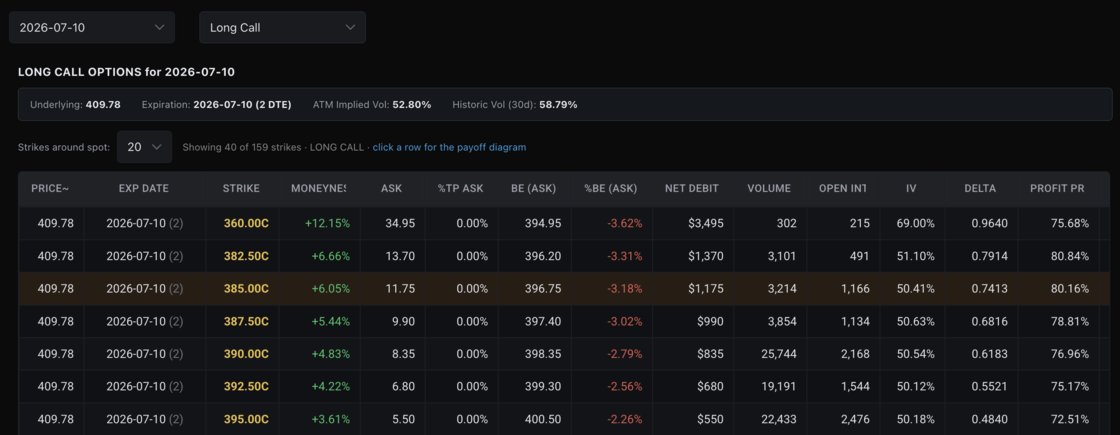
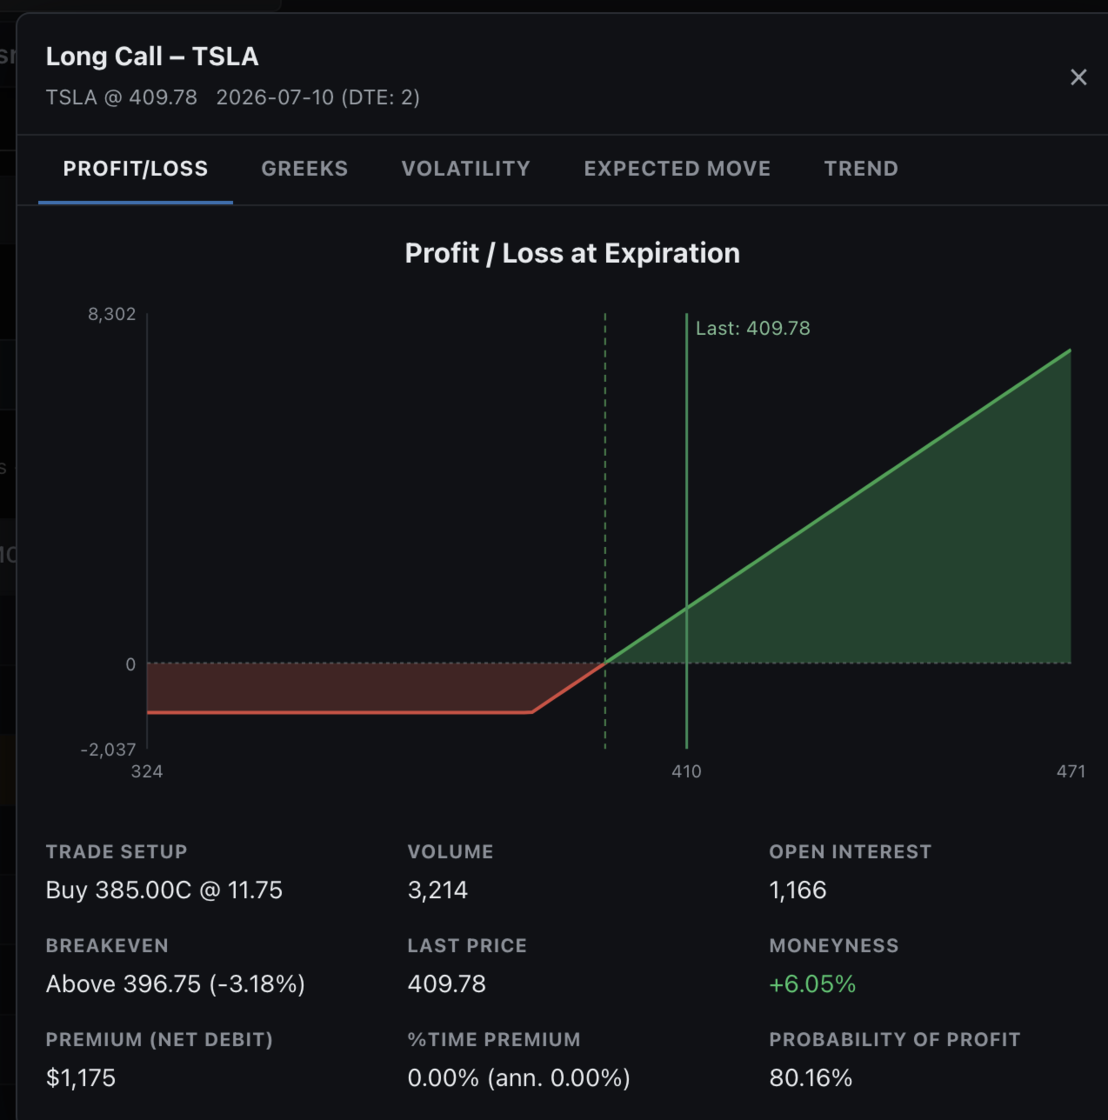
KlickAnalytics now lets you explore options strategies such as Long Calls, Long Puts, Covered Calls, Spreads, Straddles, and more.
Compare strikes, premiums, breakeven levels, implied volatility, volume, open interest, and probability of profit—then click any setup to view an interactive profit-and-loss payoff diagram, Greeks, volatility, expected move, and trend analysis.
From screening opportunities to understanding risk before placing a trade, the complete strategy picture is now in one place. To access: Search for any symbol say TSLA, and then click on Options > Options Strategies
Excel-Style Formula Scanner
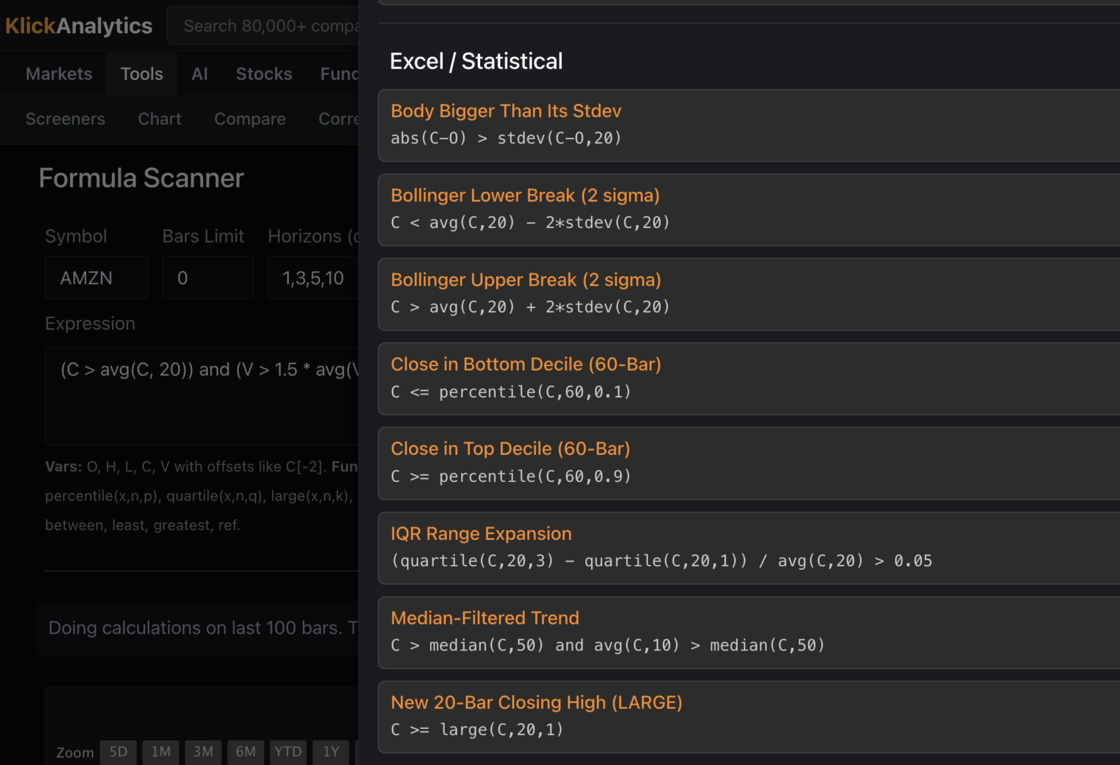
KlickAnalytics Formula Scanner now supports Excel / statistical-style formulas — making it easier to scan markets using logic traders already understand.
Build formulas like:
C > avg(C,20) + 2*stdev(C,20)
or scan for things like:
Bollinger breaks, percentile moves, median trends, IQR expansion, volume spikes, and custom statistical conditions.
No complex scripting. No hard-coded screeners. Just write the formula, run the scan, and find the setups that matter.
To access: From the top menu, Click Tools > Formula Scanner
AI Chat Just Got Visual...
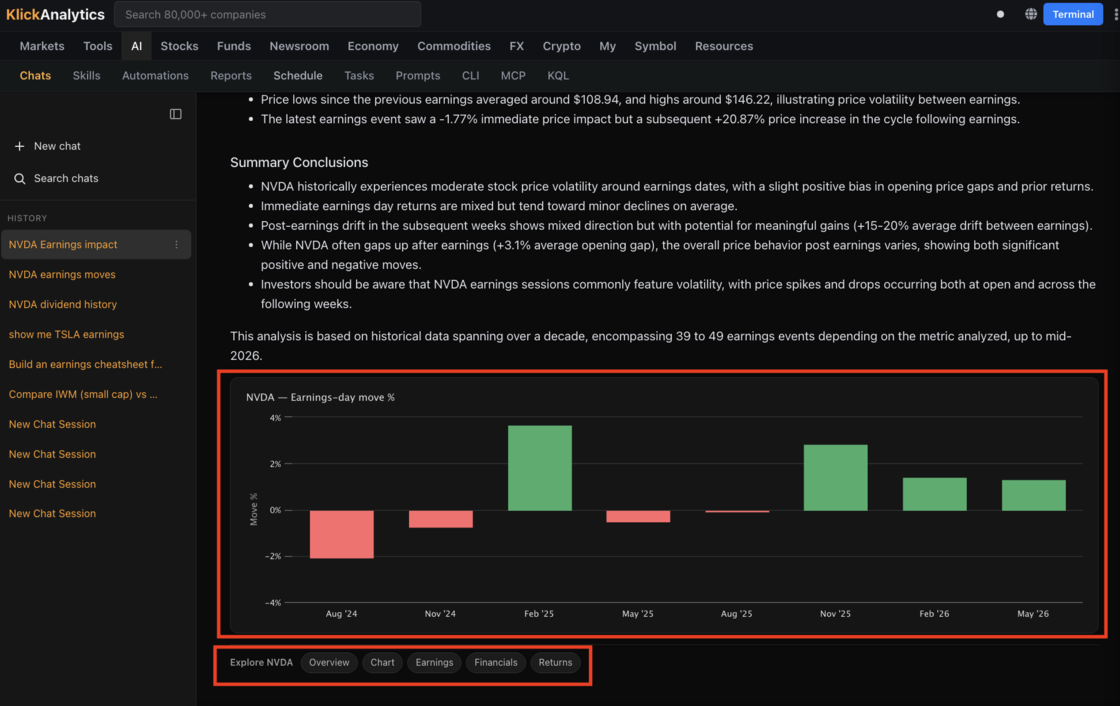
KlickAnalytics AI Chat now goes beyond answers.
It can analyze the data, explain the story, and generate visualizations directly inside the conversation — charts, tables, earnings views, returns breakdowns, and more.
- No switching tabs.
- No building charts manually.
- Just ask the question — and the AI turns the answer into something you can actually see.
From earnings impact to price moves, financials, returns, and market behavior, KlickAnalytics Chat is becoming a true research workspace.
Ask. Analyze. Visualize. Explore.
To View: From the top menu, Click on AI > Chats > and start a new chat, and in chat input box, type "Show me how NVDA perform during its earning sessions"
Markets Don’t Move in Rows. They Move in Maps...
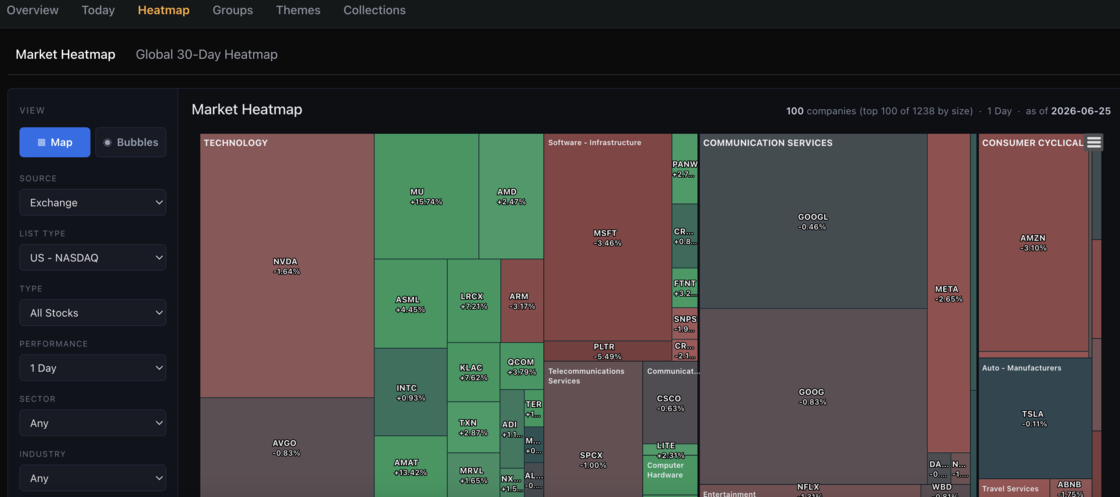
Markets are not just numbers in a table.
They are movement, pressure, strength, weakness, rotation, momentum, and risk — all happening at the same time.
That is why we built the KlickAnalytics Market Heatmap.
Now you can visually explore the market through a fully interactive heatmap and bubble view:
- Select an exchange.
- Switch between market groups, sectors, themes, collections, and your own watchlists.
- Zoom in and out of the market.
- Move from a full market view into individual sectors and stocks.
- Change bubble size by price, market cap, volume, change, performance, or other metrics.
- Track gainers, losers, concentration, and rotation in seconds.
Now you can,
- Use Map View when you want structure.
- Use Bubble View when you want motion.
- Use filters when you want focus.
Instead of scrolling through hundreds of tickers, you can see where the market is leaning instantly.
This is built for traders, investors, analysts, and anyone who wants to understand the market faster.
KlickAnalytics Market Heatmap — the market, mapped visually.
To view: From the top menu, click Markets > Heatmap > Market Heatmap
Ask the market a question. Get a calculated answer.
The AI is not a chatbot bolted onto a document store. It calls the same analytics engine that powers every screen on this platform — so what comes back is a number it computed from raw history, with the command that produced it.
86,000+ instruments
Global equities, ETFs, funds, options, FX, commodities, crypto, economics, filings, transcripts and news — one normalised symbol universe with adjusted history.
A real analytics engine
Screening, backtesting, technicals, options analytics, correlations, seasonality and factor models — computed on demand from raw prices, never a stale cache.
It shows its working
Answers arrive with the charts, tables and tool calls behind them, so you can check the number instead of trusting a paraphrase.
Your own documents
Upload filings, decks and research. Ask across them and the answer cites the page it came from.
Agents and workflows
Multi-step research that runs the platform's tools for you — screen, pull the history, compute, compare, then write it up.
MCP, CLI and API
The same command catalogue from Claude, your own agent, a shell or your pipeline. The answer on screen is the answer your job gets at 4am.
You ask
“How does NVDA usually trade through earnings?”
It calls
→ ka.options_expected_move(NVDA)
It answers
NVDA has averaged a 9.2% absolute move on the day after earnings and closed higher 67% of the time. Two in three reactions land between −4.2% and +16.3% — the distribution is skewed right, not symmetric.
Every figure computed live from our own history — not scraped, not summarised.
Or start with