What's New
Product updates, improvements and fixes across the KlickAnalytics platform.
142 updates · clear
⚡ Formula Scanner — Visualize Trading Logic Like Never Before
We’ve just launched the Formula Scanner, a powerful new way to turn your trading logic into visual signals and actionable insights — directly on the chart.
🔍 What It Does
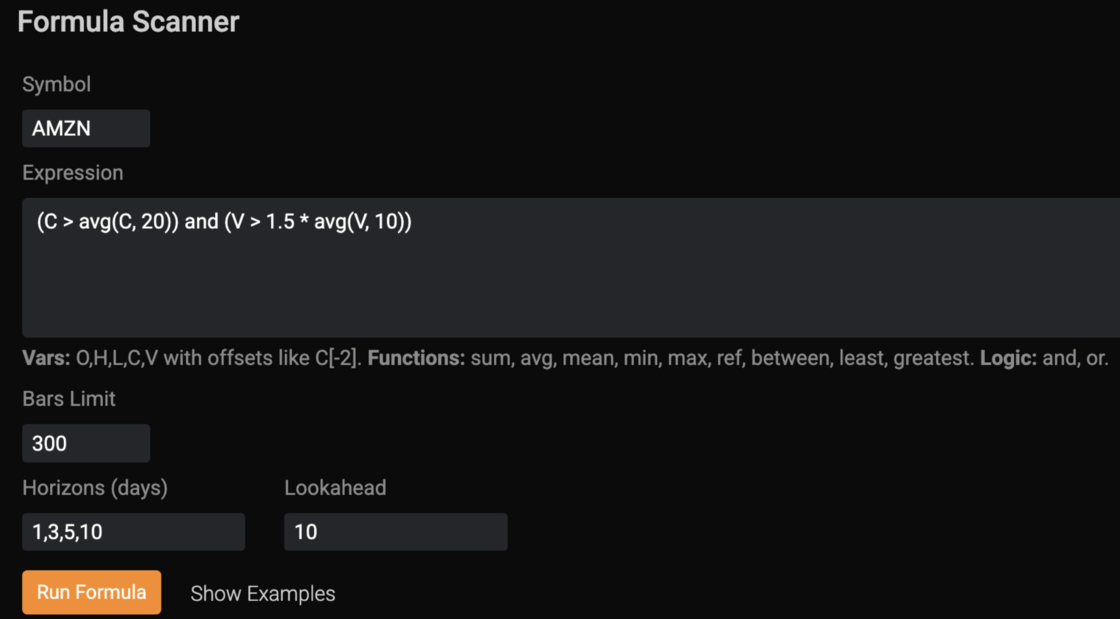
Define your very own custom trading condition using formulas with Open, High, Low, Close and Volume Prices like:
(C > avg(C, 20)) and (V > 1.5 * avg(V, 10))
Then click Run Formula — and the system will:
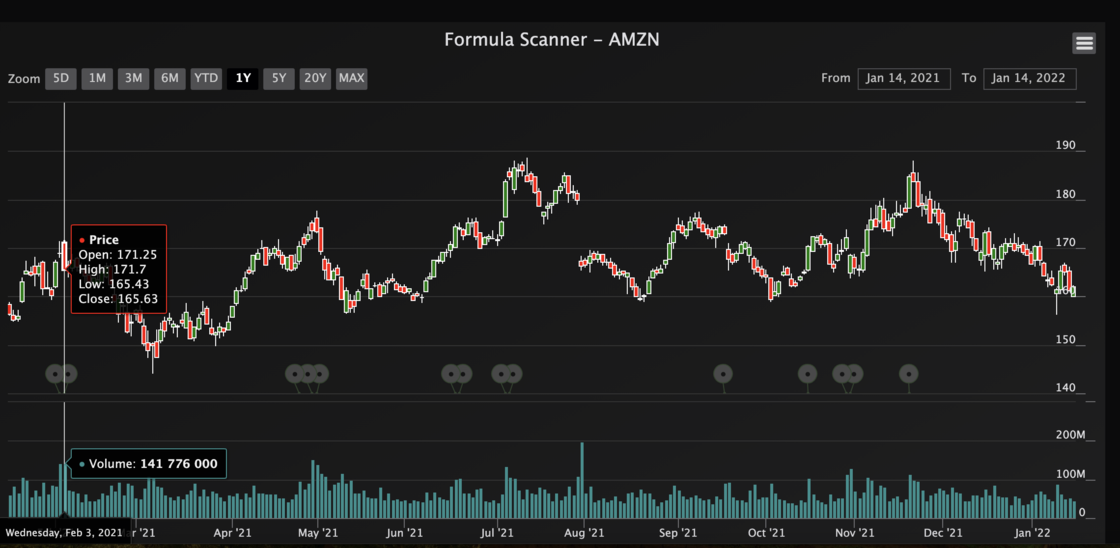
- Highlight matching events directly on the chart, showing every date your condition triggered.
- Generate detailed statistics across multiple horizons (1D, 3D, 5D, 10D) — including run-ups, drawdowns, and cumulative returns.
- List example events with full performance metrics for real backtesting context.
🧩 Features
Works with OHLCV data (O, H, L, C, V) and offsets like C[-2].
Supports built-in functions: sum, avg, mean, min, max, ref, between, least, greatest.
Logic operators: and, or, >, <, =, etc.
Dynamic horizons and lookahead windows for flexible event analysis.
Adjustable bars limit for faster scanning.
Full chart integration — see your signals visually, not just numerically.
📈 Benefits
Instantly test ideas — no need for complex coding or scripts.
See where your signal worked — visually on the price chart.
Understand performance distribution — best/worst runs, average outcomes, volatility after signal.
Turn formulas into trading logic that can evolve into automated strategies.
To access: From Menu > Tools > FormulaScanner
🔥 Now available in KlickAnalytics → Formula Scanner.
Build. Test. Visualize. — Your logic, your signals, your edge.
Side-by-Side News Viewer
We’ve made it faster and easier to stay informed.
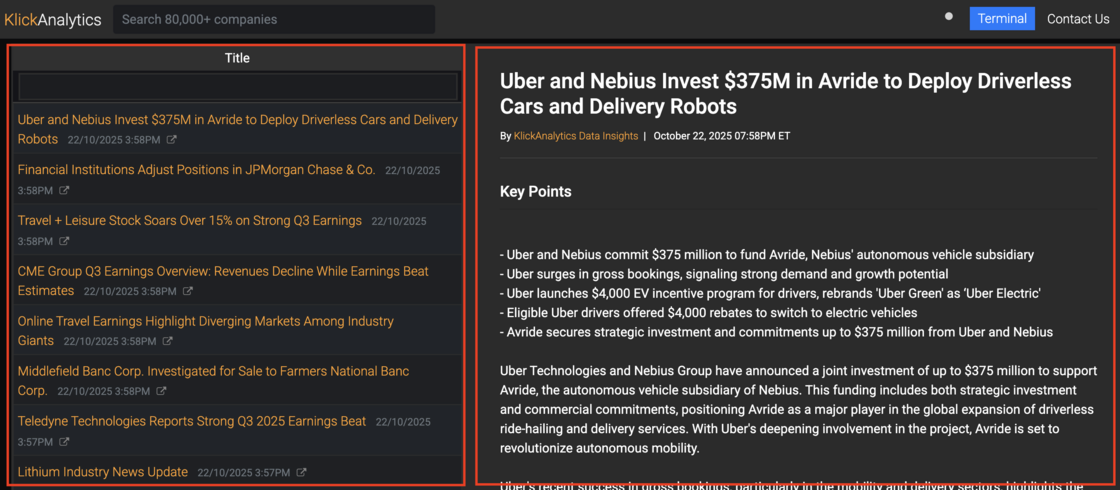
Our new side-by-side news layout lets you browse, filter, and read stories — all in one view.
🚀 What’s New
- Dual-pane layout — Browse the latest headlines on the left and read full stories instantly on the right.
- Instant preview — Click any headline to load the article instantly — no page reloads.
- Category filters — Quickly sort by category, ticker, or topic to find exactly what matters to you.
- Lightning-fast navigation — Switch between stories in milliseconds.
💡 Why You’ll Love It
Now you can scroll through dozens of stories, explore different market sectors, and dive into details — all without losing your place. It’s quick, fluid, and built for analysts who value speed.
Try it now in your News section and experience the new way to stay ahead of the markets — one click at a time.
Market Spreads & Ratios
See how one market stands against another—instantly.
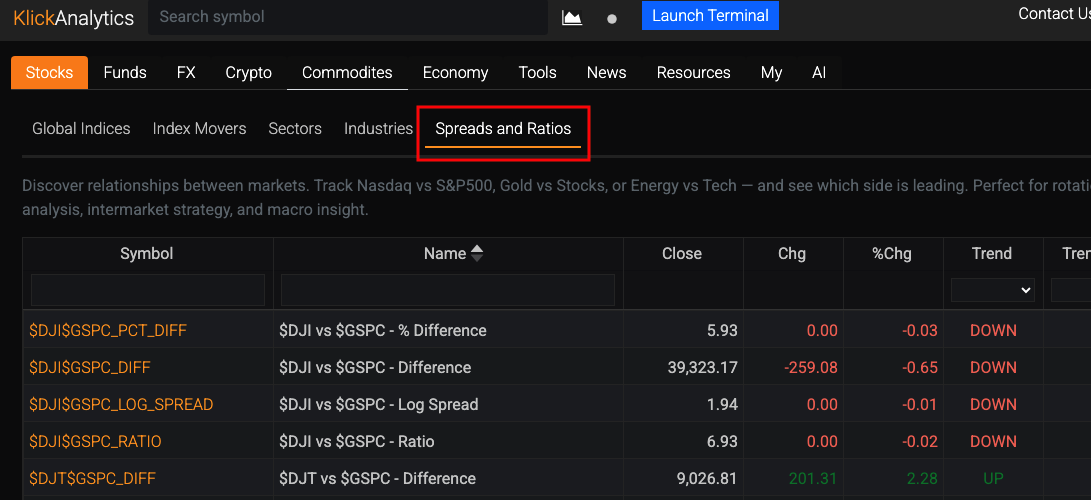
You can now chart synthetic pairs across major U.S. indices, sectors, factors, bonds, commodities, FX, and crypto—using metrics like DIFF, RATIO, PCTDIFF, and LOGSPREAD. Track classic relationships (e.g., XLY/XLP, IWM/SPY, SOXX/SPY, TLT/SPY, BTCUSD/QQQ) to spot leadership, rotation, and macro inflection points.
Why it matters
Find relative strength: See what’s leading vs lagging—across indices, sectors, and themes.
Time macro turns: Bonds vs stocks, USD vs gold, oil vs transports—view the spread, not just price.
Idea generation: Surface pairs breaking out or mean-reverting for faster trade discovery.
One click, clean math: No spreadsheets—metrics are computed and charted for you.
What you can do
Choose two symbols (we support $ prefixes if your symbol uses it).
Pick a metric: DIFF, RATIO, PCTDIFF, LOGSPREAD.
Plot as a time series, compare regimes, and add to your watchlists.
Example presets
Risk Appetite: XLY / XLP (consumer discretionary vs staples)
Size Rotation: IWM / SPY (small vs large)
Tech Heat: SOXX / SPY, XLK / SPY
Bond-Equity Pulse: TLT / SPY, IEF / TLT
Commodities vs Stocks: GLD / SPY, USO / SPY, GDX / GLD
Transports & Fuel: IYT / USO, DAL / USO, ODFL / UGA
Crypto Risk Proxy: BTCUSD / QQQ, ETHUSD / QQQ
Who it’s for
Traders: Rotation, spread setups, mean-reversion, and breakout scans.
Analysts/Economists: Intermarket confirmation (rates, FX, commodities vs equities).
Investors: Simple, visual context for portfolio tilts (value vs growth, defensives vs cyclicals).
Notes & conventions
Symbols are preserved exactly as you store them (including $ when applicable).
PCTDIFF = (A − B) / B and LOGSPREAD = ln(A / B).
You’ll see curated U.S. pairs out of the box; you can add your own anytime.
To access: From the top menu, click on Stocks > Indices > Spreads and Ratios
🗒️ Introducing Your New To-Do List!
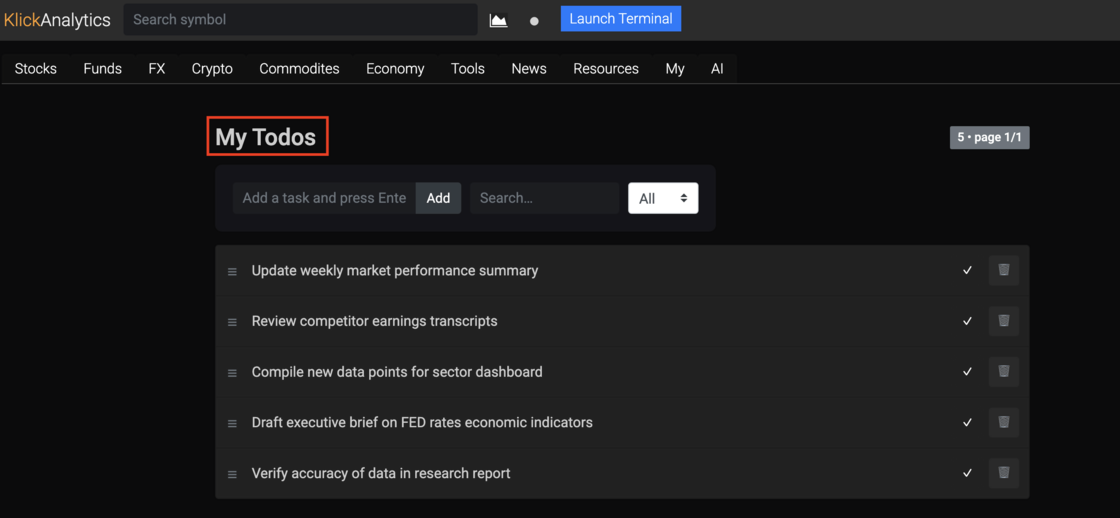
Stay organized and focused with our built-in task manager — designed to help our users manage daily priorities effortlessly.
✨ Key Features:
Quick Add & Edit: Create tasks instantly and edit inline — no page reloads needed.
Mark as Done: One-click checkmark to complete and archive tasks.
Smart Search & Filter: Instantly find open or completed tasks with real-time search.
Drag-and-Drop Sorting: Rearrange tasks by priority with a simple drag.
Pagination for Performance: Automatically organizes long lists for smooth navigation.
Mobile Friendly: Clean, responsive interface that works perfectly on any device.
💡 Why You’ll Love It:
Keep track of your research, meetings, and follow-ups in one place.
Replace sticky notes and spreadsheets with a sleek, centralized view.
Boost productivity by focusing on what matters most each day.
Start using your new To-Do List today and bring structure to your workflow — simple, smart, and fast.
To access: From the top menu > Tools > Todos
🚀 New Feature: Strategy Backtesting Tool
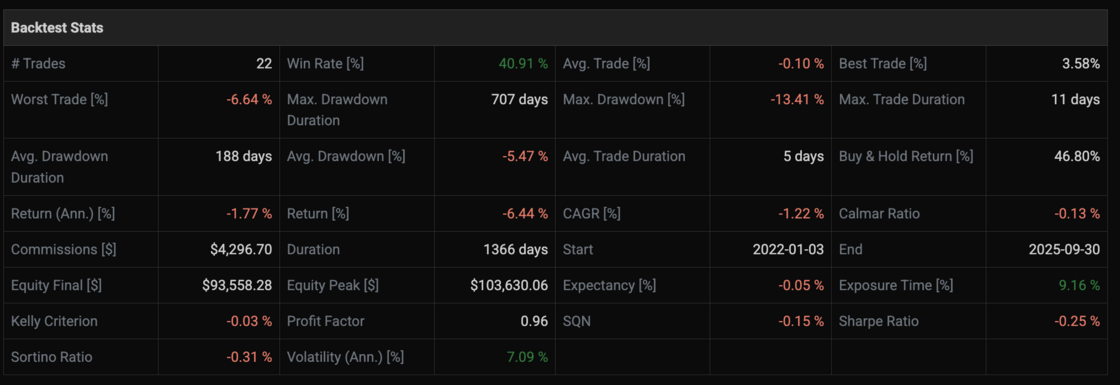
We’re excited to introduce our new Strategy Backtesting Tool, built to help traders and investors make smarter decisions with confidence.
With this tool, you can:
- Test trading strategies on real market data before risking capital.
- Customize parameters like stop-loss, take-profit, and position sizing to see how different approaches perform.
- Compare performance vs. buy & hold, giving you a clear picture of whether your strategy adds value.
- Visualize results with interactive charts showing equity growth and drawdowns over time.
- View full historical trades made by the backtesting engine and more.
This feature empowers you to validate ideas, manage risk, and refine strategies — turning raw data into actionable insights. Whether you’re exploring simple SMA crossovers or building toward more advanced strategies, this tool provides the evidence you need to trade with confidence.
To access: From the top menu > Tools > Backtest > Strategies
New Quant Tool: Black-Scholes Options Calculator
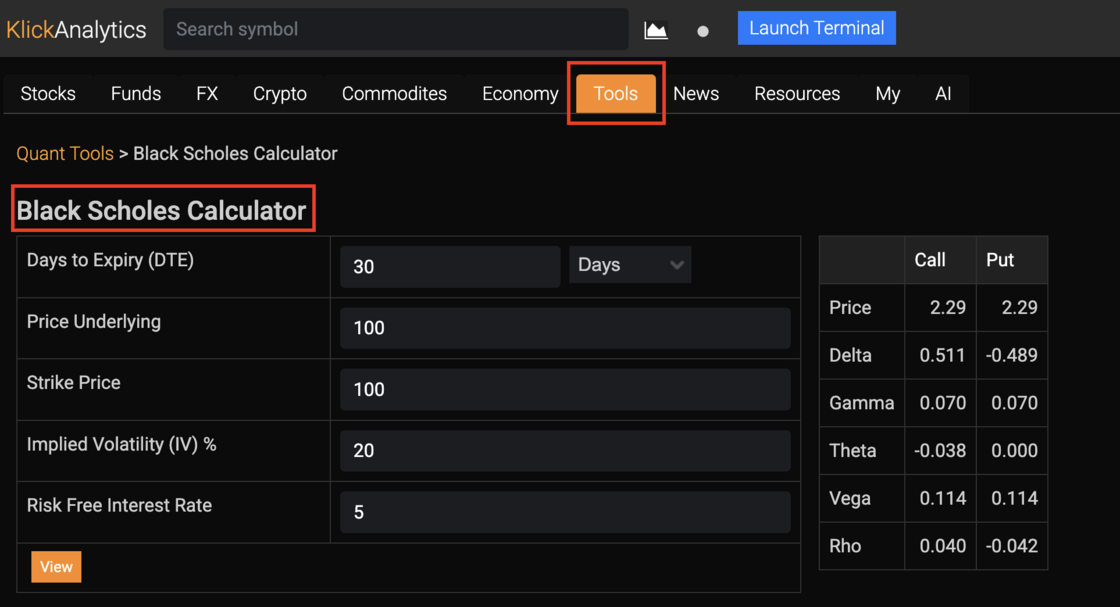
Now Price options and see Greeks in seconds with another quant tool at your finger tips.
Why it matters
- Instant, reliable pricing for quick sanity checks and “what-if” scenarios.
- Snapshot risk at a glance to choose strikes, hedges, and expiries faster.
Features
- Call & Put pricing with DTE in days or years
- Full Greeks: Delta, Gamma, Theta, Vega, Rho
- Inputs for Implied Volatility, Risk-Free Rate, and Dividend Yield
- Handy presets (7/30/90/365 DTE) plus custom values
- Clean, copy-friendly results in a dark-mode table
Perfect for
- Rapid pre-trade checks, education, and comparative strike selection.
To access: From the top menu > Tools > Quant Tools > Black-Scholes Calculator
All Apps: Markets • Data • AI • Quant
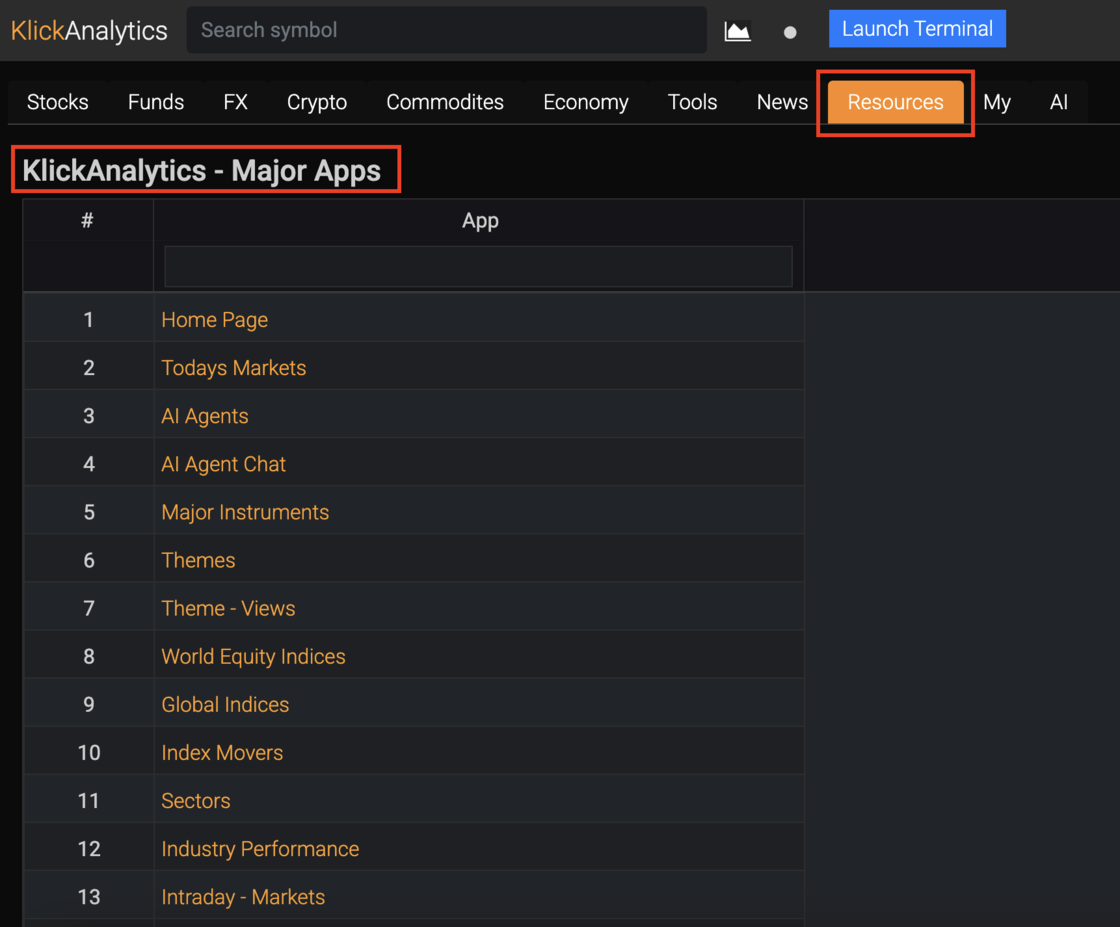
Discover the full catalog of KlickAnalytics apps—160 and counting—all in one place.
This list covers our major tools across Markets, Data, Pricing & Valuation, Technical Analysis, Fundamentals, AI & Machine Learning, and Quant Research. We’re continuously shipping new apps and enhancements, so check back often for the latest additions.
To access: From the top menu > Resources > Apps List
Launching Quant Tools: Close-to-Close Volatility Estimation
🚀 Introducing Quant Tools in KlickAnalytics
We’re excited to announce the launch of a new category in KlickAnalytics — Quant Tools. These are designed to give quants, traders, investors, and analysts deeper insights into market behavior using advanced quantitative techniques.
The very first tool we’re rolling out is the Close-to-Close Volatility Estimation (C2C Vol), which allows you to measure and analyze annualized volatility directly from daily price movements for any global instruments in KlickAnalytics.
This feature provides not only volatility series and historical stats, but also percentile ranks, spikes, and regime classifications to help you understand market risk and positioning like never before.
This is just the beginning — more Quant Tools are coming soon to expand your analytical edge. Stay tuned!
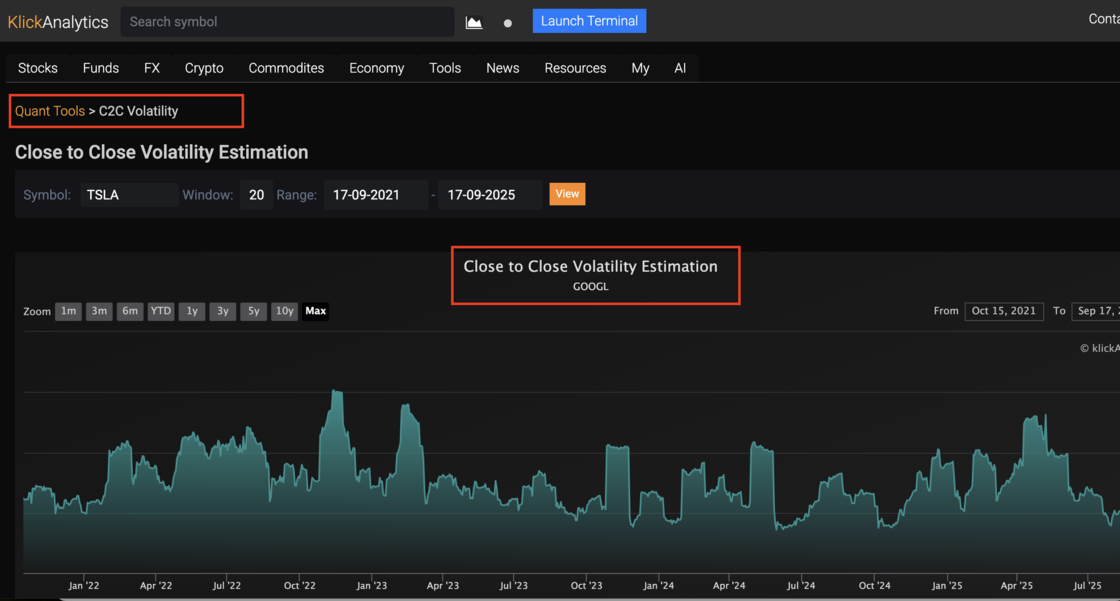
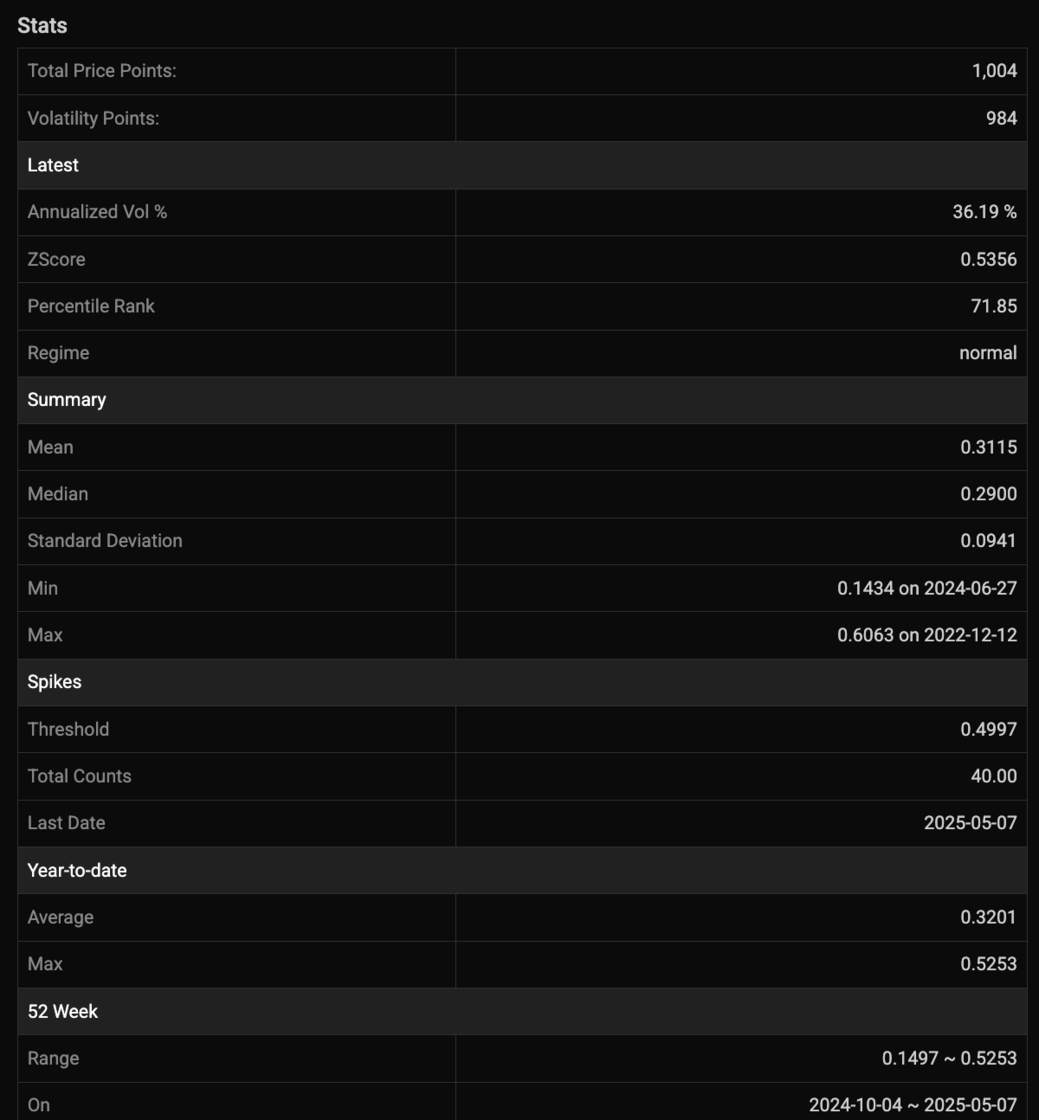
To access: From the top bar > Tools > Quant Tools > Close to Close Volatility Estimation
Meet Your Market AI Agents
Introducing our AI Financial Agents—now live and connected to our own market data for precise, shareable answers in seconds. Pick a segment-smart agent like Price Performance Analysis, Drawdown Tracker, or Trader Stats, ask in plain English, and get focused analysis (with starter questions included).
Paid customers can run up to 200 prompts per month across all agents. Open the AI tab, choose an agent, and start asking.
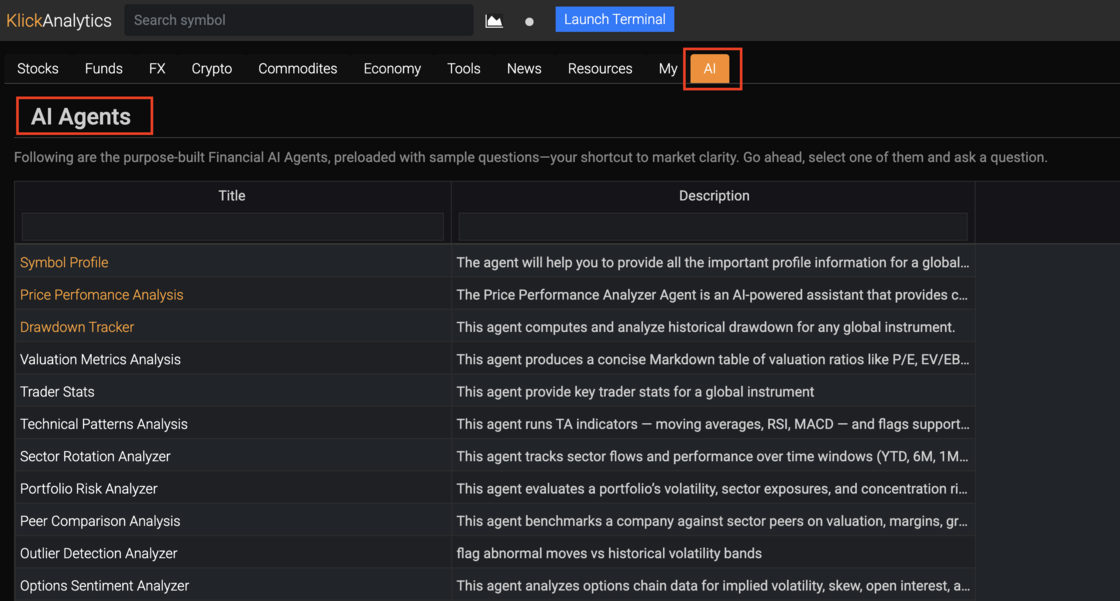
To access: Click AI > Agents from the top menu and access all the AI Agents.
In-App Support tickets (one-stop support)!
In-App Support Tickets (one-stop support) You can now submit and track support requests without leaving KlickAnalytics. Open Support ▸ + New Ticket (or Contact Us in the header) to file:
Data bug – prices, symbols, timestamps
Feature request – ideas to improve screens, charts, backtests
Account & billing – plans, invoices, access
Other – anything else
All replies happen inside the ticket thread (with status Open/Closed). Attach screenshots/CSVs, reply in-line, and keep everything in one place.
Pro tip: For data bugs, include symbol(s), timeframe, and a screenshot/snippet to speed things up.
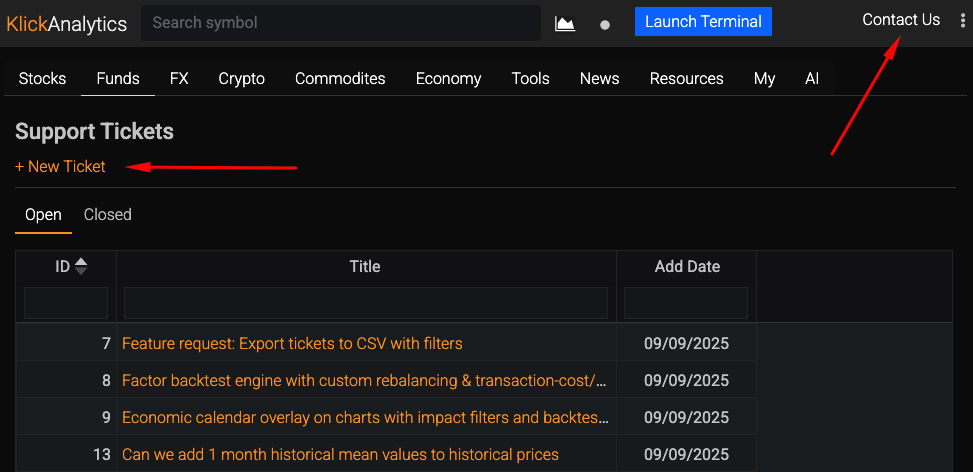
To access: After you logged-in to the platform, from the top line, click on 'Contact Us'
Ask the market a question. Get a calculated answer.
The AI is not a chatbot bolted onto a document store. It calls the same analytics engine that powers every screen on this platform — so what comes back is a number it computed from raw history, with the command that produced it.
86,000+ instruments
Global equities, ETFs, funds, options, FX, commodities, crypto, economics, filings, transcripts and news — one normalised symbol universe with adjusted history.
A real analytics engine
Screening, backtesting, technicals, options analytics, correlations, seasonality and factor models — computed on demand from raw prices, never a stale cache.
It shows its working
Answers arrive with the charts, tables and tool calls behind them, so you can check the number instead of trusting a paraphrase.
Your own documents
Upload filings, decks and research. Ask across them and the answer cites the page it came from.
Agents and workflows
Multi-step research that runs the platform's tools for you — screen, pull the history, compute, compare, then write it up.
MCP, CLI and API
The same command catalogue from Claude, your own agent, a shell or your pipeline. The answer on screen is the answer your job gets at 4am.
You ask
“How does NVDA usually trade through earnings?”
It calls
→ ka.options_expected_move(NVDA)
It answers
NVDA has averaged a 9.2% absolute move on the day after earnings and closed higher 67% of the time. Two in three reactions land between −4.2% and +16.3% — the distribution is skewed right, not symmetric.
Every figure computed live from our own history — not scraped, not summarised.
Or start with